Valuing lenders and insurance companies is tricky as the well accepted principle of discounting future cash flows does not work for Financial Services companies. These companies work under a regulatory framework which requires them to maintain a minimum capitalization level and also reinvest a large part of their earnings. Technically these firms have no/negative free cashflow. This anomaly leads to most investors either ignoring fundamental valuation methods or following thumb rules such as P/E and P/B multiples. At Marcellus we use the ‘Residual Income’ (RI) model to best capture the economic value add of a Financial Services company. RI is calculated as return on equity minus the cost of equity (RoE – CoE). Our job is to assess the ROE potential of the business and the longevity of the period during which ROE is in excess of COE. The greater the RoEs, the greater longevity of a lender or insurer, the greater the fair value of the business. The Kings of Capital Portfolio (KCP) stands out in Indian Financial Services with cross cycle RoEs ranging between 17-19%, well above the cost of capital.
Performance update of the live fund
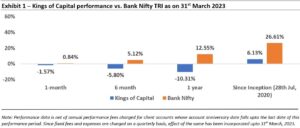
The key objective of our “Kings of Capital” strategy is to own a portfolio of 10 to 14 quality financial companies (banks, NBFCs, life insurers, general insurers, asset managers, brokers) that have good corporate governance, prudent capital allocation skills and high barriers to entry. By owning these quality financial companies, we intend to benefit from the consolidation in the lending sector and the financialization of household savings over the next decade. The latest performance of our PMS is shown in the chart below.
The challenge of valuing financial firms using Discounted Free Cash Flow (DCF) approach
The traditional DCF method: As is well understood by most investors, firms which are able to use their capital efficiently to generate free cash flows and then reinvest these free cash flows in high return opportunities year after year are the ones which compound investors’ wealth. While the idea of Free Cash Flows (FCF) is applicable to firms in most sectors, it is impractical for firms in the Financial Services domain.
In this newsletter, we explain why this is so and how we approach valuation of firms in the KCP universe. We also examine how the recent divergence in fundamentals and market assigned valuations offers a great opportunity for investors to load up on decadal compounding machines in the Indian Financial Services industry.
Different balance sheet composition: Let’s first take the issue of measuring ‘debt’ for Financial Services firms. Any given business can be financed using two options – debt & equity. While in non-financial firms the difference between the two can be easily determined by looking at the balance sheet, it is much more difficult to do so for a Financial Services firms. Consider a steel manufacturing company which uses debt to buy machines and land to convert the raw material (iron ore) into steel. In contrast, the connotation of debt is very different from Financial Services firms wherein debt is more like raw material itself.
Much like a steel company that molds the raw material into products which can be sold at a profit, Financial Services firms use their debt (i.e. money they have borrowed from either the bond market or taken from their clients in the form of deposits) to make loans and earn a Net interest Margin (NIM). Resultantly, the payments made to ‘debt providers’ in financial firms (like interest on savings accounts) is part of operating expenses rather than interest payment which needs to be subtracted from operating profits for calculation of Free Cash Flows to shareholders in financial firms.
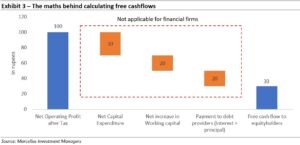
High reinvestment needs and hence lack of free cashflow: Reinvestment of free cashflows is a key element of future growth for non-financial firms. Such reinvestment mainly consists of two parameters – net capital expenditures (in factories, plant & equipment) and increase in working capital (which are subtracted from Operating profits for calculation of FCF). For Financial Services firms, measuring each of these parameters is an issue. Unlike manufacturing firms that invest in fixed assets like machines, land, etc., Financial Services firms invest primarily in intangible assets such as brands and human capital. As a result, the financial statement of a bank shows little or no capital expenditures and correspondingly low depreciation. That said, most banks need to keep reinvesting into their equity base simply to meet regulatory capital requirements as they grow their loan book. This may lead one to incorrectly assume lack of free cash flows.
Working capital can’t be calculated in the traditional way: A similar issue emerges with the calculation of working capital which includes items like inventories and amounts to be paid to suppliers (accounts payable) and received from customers (accounts receivable). Neither of these concepts are not applicable to a Financial Services firm. Using the simple accounting formula for working capital of “current assets minus current liabilities” (which is the formula used for non-financials firms) would be problematic for Financial Services firms as a large proportion of a bank’s balance sheet would fall into one or the other of these categories. Further, changes in this number can be both large and volatile and may have no relationship to reinvestment for future growth.
Consequently, neither the free cashflows nor the reinvestment rate (used for determining future growth) as used for non-financial firms can be used for valuing Financial Services firms.
Using the Residual Income method for valuing the KCP companies
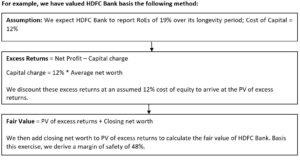
Given the challenge of determining the intrinsic value of a Financial Services firm using the typical DCF approach, we utilize the residual income or excess return method. For a detailed exposition of this method,pls refer to the paper written by Aswath Damodaran, renowned Professor of Finance at the Stern School of Business at New York University, in 2009. In such a model, the value of a firm’s equity is the sum of the equity invested in a firm’s current investments PLUS the expected excess returns to equity investors from these and future investments. In short,
Intrinsic (Fair) Value of Equity = Equity capital invested currently (i.e. current book value) + Present value of Expected excess returns to Equity investors (i.e. ROE – COE)
This concept is similar to that used for determining Net Present Value (NPV) of any project wherein the NPV is positive only if the project earns returns higher than the cost of capital. Analogously, a Financial Services firm that is expected to earn returns higher than its cost of equity would ideally have a fair value higher than the equity capital currently invested (i.e. its book value) while a firm which struggles to do so should have a fair value lower than the current equity capital. Let’s understand this using a simple example.
The returns earned by a financial firm are captured by its RoE. A firm with a current book value of Rs. 100 and RoE of 12% would grow its book value to Rs 112 in the next year. The Present Value (PV) of the firm discounted at cost of equity of 12% (112/(1.12)) would be equal to the current book value of 100 in this case. As long as the firm keeps earning returns at the same rate as cost of equity (i.e. ROE=COE), the present value would always be equal to the current book value.
On the other hand, let’s say the firm earns RoE of 15%. In this case the PV would be 115/1.12 = 102.7 which is higher than book value of 100 due to the excess return of 3% (i.e. ROE = COE+3%). In the same vein, a firm earning RoE of say 10% would have a PV of 110/1.12= 98.2 which is lower than book value of 100 due to negative excess returns (i.e. ROE=COE-2%).

The excess returns in the future years are dependent on two key factors:
Whilst the firm’s expected Return on Equity (RoE) can be gauged by looking at the firm’s history, a more fundamental way to think about this is that ROE is a function of the firm’s core strengths and weaknesses. If one was to plot the market value to book value (i.e. P/B) chart vs. RoE for Indian banks, the correlation between the two becomes evident. Notice how it showcases the idea discussed in the previous exhibit.
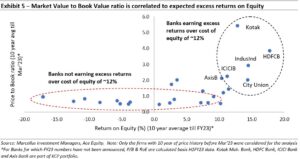
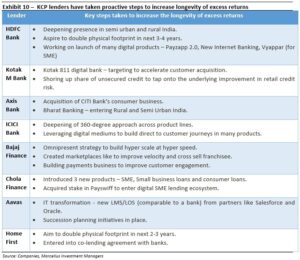
The period for which such excess returns can be earned in the future (or the longevity of excess returns) is dependent not just on current competitive advantages but also steps taken by a firm to further strengthen its business’ moats including addition of new revenue growth drivers and technology investments to improve customer experience and reduce costs. Softer aspects like succession planning, corporate governance as well as management/board quality also play a key role.
The longer the period over which excess returns (i.e. ROE > COE) can be earned, the higher would be the present value of the firm.
Both these inputs are determined using our longevity framework which assesses each KCP lender not just on current competitive advantages but also steps taken to further strengthen its business’ moats, add new growth drivers as well as softer aspects like succession planning, corporate governance as well as management and board quality.
The disconnect between business strength and market valuations has only increased over the last few years
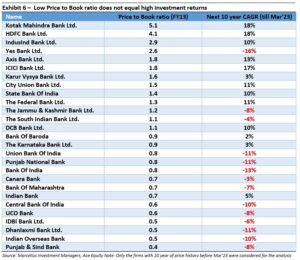
While many of investors tend to make investment decisions based on the prevailing price multiples, such multiples do not capture the value of India’s decadal compounders. In the table below, we plot the P/B ratio for Indian banks as of FY13 alongside the next 10-year share price CAGR (until Mar’23). As can be seen quite clearly, it’s the ‘expensive’ lenders (i.e. the ones with the highest value of Price to Book ratio) which’ve generated the highest returns.
This is an important point to highlight because as discussed in previous sub-section the Price to Book Ratio is a reflection of firm’s ability to generate excess returns in the future – NOT a signal of over/under valuation. As highlighted in the exhibit below and in our Feb, 2021 newsletter titled ‘Indian Financials: The antithesis of traditional value investing’, a low price to book ratio in itself does not have any predictive power and generally suggests a poorly run lender.
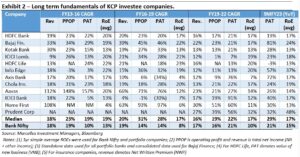
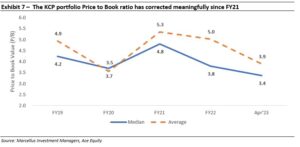
Over the last few years, even as the business fundamentals of KCP companies have remained strong (as highlighted in exhibit 2) the valuations of these firms have come down.
As discussed in our Feb’23 and Jun’22 newsletters, India’s best lenders are able to generate high Return on Assets (RoA) and RoE year after year which in turn allows them to reinvest higher amounts back into their equity base for future compounding. These high RoA and RoE figures also set a flywheel in motion allowing for higher investments in technology and personnel which in turn allows for both higher business growth as well as more operational efficiencies – leading to higher returns in future. These steps allow for an increase in both the quantum as well as the longevity of excess returns earned on invested equity.
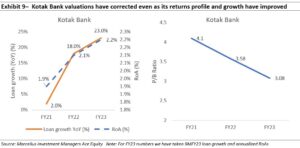
Additionally, as we highlighted in our Dec’22 dated newsletter, Financial Services firms in particular are susceptible to non-linear business risks which can evaporate a mediocre franchise’s future ‘excess returns’ (ROE>COE) almost overnight. KCP lenders have not only demonstrated their ability to survive through successive crisis but have used such crises to make their business even stronger. However, the stock market has been underappreciating these characteristics as can be exemplified via the divergence in fundamentals vs. valuations of two of the best lenders in the Indian banking system – HDFC Bank and Kotak Mahindra Bank (see the exhibits below).
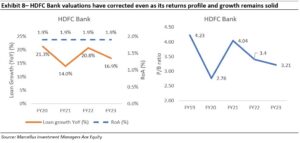
One can also see the prevailing disconnect between fundamentals and valuation of HDFC Bank by comparing these parameters to those of the Nifty index: HDFC Bank trades at 20x trailing profits (adjusted for subsidiary value) whilst growing profits at 20% CAGR and with an RoE of 18% as compared to Nifty 50 which produces profit CAGR of 13% with RoE at 13% and trades at 21x TTM EPS.
We remain confident as ever in the underlying business strength of KCP lenders which continue to generate strong PAT growth at market leading RoE metrics. With incremental steps being taken by them to improve the longevity of excess returns (and have a higher intrinsic value than that implied by the market currently) the prospective future returns likely to be generated by these lenders has only become better.