In this month’s newsletter, we ask whether the Rising Giants (RG) stocks were ‘richly’ valued when we bought them? Using an earnings growth of 20% (5% for the terminal year) and cost of capital of 12%, the median longevity implied by the then prevailing market prices for the RG portfolio rose from 8 years as at FY18-end to 16 years at FY22-end (before dropping to 11 years at FY23-end). While it is impossible to determine the longevity of future earnings with 100% certainty, (i) the track record (many RG companies have clocked 20%+ growth for at least 20 years); (ii) significant strengthening of the core business, addition of new growth drivers and institutionalisation of the business in recent years; and (iii) much faster growth in Free Cashflows vs earnings indicate significant valuation headroom both in 2021 and today.
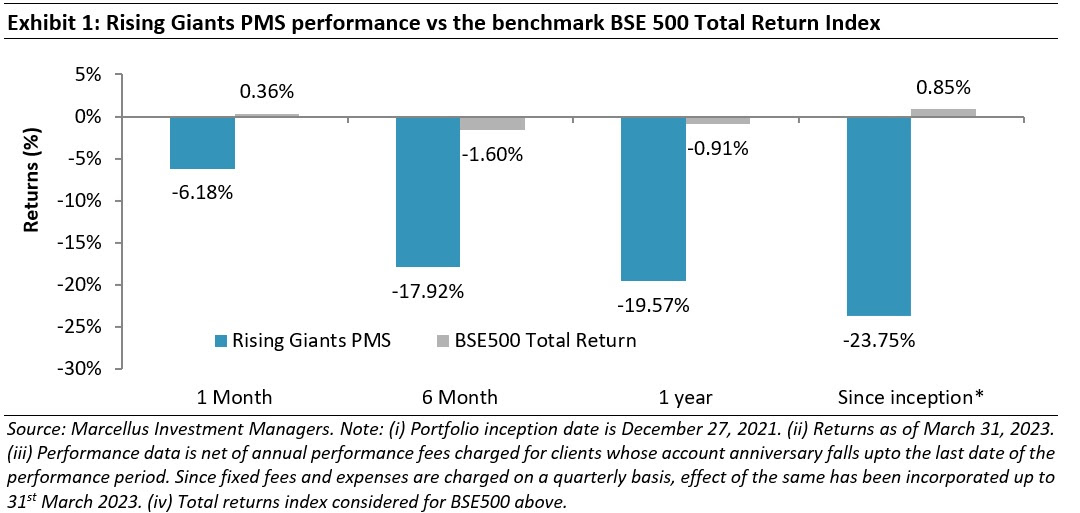
Performance update for the Rising Giants PMS
Portfolio changes – addition of Divi’s Laboratories to the Rising Giants Portfolio
We have recently added Divi’s Laboratories Limited to the Rising Giants PMS portfolio. The investment rationale is outlined below:
Divi’s Laboratories is a Hyderabad based pharma API and intermediate manufacturer. Divi’s has two primary business segments:
- Manufacturing small molecule APIs in its custom synthesis segment for western pharma innovator companies; and
- Manufacturing and selling of its own catalogue of generic small molecule APIs.
Divi’s key strengths are its outstanding regulatory compliance track record, long standing relationships with big western pharma companies for CRAMs (Contract Research and Manufacturing Services) business, capabilities for rapidly developing efficient processes for scaling up of production from lab scale to commercial volumes as per clients’ requirements and its cost-efficient bulk production of generic APIs for global clients.
Divi’s is among the world’s top 3 API manufacturers in terms of production volumes. It is a global leader in production of few APIs (like Naproxen, Dextromethorphan, etc.) and accounts for over 50% of their global production. The Company has used its capabilities to continuously grow its business in a profitable manner and has delivered revenue CAGR of 17%, EBITDA and PAT CAGR of 19% and an average RoCE of 30% over the last 10 years (FY13 to FY22).
Considering the business strengths, opportunities arising from increased outsourced manufacturing to India and the scale up of capacities, addition of new products and deepening of relationships and trust with clients, we expect the Company to deliver healthy free cash growth over the next 5 years.
Was the Rising Giants portfolio companies richly valued at the point of purchase?
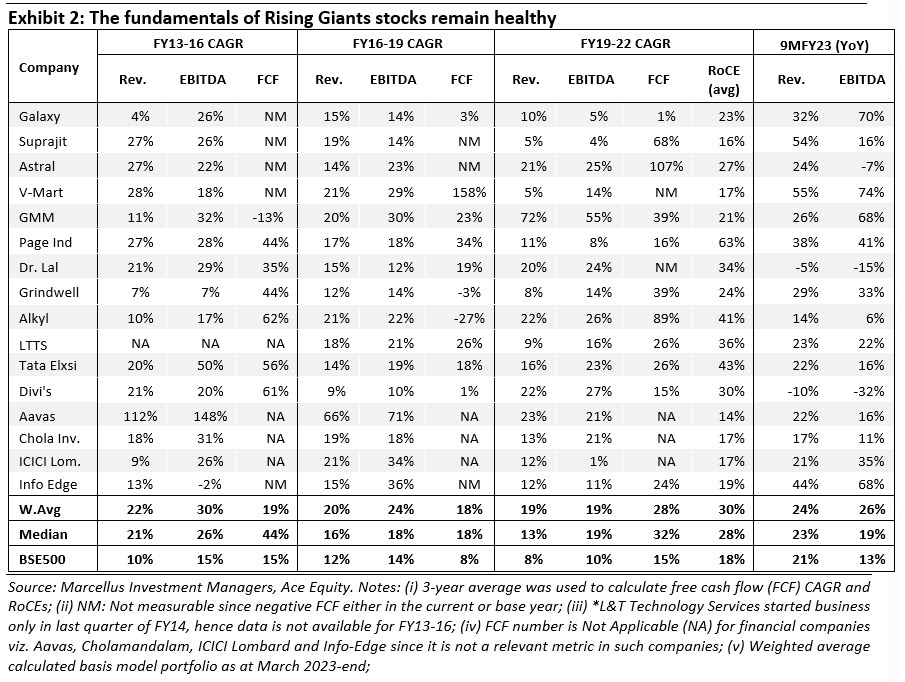
Rising Giants (RG) companies continue to outperform the broader BSE500 index on fundamentals (basis 3QFY23 as well as 9MFY23) as shown in the below exhibit. However, at the same time, there has been significant disconnect between the fundamental and the share price return performance.
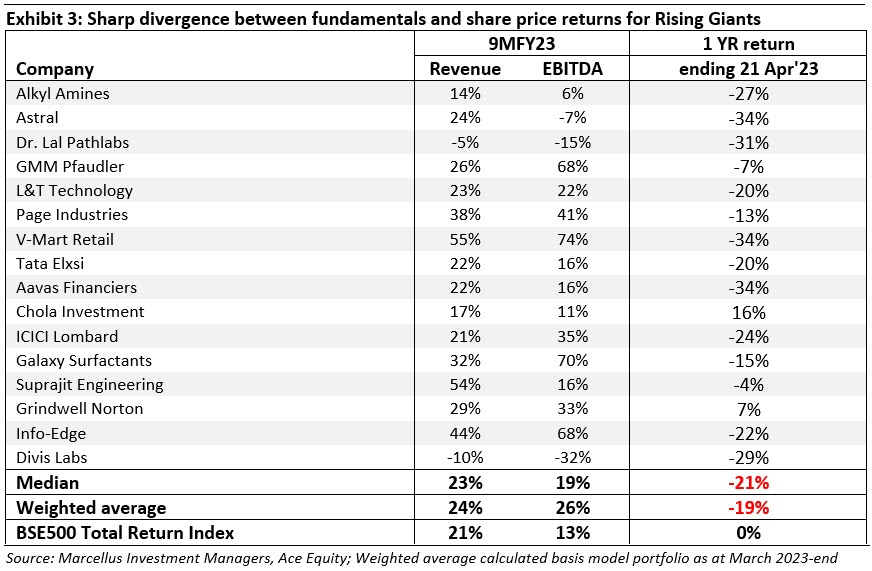
While we have discussed this disconnect between fundamentals and returns in the earlier newsletters and webinars, in this month’s newsletter, we discuss one of the most often question posed to us over the last 12 months – Whether the RG stocks are ‘richly’ valued and/or did we enter stocks (in 2021) at their peak valuations which has led to the above situation of disconnect between the fundamentals and share price returns?
We analyse this by using one of the most commonly used valuation metrics – i.e. the Price to Earnings or P/E Ratio. Over the past year, the share price of RG companies has not kept pace commensurate with their earnings growth. Consequently, the P/E multiple of the portfolio has corrected to such an extent that many portfolio companies are now trading at near about similar P/E multiples at FY18-end (as can be seen in the exhibit below).
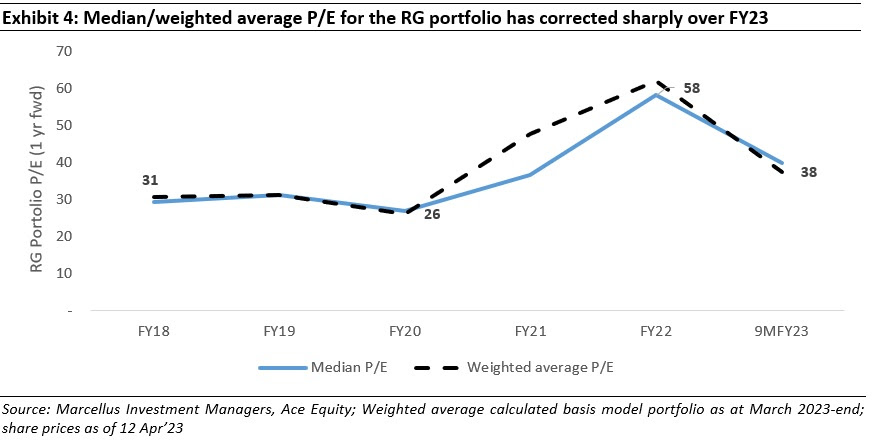
However, in the last 5 years, there have been intermittent periods when the headline P/E witnessed significant expansion – for instance between FY18-end to FY22-end, the portfolio median P/E nearly doubled from 31x to 58x. While a common reaction to this expansion in P/E would be that RG companies had become richly valued when we invested in them in 2021, we differ with this assessment.
Assessing the reasonableness of market price implied longevity at peak P/E multiples
Before we get into further details, it’s important to first understand what we mean by ‘longevity’. Our readers would’ve come across this word in previous discussions of Marcellus’ Longevity Framework which our analysts use to score companies basis the business’ strengths and weaknesses. Simply put, longevity refers to the number of years in the future we expect a company to enjoy competitive advantages and thereby compound its earnings and Free Cashflows at a healthy rate of 20%+ before the growth tapers off to a rate similar to the rate of inflation (around 5%).
The higher the longevity period (i.e. the longer the period of superlative growth), the higher would be the valuation of a given business. Businesses which have strongly moated franchises, good capital allocation skills that result in growth drivers and have institutionalized succession planning are able to keep extending their longevity decade after decade resulting in commensurate wealth compounding for shareholders.
The P/E ratio that we’ve shown in Exhibit 4 is a result of stockmarket’s expectations around the longevity of our portfolio companies. As we’d written in one of our earlier newsletters, the stockmarket has a tendency to consistently undervalue deeply moated franchises by underappreciating the future period over which the business can continue to see high double digit growth. In this section, we try to ascertain what the market’s expectation of such a period is (in number of years) for our portfolio companies – something we refer to as ‘market implied longevity period’. It’s a number which is back calculated using the P/E ratios in Exhibit 4.
Exhibit 2 shows that the RG portfolio companies have consistently delivered ~20% earnings growth over long periods of time including over the FY19-22 period as well as in the latest 9MFY23 period. Using this growth rate, a cost of capital of 12% and terminal growth of 5% (without assuming any fade period), we compute what is the market implied longevity period for the RG portfolio at different points over the last 5 years in the below exhibit.
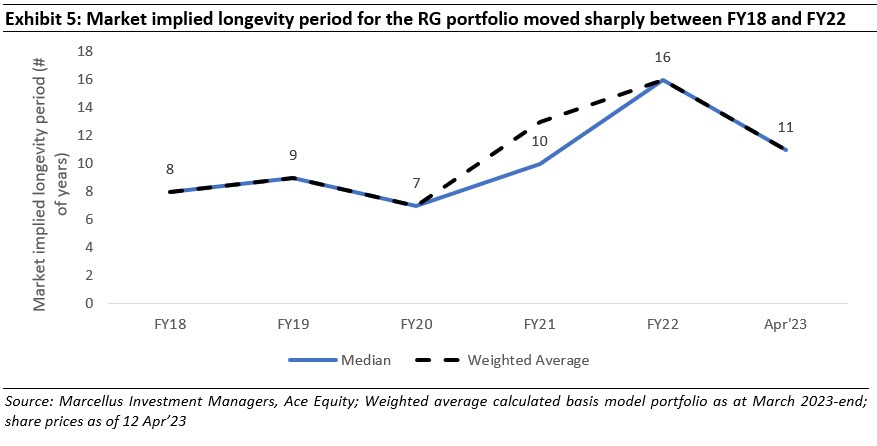
The market implied longevity of the RG portfolio was 8 years at FY18-end i.e. the market expected the competitive advantages for our portfolio companies (on median basis) to last for 8 years after which they would turn into run of the mill franchises that grow earnings at mid-single digit rates.
From 8 at FY18-end, market implied longevity of the RG portfolio rose to 16 years at FY22-end before falling to 11 years at FY23-end.
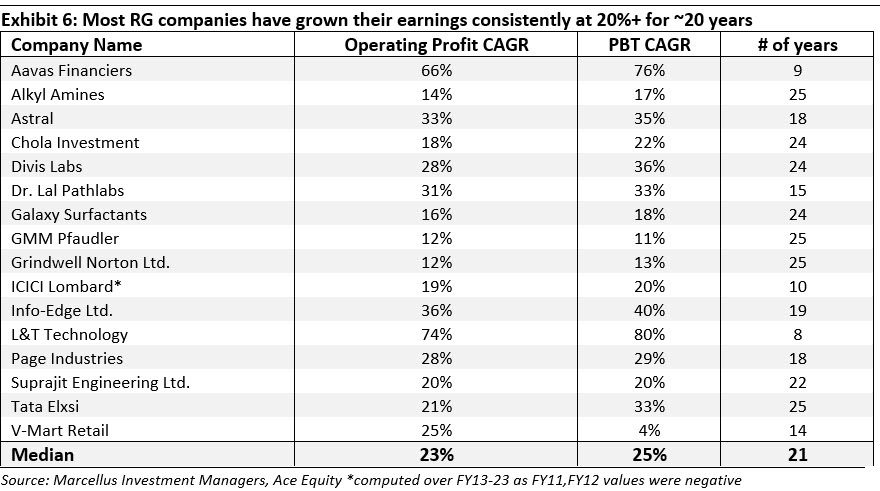
Was these 16 years of implied longevity in FY22 too optimistic for the RG stocks? In other words, were the stocks were ‘overvalued’ at that point (FY22)?
- While no one has the crystal ball to make a call on this aspect with certainty, what we do is see how our portfolio companies have managed to grow their earnings in the past. As can be seen in the table below, most RG companies have grown their operating earnings at 20%+ levels for long periods of time. Many RG companies have in fact compounded earnings at 20%+ for 20 years or more. In fact, the number of years shown in the below exhibit for many companies could have been higher but for shorter operating history/data availability including for some of the portfolio companies which were listed in recent years (Aavas, LTTS, Dr Lal, ICICI Lombard, etc).
- Secondly, we believe the longevity for the RG portfolio should be higher than it was five years ago due to the structural transformation of these companies between these periods through:
a)Strengthening of the core business through investments in capacities, distribution expansion, and technology. For instance, our October 2022 newsletter explains how Rising Giants have been at the forefront of implementing tech solutions to sustain their competitive advantages, drive efficiencies (around cost, working capital and asset utilisation) and build scalable organisations.
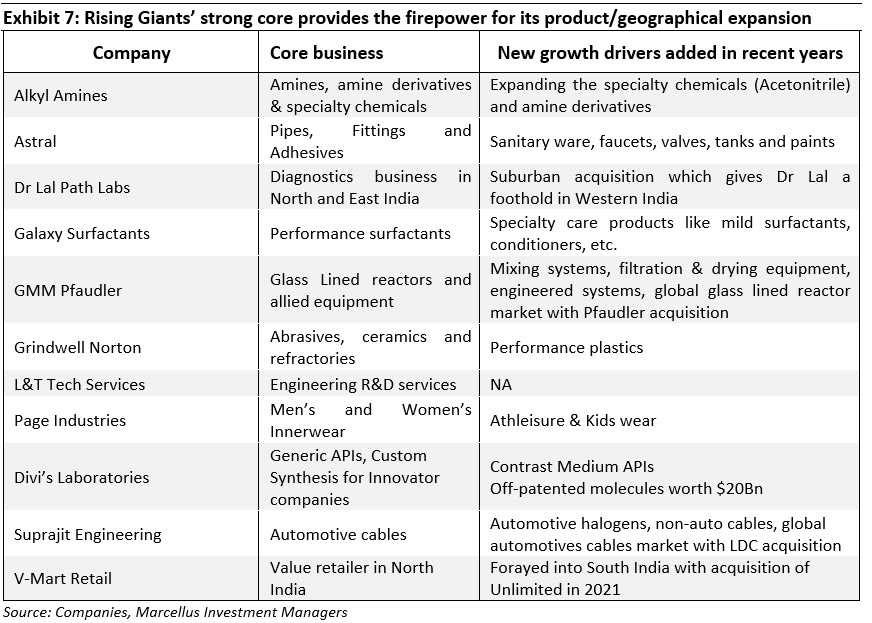
b)Similarly, we discussed in our November 2022 newsletter how the Rising Giants have used the free cash generated by the core business to seed new growth drivers as shown in the below exhibit. These new growth drivers (seeded in the recent years) are already contributing significantly to the revenues or are likely to do so in the coming years, thus enhancing the longevity of the cash flow generation for the RG companies.
- In fact, both the above points around strengthening the core franchise and developing new streams of revenues have been the key success factors behind RG companies compounding their earnings for long periods of time as discussed earlier. Further, in several of these companies, there has been positive developments around the institutionalisation of the management to help nurture the increasing size and scale of the business – please refer our August 2022 newsletter for further details.
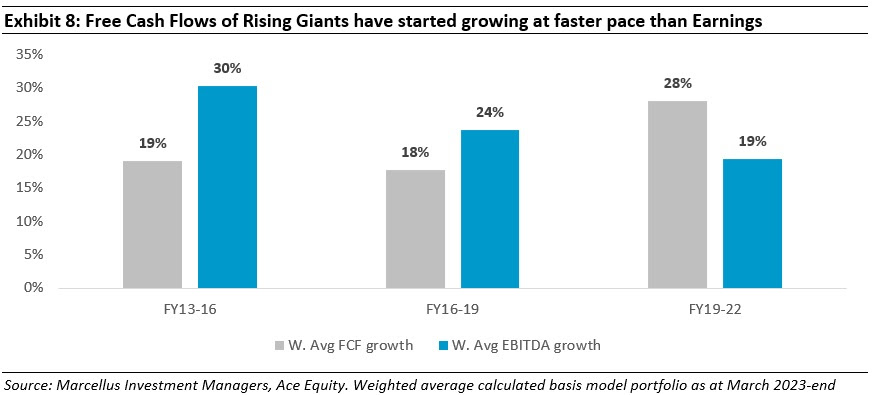
- Lastly, in the recent years, many RG companies have been improving their free cash flow (FCF) conversion(measured using Free cash as a % of EBITDA or earnings) on the back of operational efficiencies and technology investments resulting in reducing costs, higher asset turnover and better working capital management – in short their free cash flows are growing faster than the underlying earnings as can be seen in the FY19-22 period in the below exhibit. A P/E ratio which is mainly based on earnings is not designed to capture this non-linear growth in free cash flows.
Drawing conclusions on valuation basis headline P/E may be misleading
One of the main reasons why the stockmarket tends to consistently undervalue multi-decadal compounders is because of underappreciation of the growth in the cash flows as well the longevity of such growth rates basis the above parameters.
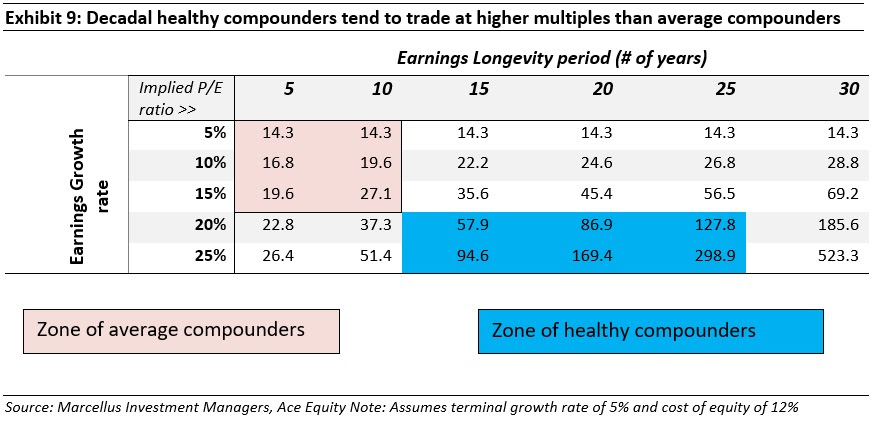
As shown in the exhibit below, the stockmarket views P/E multiples in the 15-30x range as being ‘fair value’. However, 15-30x P/E is fair value only for companies with modest growth rates (upto 15%) and longevity periods (upto 10 years). On the other hand, champion compounders differentiate themselves from the rest by consistently growing their earnings by 20%+ decade after decade. The P/E measure for such companies materially understates both the fair valuation deserved by such compounders as well as the potential of their long-term wealth generation.