Starting this month, we are rolling out a joint newsletter across our four domestic PMS Products. In this edition, we revisit the basic principles underlying Marcellus’ investment philosophy i.e. a firm’s ability to generate Free Cashflows (FCF) and grow them at a healthy rate sustainably over the long term. We take a look at: a) what separates a firm with high capital efficiency vs. a firm with low capital efficiency; b) how FCF generation ability and longevity of FCF growth vary over the lifecycle of a firm; c) why reinvestment of FCF is critical for wealth compounding; and d) how the best compounding machines are able to keep improving their own capital efficiency year after year. Marcellus’ portfolio companies have continued to showcase a high degree of resilience in their earnings growth over the last 18 months even as their share prices have come off by 30-40% over this period.
Understanding the key driver of investment value: Free Cash Flow (FCF)
“The ideal business is one that earns very high returns on capital and that keeps using lots of capital at those high returns. That becomes a compounding machine” – Warren Buffet as quoted in The Snowball: Warren Buffett and the Business of Life
Marcellus’ investment philosophy has been centred around investing in businesses with three C’s – Clean Balance Sheets, strong Competitive Advantages vs. peers and superior Capital Allocation skills. A core tenet of this potent combination is the ability of these businesses to generate Free Cashflows (FCF) and grow them at a healthy rate sustainably over the long term.
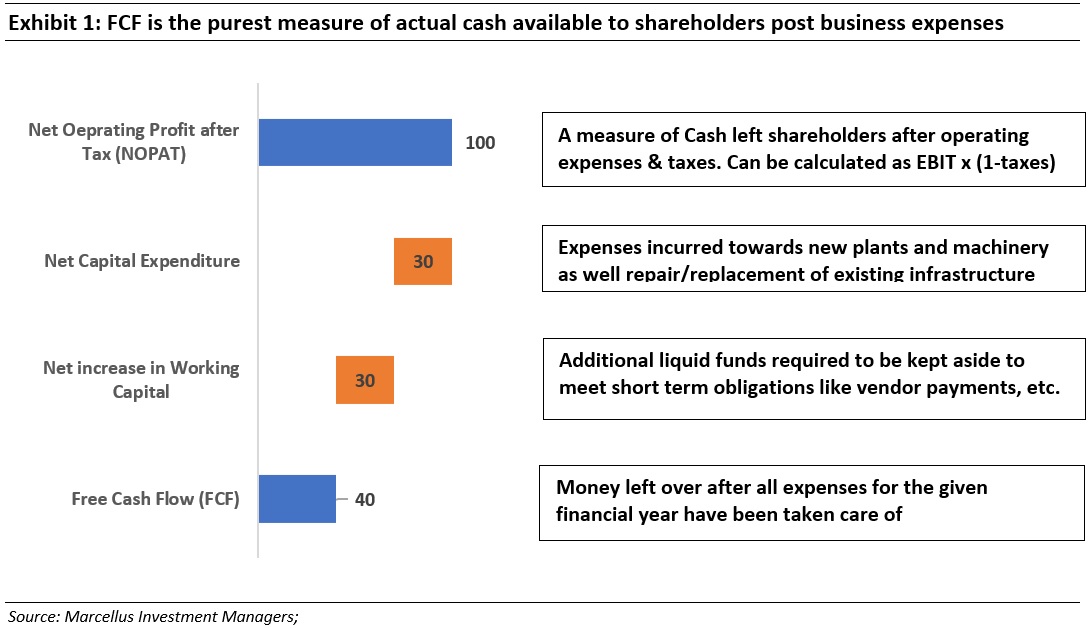
What is FCF? FCF is the cash left over for distribution to shareholders after providing for all the firm’s commitments with respect to core operations (raw materials, payroll expenses, etc.), capital expenditures (new plants, machineries, etc.) and increase in working capital (money set aside to meet short term obligations like payments to vendors, etc.) – see exhibit below.
Income statement parameters – like Operating Profit (EBITDA), Net Profit (PAT) and per share earnings (EPS) – do not adequately reflect how efficiently the capital of the company is being utilized to generate earnings. Furthermore, metrics like PAT are also prone to accounting shenanigans by a company’s management (for example by tweaking the Depreciation method and reducing depreciation expenses to increase reported profits).
Consider a simple example below:
Two firms A and B have exactly same income statement metrics, like revenues (say Rs. 1000), operating profit or EBITDA (Rs 500) and same net profits or PAT (Rs 100). However, their capital efficiency (measured as Return on Capital Employed or RoCE) is different. Firm A has an RoCE of 10% while Firm B has an RoCE of 40%. This means that to generate Rs 100 of Net Profit, Firm A deployed (100/10%) or Rs. 1000 of equity capital. Firm B on the other hand, deployed (100/40%) or Rs 250 only to generate the same profit.
RoCE is the measure of how much profits a company is able to churn out from use of its invested capital in the business. Why is ROCE important?
It is important because to achieve growth in profits next year and in the future, additional capital will need to be deployed back into the business. The amount of capital needed in turn would be dependent on the firm’s RoCE. Let’s continue the example above to see how this plays out.
To achieve a growth of 10% in net profits i.e. from Rs. 100 to Rs. 110, Firm A would need to deploy additional capital of Rs. 100 (calculated as increase in profit of Rs. 10 divided by RoCE of 10%). To achieve the same growth of 10%, Firm B on the other hand would need to deploy additional capital of only Rs. 25 (calculated as increase in profit of Rs. 10 divided by RoCE of 40%).
This additional capital which is needed to fuel future growth comes out from the profit base of last year. So, Firm A would need to put in ENTIRE profit of Rs. 100 that it had earned back into the business to generate profit growth of 10%. Firm B on the other hand, needs to invest only Rs. 25 and hence is left with Rs. 75 for the equity holders. This cash which is left over is the Free Cashflow.
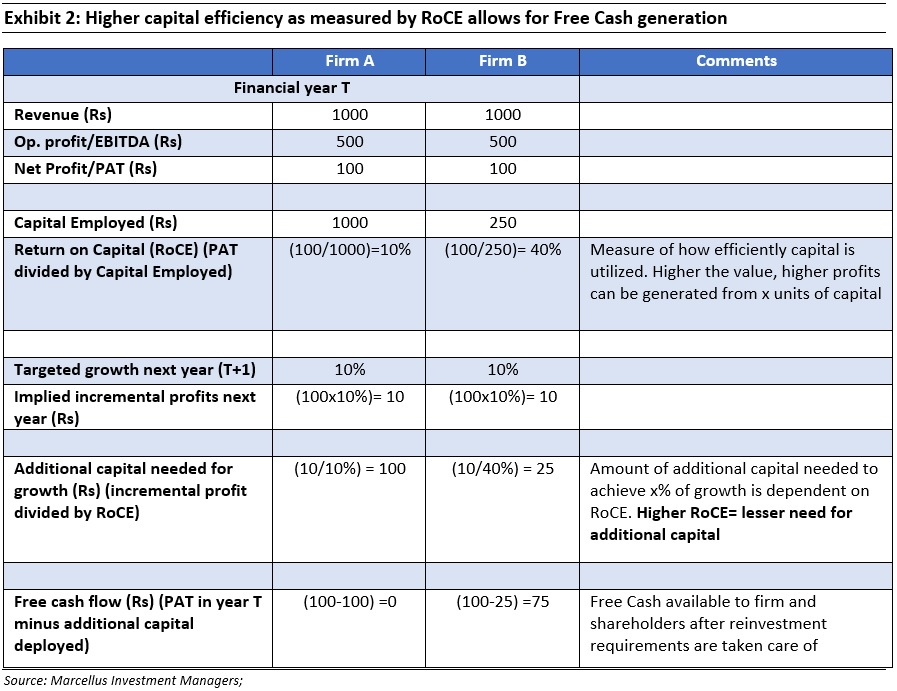
Notice that prima facie both firms look the same – same profits, same margins and same growth. However, the differences in their ROCEs is a defining difference – one firm is left with no cash after growth capital is taken out while the other is left with 75% of net profits from last year.
This free cash flow available can be used in three ways:
- Return capital back to shareholders through dividends/share buybacks
- Invest higher amount into the business to generate even faster growth. For example, Firm B can redeploy entire profit of Rs. 100 and generate Rs. 40 of additional profits (or 40% growth) vis-à-vis only 10% for Firm A.
- Build its cash buffers to be able to capitalize on opportunities during times of distress. For instance, Firm B in the above example can just set aside Rs.75 for later use when an opportunity to acquire high quality asset at distressed prices presents itself.
This ‘optionality’ which becomes available to Firm B (as to how it uses the leftover free cash) is what makes FCF generation a much more important measure of business’ quality than simple profit measures like PAT.
Sustained growth in free cashflows is driven by ‘Healthy rate of capital reinvestment with high ROCE’
All of this being said, the ‘ability to generate high free cashflows in future’ is not the biggest driver of value for a shareholder. An even bigger driver of value is the firm’s ‘ability to sustain a high rate of growth in free cashflows’ in the future.
Let’s understand this by comparing various types of businesses at different stages in their lifecycle (highlighted in the exhibit below).
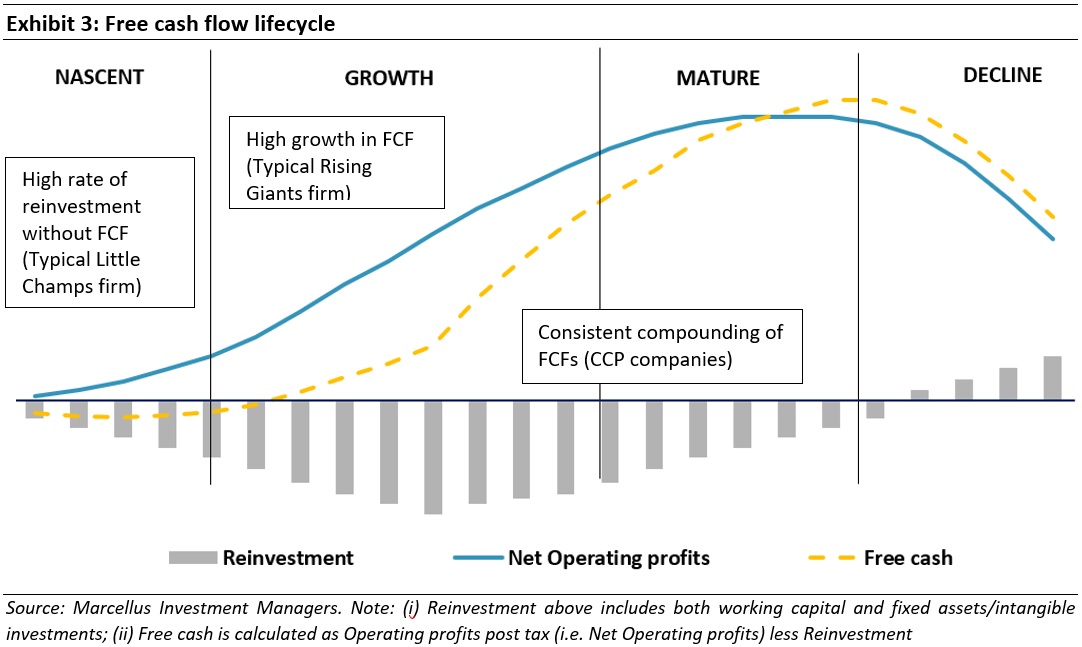
During the Nascent phase, the Company’s revenues are growing but small & insufficient to cover the operating costs (most of which are fixed and to an extent front ended in nature) resulting in operating level losses. However, at the same time, the Company needs to give credit to its customers, build inventories and invest in capacities. Non-existent operating profits but inevitable investment needs lead to reliance on outside cash flows (equity or borrowings) to stay afloat and grow. FCF is negative in this phase i.e. the firm needs external infusions of capital to move forward.
In the Growth phase, as the Company reaches a decent size and scale, operations start becoming profitable as growth in revenues outperform the growth in costs. However, given the healthy growth prospects (driven by market and/or market share expansion), a large part of operating profits needs to be reinvested back into business. Hence growth in operating profits don’t fully translate into FCF growth – in fact FCF could even be negative during the early part of the growth phase. However, as the Company continues on its growth journey, operating profits start becoming sizeable enough to cover the working capital and capex needs resulting in FCF turning positive and starting to grow exponentially.
The revenues and profits of the Company hit the peak in the Maturity phase. So does the quantum of FCF as reinvestment needs ebb off due to plateauing growth. The peak in FCF usually supersedes the peak in operating profits.
As growth opportunities dwindle, competition intensifies and/or redundancy in products sets in, the Company enters the Decline phase. Revenues & operating profits start on a descending journey followed eventually by the cash flows.
The fair value (or intrinsic value) of a company is the net present value of all its expected future FCF over its life cycle. The future FCF that the Company generates over its lifecycle are in turn dependent on the length of the FCF curve (i.e. the longevity of the cash flows) and the slope of the FCF curve (i.e. the growth in cash flows).
The longer a Company stays in the zone of high FCF growth, the higher the intrinsic value generated by that Company (as such companies have much longer as well as higher FCF generation).
As we’d discussed earlier, FCF generated by a firm can either be returned back to shareholders or redeployed back into the business for future growth. Firms that choose the latter path (i.e. reinvestments of FCF back into business) are able to extend the sweet spot period of exponential FCF growth and make for much better investment candidates.
Case study: Colgate vs. Astral
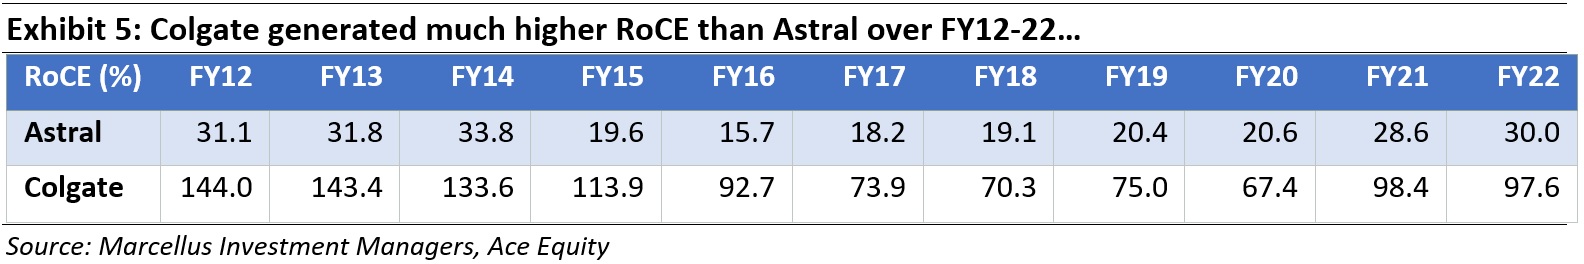
Let’s exemplify this idea using two dominant and successful businesses – Colgate and Astral. As can be seen in the table below, both these firms generate healthy RoCE – in fact Colgate’s RoCE has been much higher than that of Astral over the ten year period till FY22 (last available full financial year results)
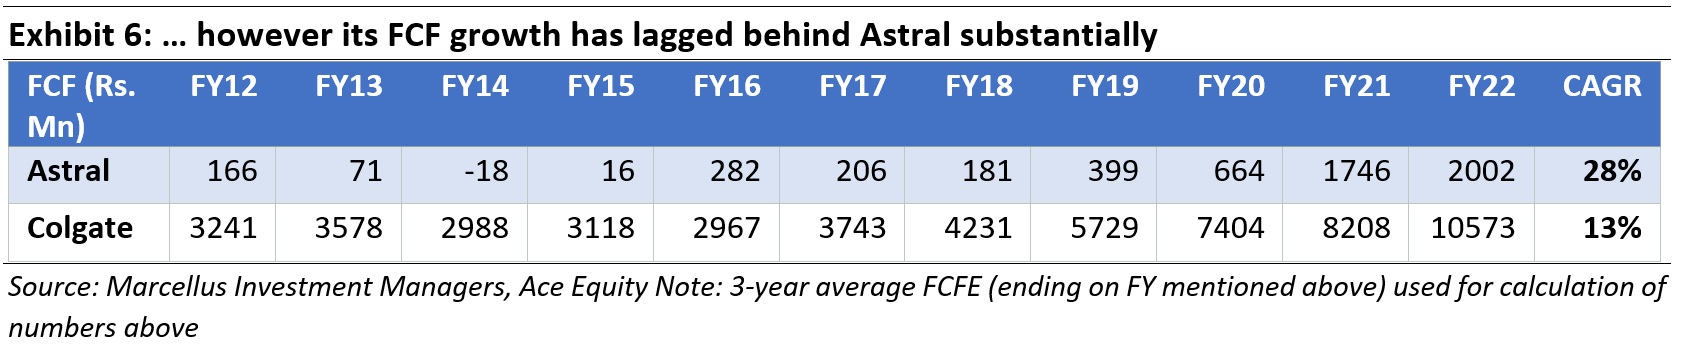
However, the FCF growth for both these firms over this same period shows a completely different picture:
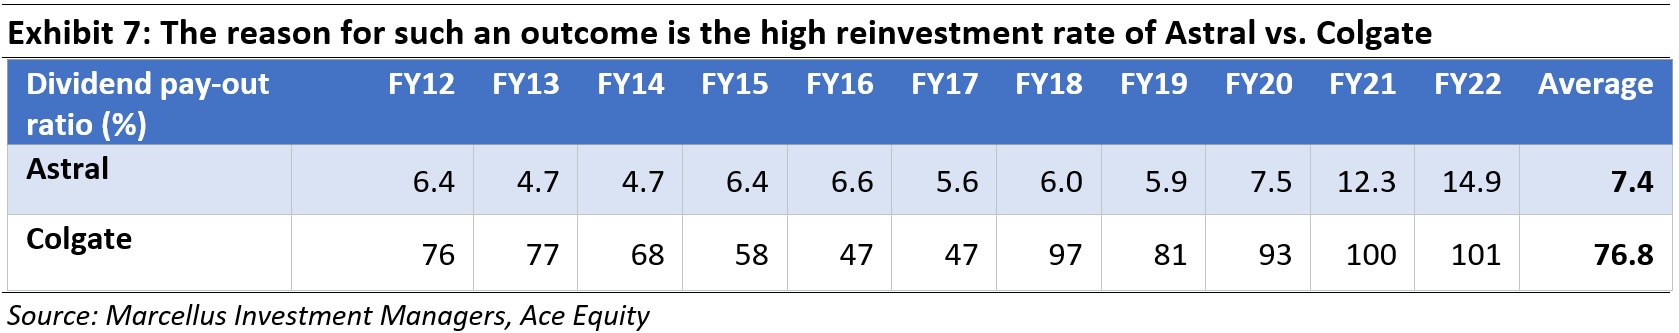
The reason is related to the differential in capital reinvestment rates for these companies. As can be seen in the table below, while Colgate chose to return most its profits to shareholders in the form of dividends (average dividend pay-out ratio of ~77% over FY12-22), Astral reinvested most of its profits back into business (average dividend pay-out ratio of 7.4% over FY12-22).
The stock price followed suit over this period (Mar’12-Mar’22) with Astral generating total return CAGR of ~56% vs. just ~13% CAGR for Colgate. Thus, while it is a highly desirable quality that a firm generates high RoCE and FCF year after year, it is not enough on its own to make a great wealth compounder. For wealth compounding, profits of the firm need to be ploughed back into the business to keep growing its FCF in future years.
The underappreciated aspect of improving capital efficiency and higher growth of FCF vs. earnings
So far we’ve discussed how
- firms that are able to use their capital efficiently vis-à-vis their peers end up generating much higher free cash flows.
- Firms that reinvest these FCFs back into business embark on a high growth trajectory- which is reflected in their FCF and share price compounding.
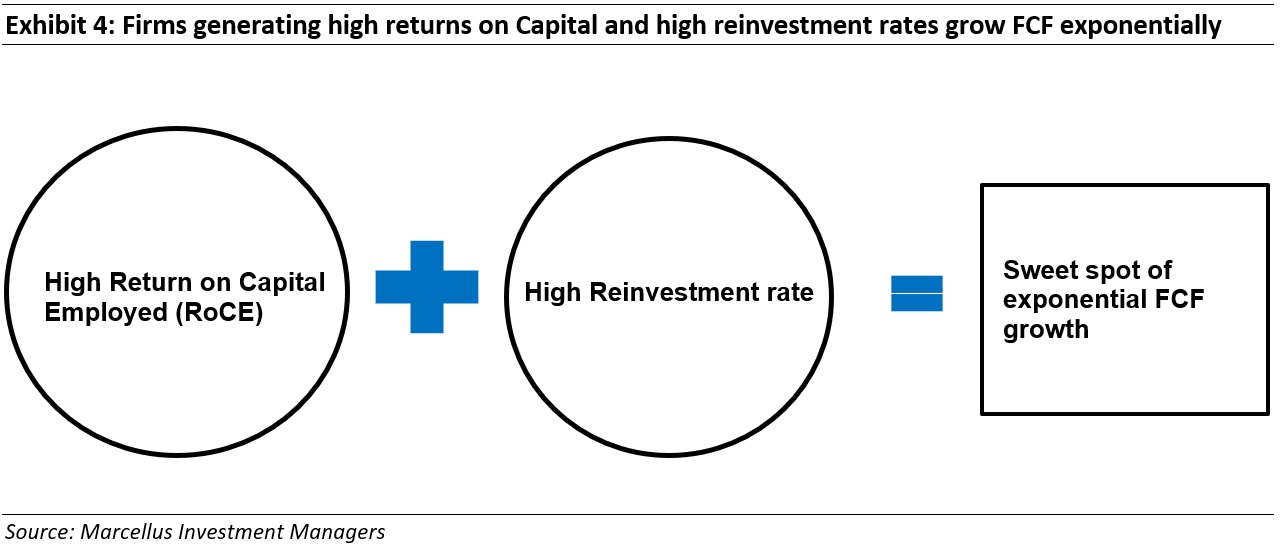
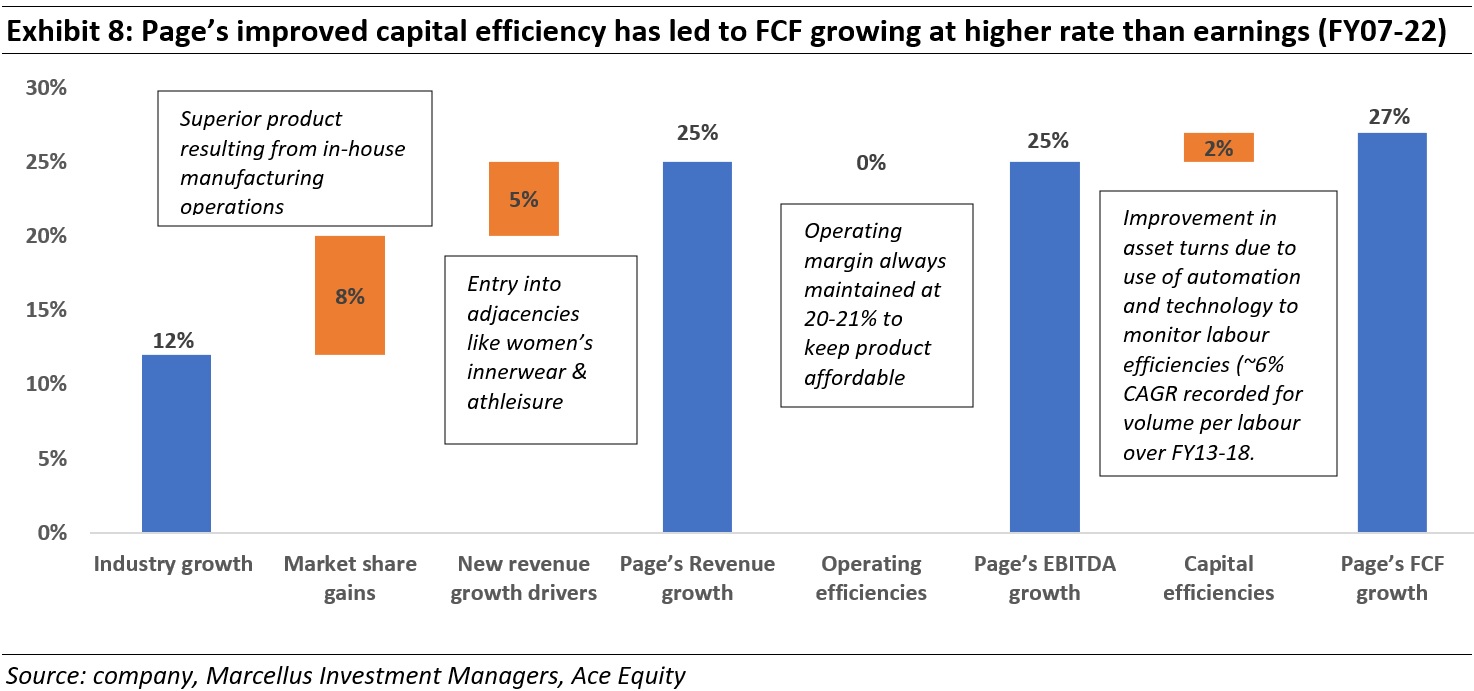
Truly special firms are able to take this idea up a notch further – by improving upon their own capital efficiency, with the end result being that FCF for such firms grows at a rate higher than earnings.
Capital efficiency can be improved by sweating the assets harder to generate higher sales (higher asset turnover) and/or improving working capital management – by reducing inventory/receivable days or increasing payable days (freeing up capital otherwise locked up for meeting short term obligations).
Most Marcellus portfolio companies have been a beneficiary of such improvement in capital efficiency as evidenced by the higher growth in FCF vis-à-vis earnings. Consider the example of Page Industries – core holding across many of our portfolios. We discussed the steps taken to increase FCF growth rate in detail for our portfolio companies in Nov’21 newsletter.
Investment Implications
- The Marcellus investment universe primarily consists of companies which can generate healthy FCF by running their operations more efficiently vis-à-vis their peers. The best candidates amongst these are the companies which are at the ‘sweet spot’ of exponential FCF compounding within their lifecycle- implying they can grow FCF and their intrinsic value for several years (if not decades) to come.
- The valuation methodology followed at Marcellus is driven by Discounted Cash Flow (DCF) method i.e. discounting the future FCF and determining the fair or intrinsic value of a business. This is the value that determines the degree of under/overvaluation vis-à-vis the stock market quote.
- FCF CAGR for most companies in Marcellus Portfolios grow at a rate faster than earnings. For such companies the P/E multiples have no bearing on their future compounding potential. See our Oct’22 newsletter for more details on this subject.
- Over the last 18 months, most companies in the Marcellus portfolios have continued to compound their fundamentals (Profits and FCF) at a healthy rate of 20%+, while the share prices have lagged behind the fundamentals by 30-40%. This lagging of share prices (behind fundamentals) is an opportunity for us and for our clients.

