Overview
Marcellus’ Global Compounders Portfolio (GCP) invests in 20-30 deeply moated global companies based on rigorous bottom-up research around moats, capital allocation and sustainability of cash generation into the long-term future.
GCP companies have track record of consistent free cash flow compounding driven (a) the nature of products and services – ‘pick and shovel’ to the global economic megatrends, utilities and consumption; and (b) moats built around process capability, R&D and capital allocation.
GCP companies have historically grown their free cashflows per share at about 20% (USD) annually over last decade. With average age of the portfolio companies being more than 6 decades, with more than 20 years of greatness and dominance in their present lines of businesses, GCP companies display the characteristics of exceptional resilience while delivering compelling growth.
Portfolio Construction
GCP portfolio of 20-30 companies is selected from large and mid-cap stocks listed in the US and developed European markets. The portfolio construction involves 2-stage process:
- A filter-based approach using Marcellus’ forensic framework and fundamental accounting to identify investable universe of 80-85 companies.
- In-depth Bottom-up research and independent third-party checks of the companies to access sustainable competitive advantages, capital allocation and cash generation ability narrowing down to 20-30 global compounders.
Rebalancing Framework
For each GCP company a composite score (Business Score) is calculated. Marcellus’s uses combination of business score, proprietary style framework (Torque) and valuation framework to determine the final weight allocation to the selected companies.
Reinvestment and return framework
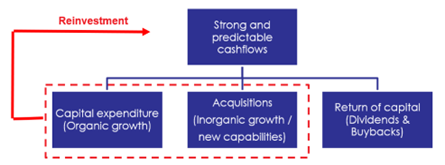
GCP portfolio companies have high cash generation ability which allows them to invest in organic and inorganic growth opportunities and return excess capital to shareholders through dividends and buybacks.
The high ROCE of GCP companies enables them to grow faster organically with lower reinvestment. This allows GCP companies to have excess capital which can be used for acquisitions and for the return of capital.

Performance
Performance as on 30th April 2025 (figures in %)

Marcellus performance data is shown gross of taxes and net of fees and expenses charged until the end of last month. Performance fees are charged annually in December. Returns for periods longer than one year are annualized. Marcellus’ GCP USD returns are converted into INR using exchange rate published by RBI. Source: https://www.rbi.org.in/scripts/ReferenceRateArchive.aspx
‘Since Inception’ performance calculated from 31st Oct 2022. The inception date is 31st October 2022, being the next business day after the account got funded on 28th October 2022. S&P 500 net total return is calculated by considering both capital appreciation and dividend payouts.
The calculation or presentation of performance results in this publication has NOT been approved or reviewed by the IFSCA or SEC. Performance is the combined performance of RI and NRI strategies.
Head of Global Equities

Arindam Mandal
MBA Finance - Duke University, Portfolio Manager
Bachelor of Technology - NIT Warangal

Interested to know more?
Talk to an advisorPRODUCT PRESENTATION
Invest with Marcellus’ Global Compounders
Get in Touch


