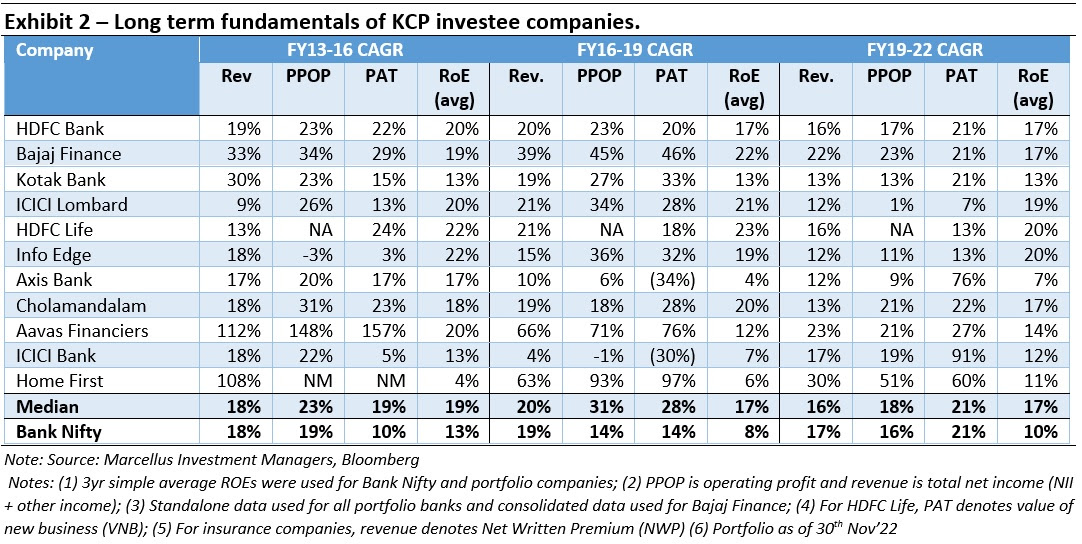
The Return on Equity (RoE) of lenders is driven by: (i) strong operating profitability (Return on Assets); or (ii) capital structure (high debt to equity). Recent euphoria in share prices notwithstanding, most PSU banks suffer from weak operational profitability (RoAs of 1% or lower) and high debt to equity ratios (15x+). This deadly combination is usually unsustainable as seen during the GFC, when Lehman Brothers (which had only Rs. 3.5 of equity for every Rs. 100 of assets) went bust. In this newsletter we discuss the role of capital structure in creating resilience and optionality for high quality lenders. Additionally, we also discuss how high-quality lenders in KCP have utilized increasing operating leverage to maintain or improve their profitability – for instance HDFC Bank has grown its loan book at 20% CAGR while its employees and branches have grown at a ~10% CAGR over the past decade. High quality lenders pass on the benefits of this operating leverage to their borrowers, thus increasing their access to better quality borrowers while maintaining RoAs and remaining competitive vs. peers. With the proliferation of UPI and the account aggregator framework, we believe high quality lenders will be able to extract further operating efficiencies at an accelerated pace, pass this benefit to borrowers and gain further market share.
Performance update of the live fund
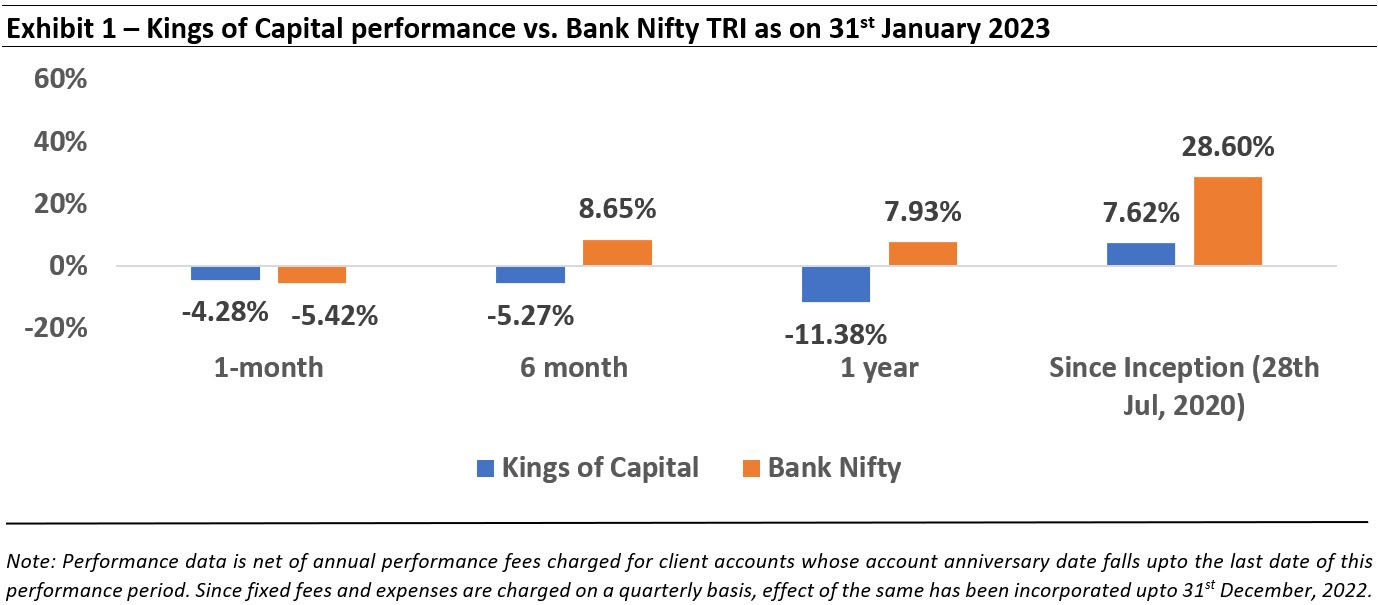
The key objective of our “Kings of Capital” strategy is to own a portfolio of 10 to 14 quality financial companies (banks, NBFCs, life insurers, general insurers, asset managers, brokers) that have good corporate governance, prudent capital allocation skills and high barriers to entry. By owning these quality financial companies, we intend to benefit from the consolidation in the lending sector and the financialization of household savings over the next decade. The latest performance of our PMS is shown in the chart below.
Strong operational profitability (measured by return on assets) creates resilience & optionality for lenders
For lenders, ‘Return on Equity’ (RoE) is an outcome of the interplay of two forces at any given point in time: (i) the core operational performance of the lender; and (ii) the capital structure of the lender.

The core operational performance of the business can be measured by ‘Return on Assets’ or RoA (akin to Return on Capital Employed or RoCE for non-financial companies) which showcases how well a lender is able to harness its business machinery and sweat its assets in order to generate adequate yield. The capital structure is how any business/lender ‘juices up’ the returns by borrowing against the equity. This is also known as ‘leverage’.
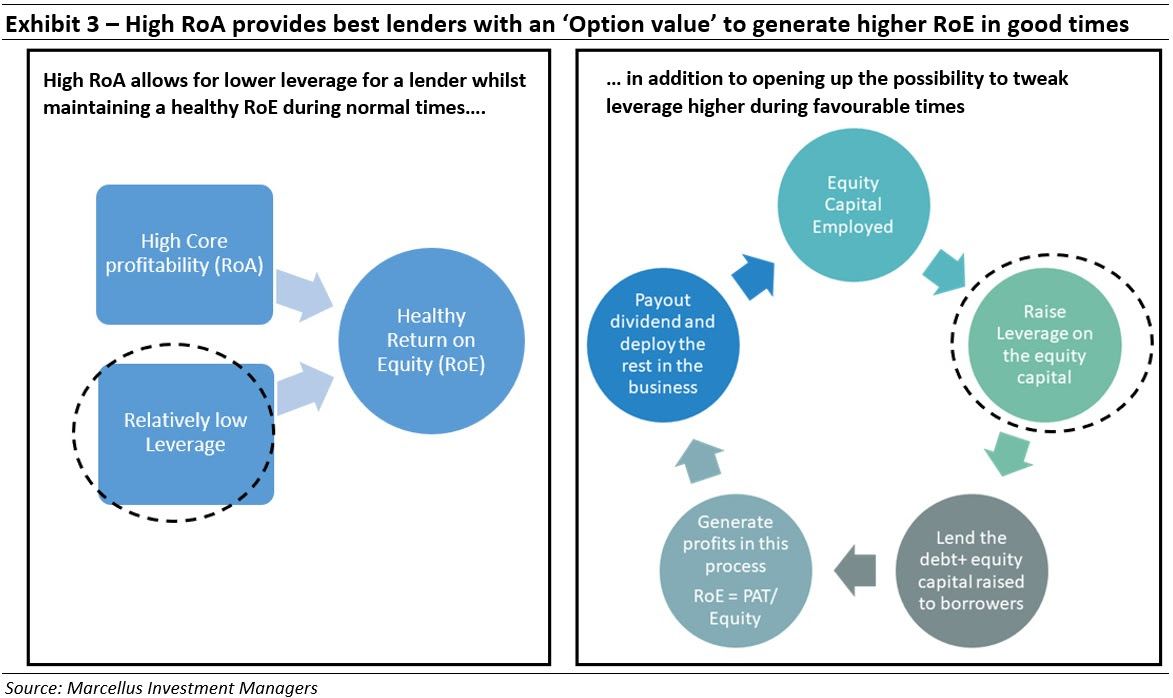
As has been seen repeatedly over the last couple of decades, deploying financial leverage cuts both ways – in good times it can lead to high RoE for the shareholders but during tough times, it can lead to a lender going bankrupt and the equity getting completely wiped out! The best lenders thus focus on improving their core profitability or RoA on a sustainable basis rather than using leverage as a tool to supercharge RoE in the short run.
Doing this allows the best of lenders to ward off the dangers of high leverage during tough times whilst providing them the ‘Option value’ of capitalizing on good times by tweaking leverage higher opportunistically.
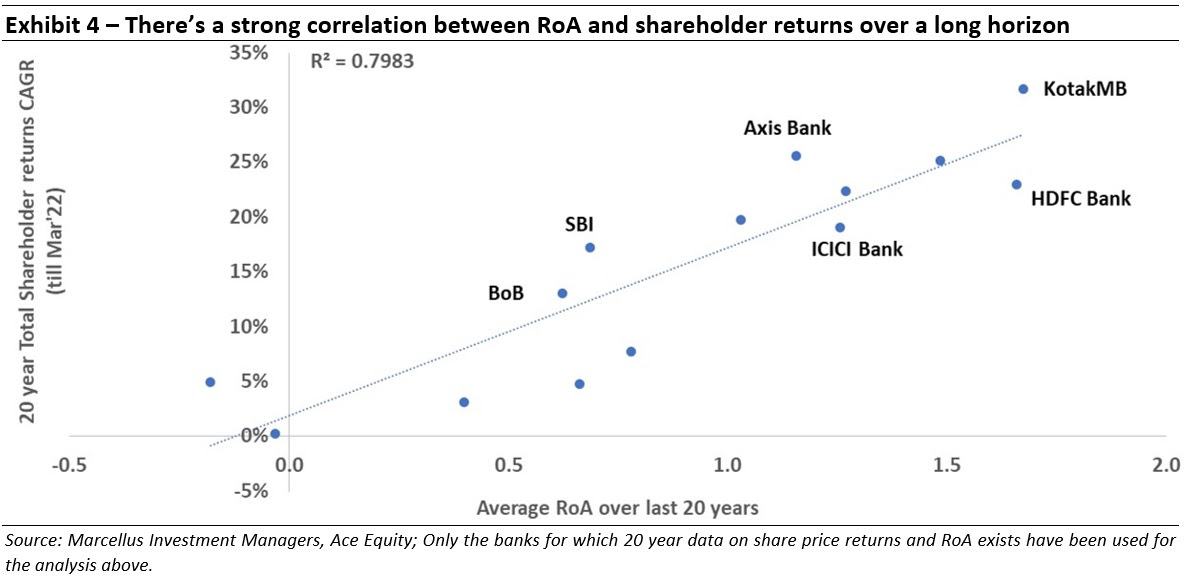
In fact, if one was to look at the shareholder returns over a long-term horizon (last 20 years), the correlation between RoA and Equity returns seems to be pretty clear. In other words, lenders which are able to maintain (or even increase) their core profitability are the ones which generate the maximum shareholder returns.
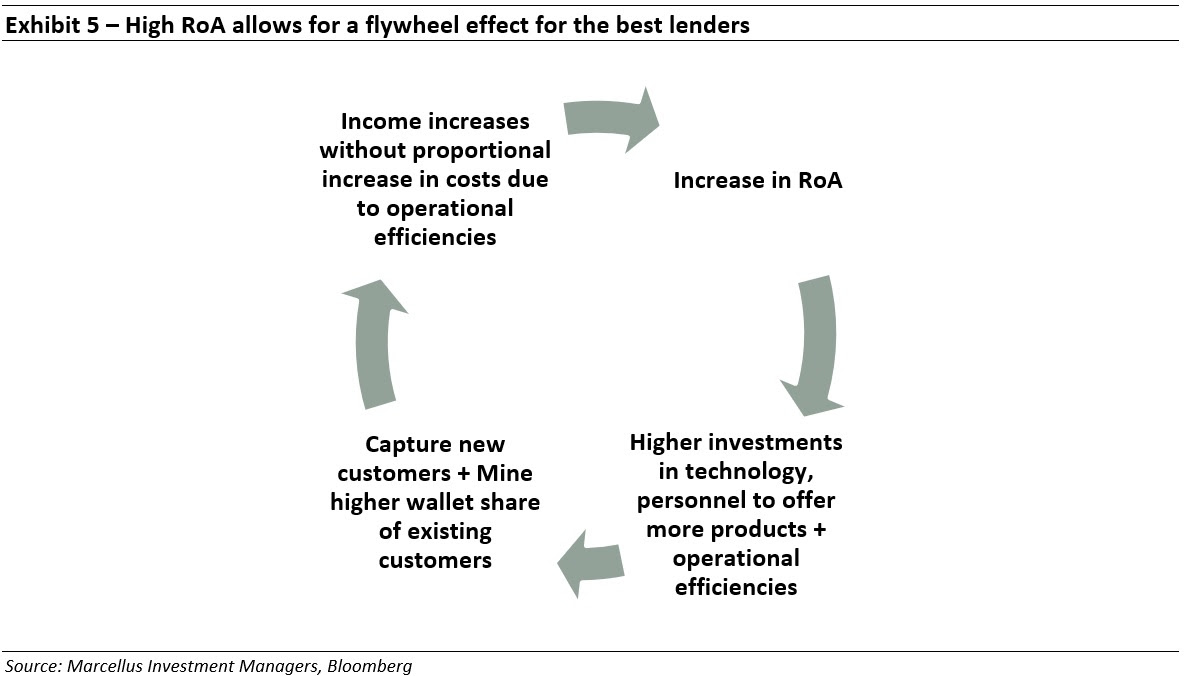
Why do lenders with the best ROAs generate the highest shareholder returns?
The key reason behind this is the flywheel effect that emanates from having a high RoA. High core profitability allows the lender to keep investing ever larger amounts in technology/personnel in order to generate even greater operational efficiencies, increased distribution, better quality products and more differentiated services. This in turn leads to a growing customer base and income whilst avoiding a proportional increase in costs. This in turn leads to higher RoAs and so on.
As a result, the lenders scoring highest on RoA are not only able to ride through various financial crises relatively unscathed (as their leverage is relatively low), they’re also able to keep widening the gap vs. their peers year after year. This gap ultimately shows up in the form of difference in shareholder returns.
In the next section, we present an overview of the key lenders in KCP and how they’ve been able to increase their core profitability over the last decade.
HDFC Bank – generating increasing operational efficiencies with scale
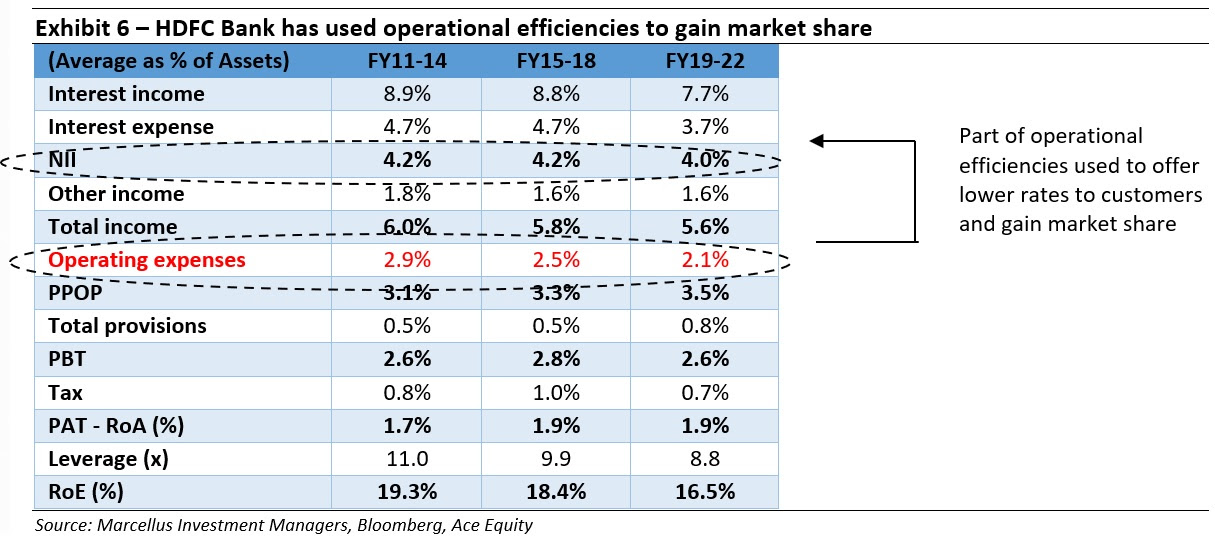
As can be seen in the table below, HDFC bank has consistently strived to lower its operational expenses as a percentage of its assets and has been successful in doing so over the last decade or so. The Opex to Assets ratio has gone down from average of 2.9% during FY11-14 to 2.1% over FY19-22. The benefits of this reduction in operational costs have been used to offer lower rates to customers (and gain market share from peers)
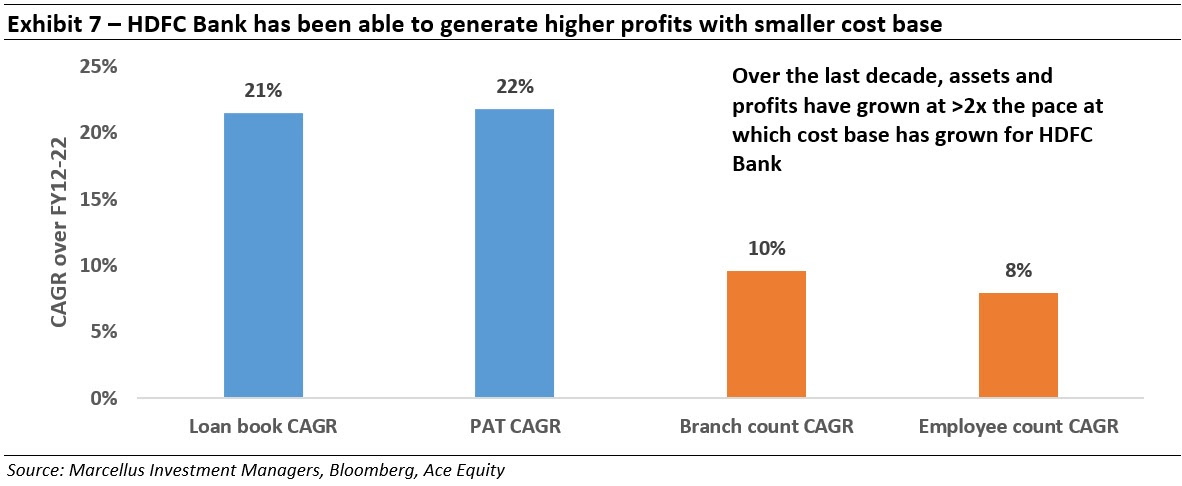
Going a notch deeper into how HDFC Bank was able to achieve this feat, one can see that it’s a result of higher employee and branch productivity over the years. The exhibit below clearly showcases how the employee and branch count has grown at a much smaller pace vis-à-vis the loan book and PAT over the last decade (FY12-22).
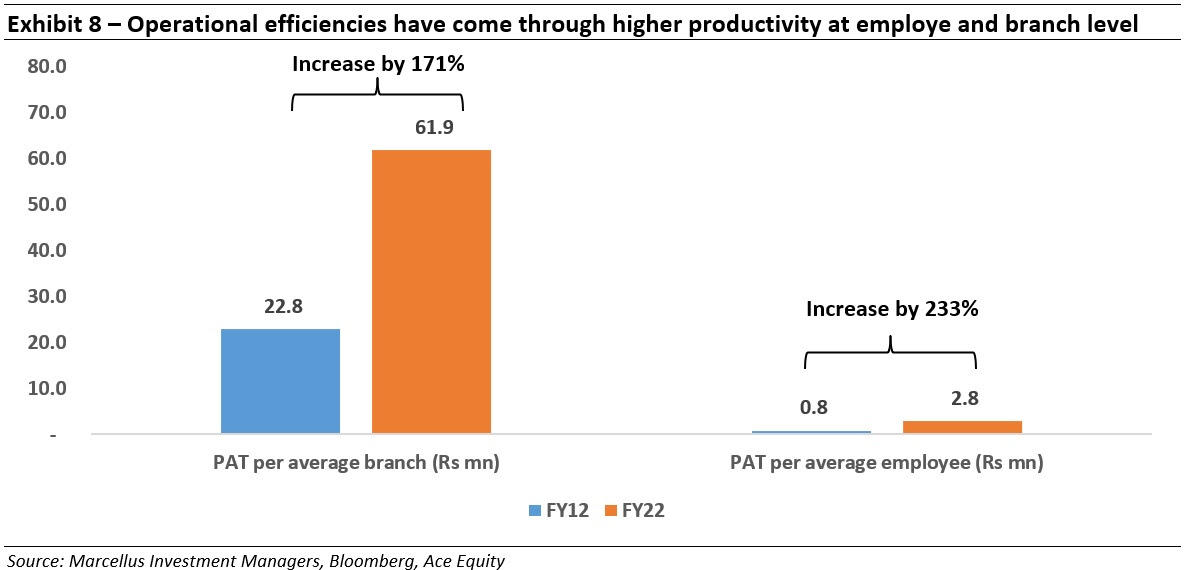
Putting numbers to the productivity gains shows a 171% jump in PAT per branch and a 233% increase in PAT per employee over the last decade. As a result, HDFC Bank has seen its cost to income ratio reduce by about 10% points over the past decade. We believe this is likely to further go down by another 10% points over the next decade on the back of the room available for further efficiencies (see next exhibit).
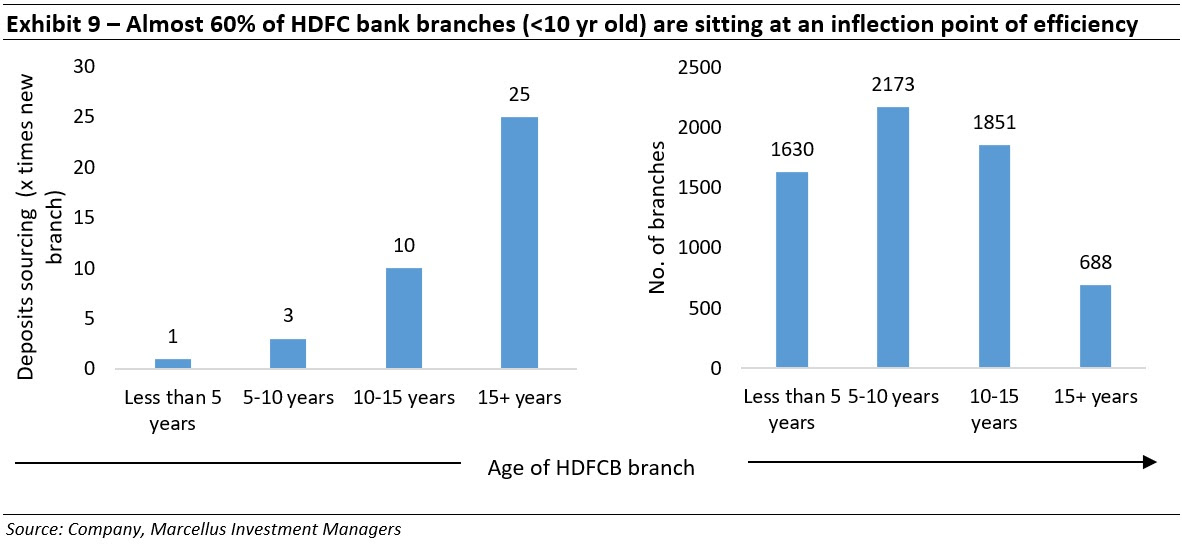
Further, given that 60% of HDFC bank’s branches are still less than 10 years old, there’s enough room available to keep garnering operational efficiencies in future years as well.
Kotak Bank – exhibiting operational excellence
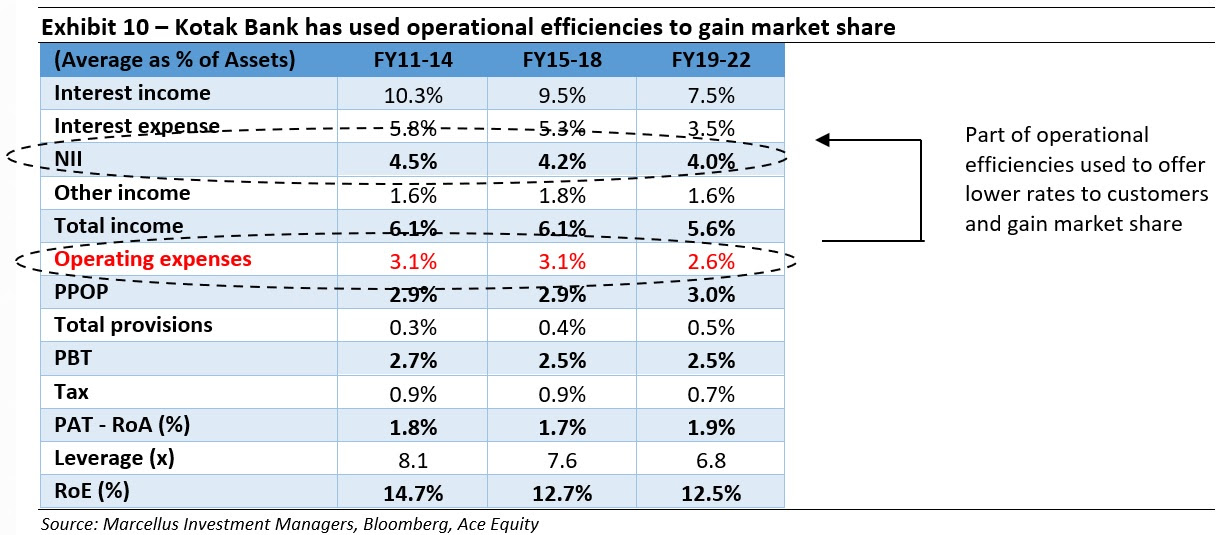
Much as seen above for HDFC Bank, the Opex to Assets ratio for Kotak Bank has gone down from average of 3.1% during FY11-14 to 2.6% over FY19-22. The benefits of this reduction in operational costs have been used to both offer lower rates to customers (and gain market share from peers)
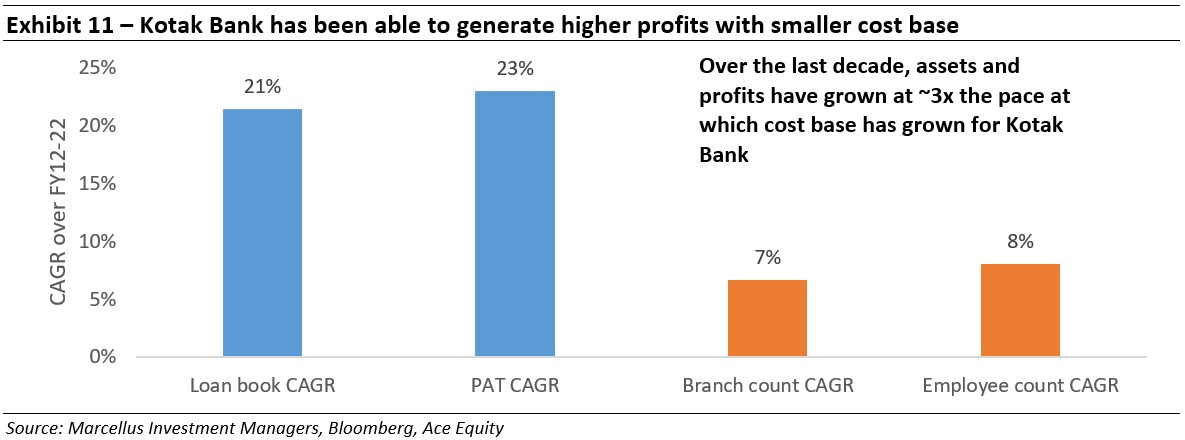
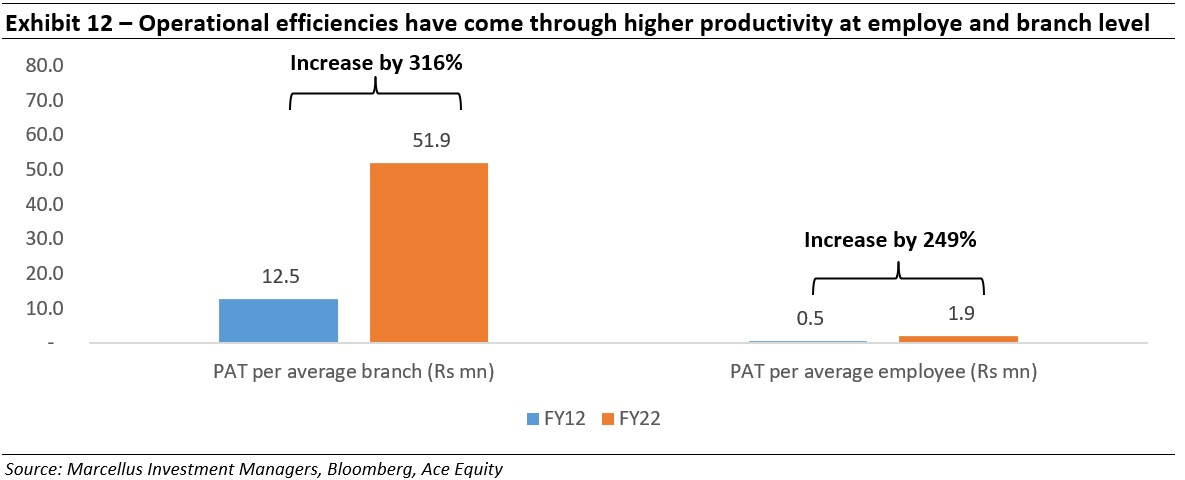
The gains in terms of employee and branch productivity in fact are better than that seen for HDFC Bank with the employee and branch count growing at one third the pace of loan book and PAT growth over FY12-22. The following exhibit shows how the PAT per branch and PAT per employee have grown by 316% and 249% respectively over last decade.
Bajaj Finance – Leveraging cross sell franchise to great effect
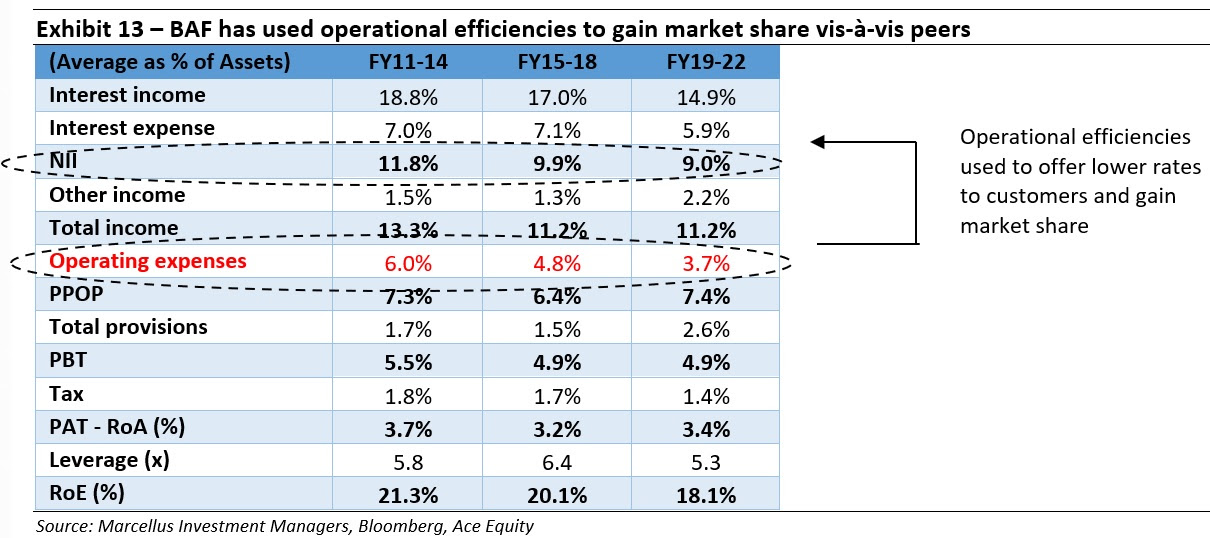
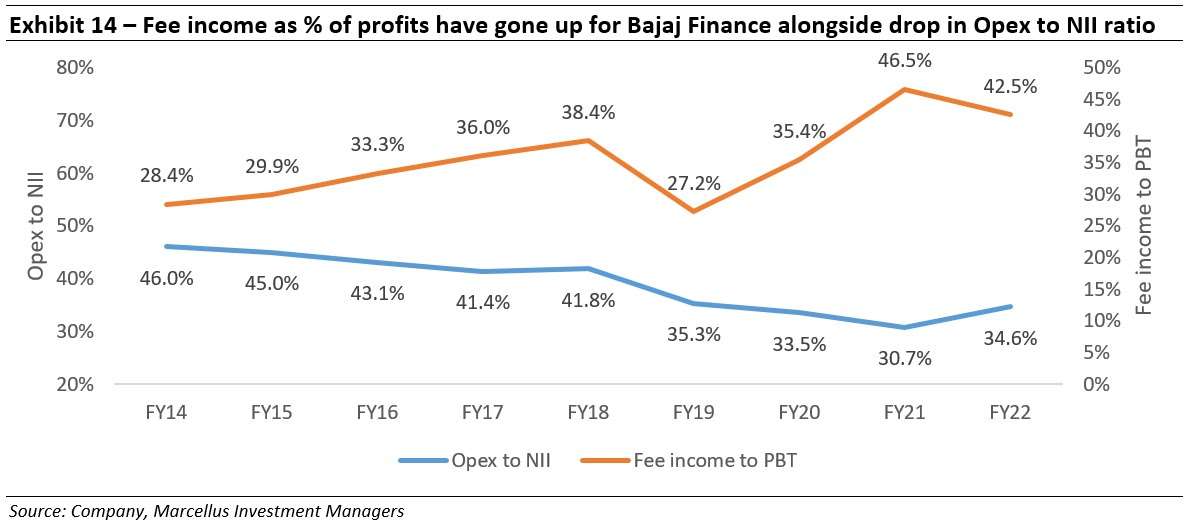
The Opex to Assets ratio for Bajaj Finance has gone down from average of 6.0% during FY11-14 to 3.7% over FY19-22. The benefits of this reduction in operational costs have been primarily used to offer lower rates to customers (and gain market share from peers)
Just like the large banks, Bajaj Finance has been able to reduce its cost to income ratio (from 45% to 35% over the past decade). However, as a relatively late entrant and with the handicap of not having a readymade customer base, Bajaj did this by creating a cross sell customer franchise which can be sold multiple products over and over again. Additionally, its performance-oriented culture has meant that 90%+ employees are on monthly/ quarterly target oriented variable pay thus linking a large part of costs directly to revenues.
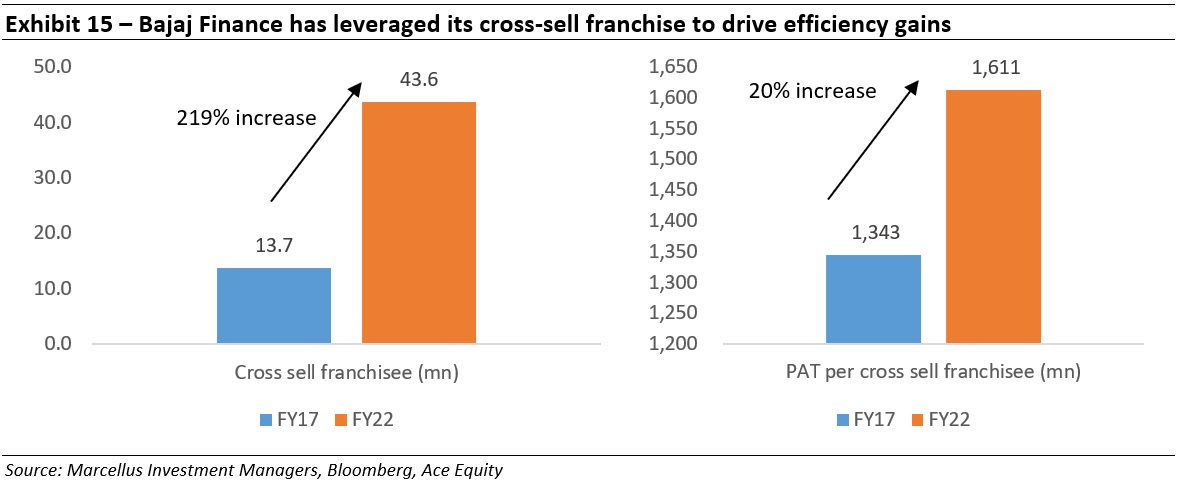
As can be seen in that exhibit, the cross-sell franchise of BAF has grown multifold in just the last 5 years from 13.7mn to 43.6mn with the productivity of the franchise itself increasing by one fifth over this period.
Cholamandalam Investment and Finance Company (CIFC)- setting a gold standard for vehicle financiers
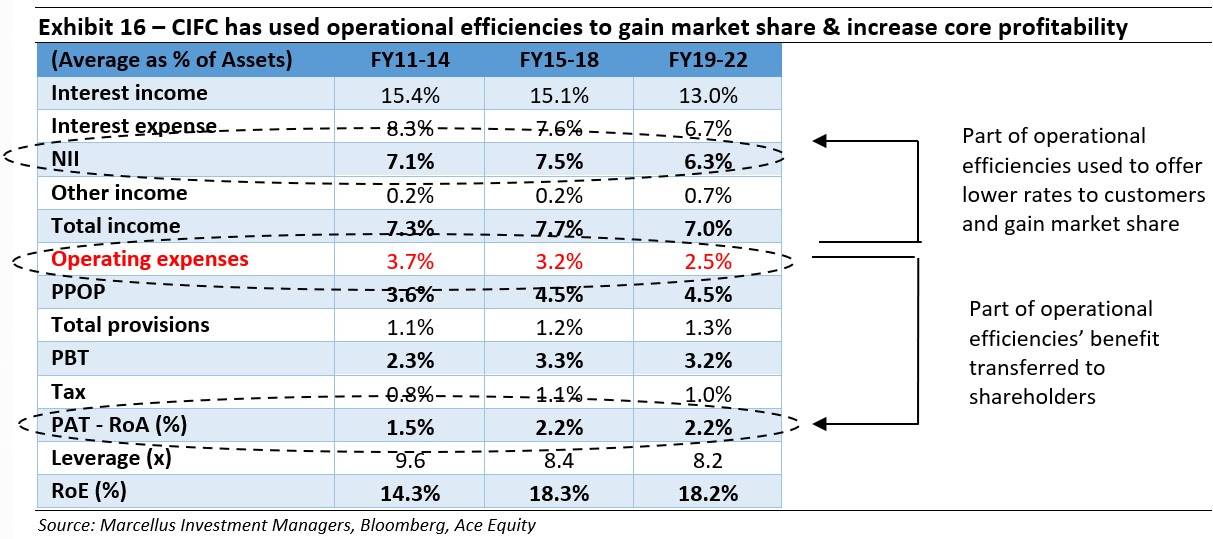
The Opex to Assets ratio for CIFC has gone down from average of 3.7% during FY11-14 to 2.5% over FY19-22. The benefits of this reduction in operational costs have been primarily used to both offer lower rates to customers (and gain market share from peers) as well as increase the yield on assets – benefiting the shareholders.
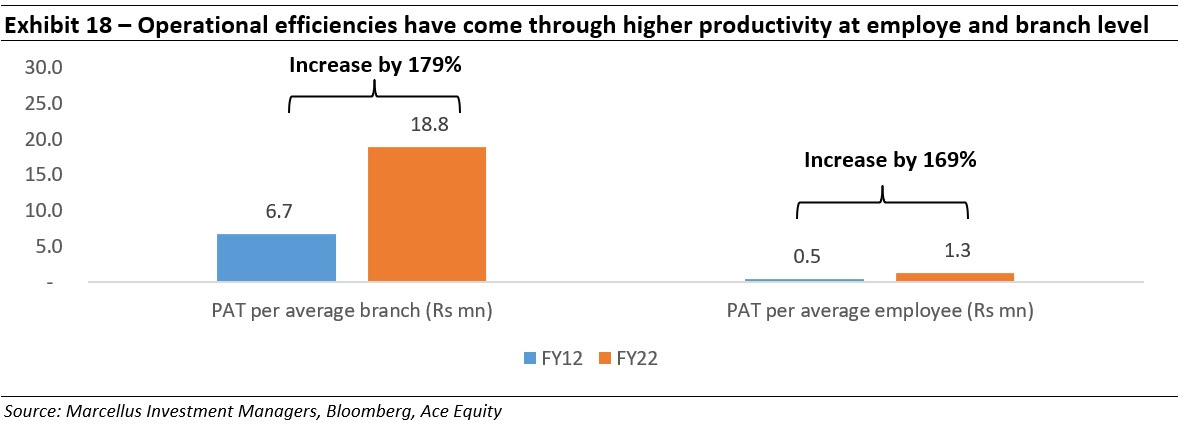
The exhibit below clearly showcases how the employee and branch count has grown at a much smaller pace vis-à-vis the loan book and PAT over the last decade (FY12-22)
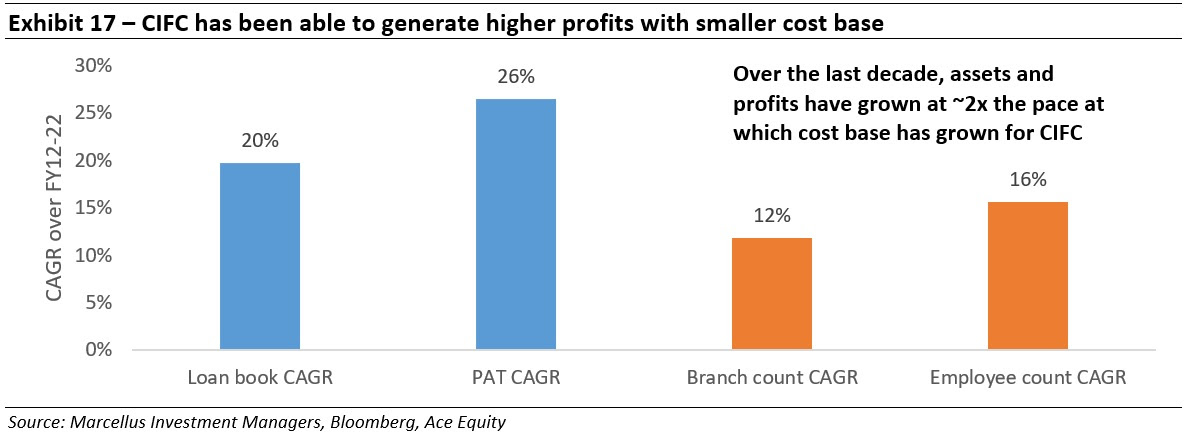
The following exhibit shows how the PAT per branch and PAT per employee have grown by 179% and 169% respectively over last decade.
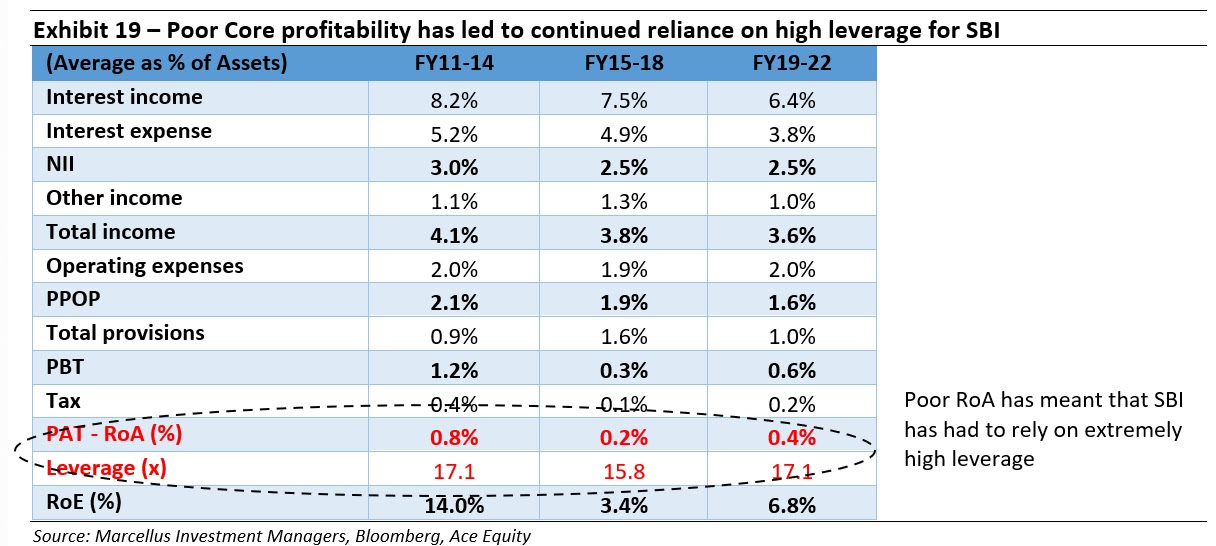
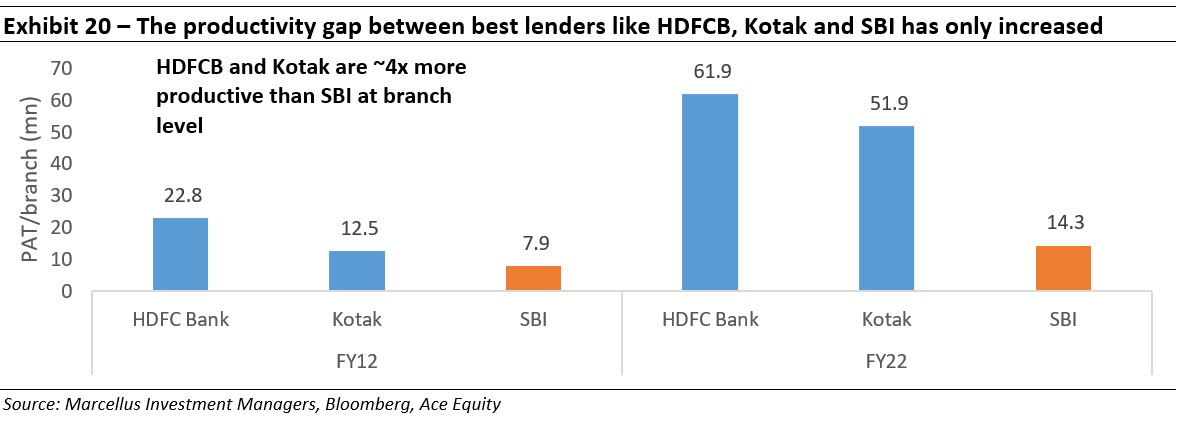
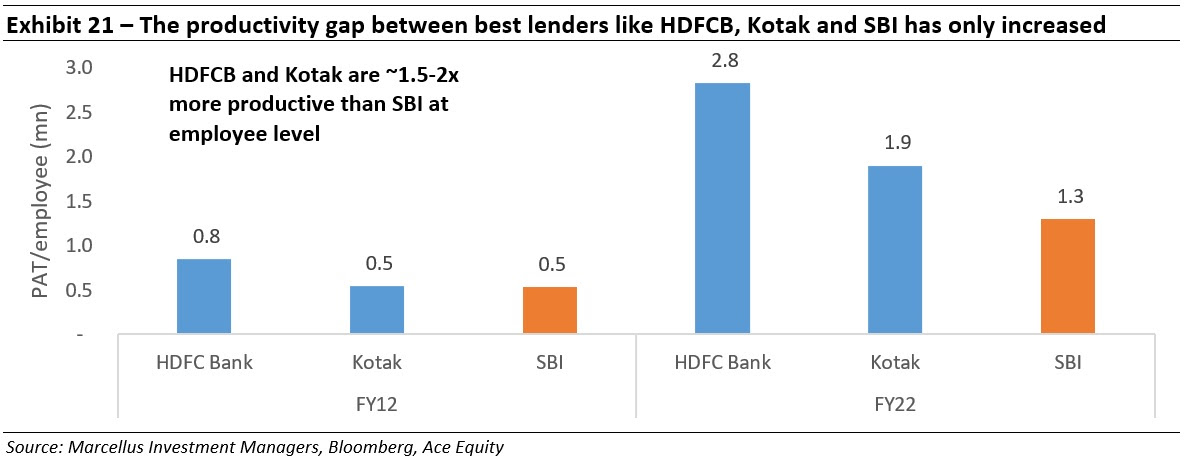
In stark contrast to these KCP lenders, the public sector banks have not been able to achieve similar levels of productivity or achieve even mediocre ROA over the past decade. The travails of the larger public sector bank- SBI, exemplify the challenges that these giant Government owned banks face.