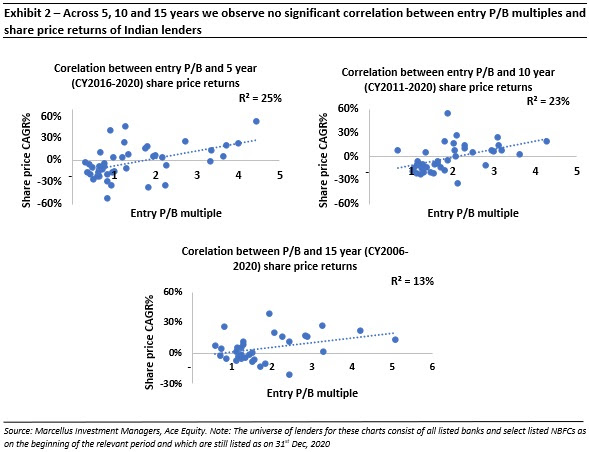
It is important for investors to understand what drives share price returns of Indian lenders so as to make the right investing decisions and focus on the right metrics. Given that there was no significant correlation between entry P/B multiples and share price returns, we calculated book value per share growth and compared it to share price returns across time horizons of 5 years, 10 years and 15 years. The key observations from this exercise were:
-
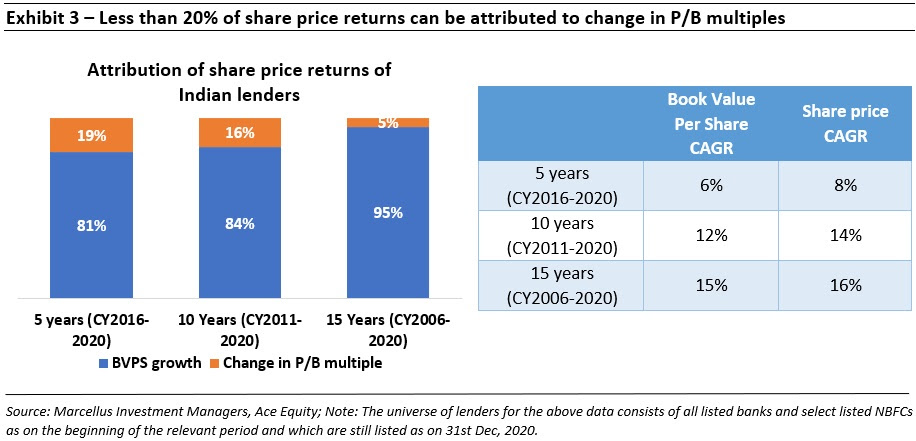
Less than 20% of share price returns are attributable to entry valuation:
As illustrated in Exhibit 3, more than 80% of share price returns are derived from book value per share growth. Investors who invest in lenders which have healthy earnings compounding should therefore not worry about the entry P/B multiples.
-
Longer the time horizon, lower the impact of entry P/B multiples on share price returns:
As illustrated in Exhibit 3, the attribution to change in P/B multiples reduces with an increase in time horizon. The reason this happens is that while book value can continue compounding at say 15% for 15 years, the P/B multiple cannot continue compounding at such a rate for long periods of time. As a result, over a 15-year time period only 5% of returns can be attributed to re-rating/ de-rating of P/B multiples with 95% of share price returns being attributable to book value per share CAGR.
-
Investors who invest in companies with weak fundamentals or shorter time horizons need to focus on entry P/B multiples:
The only way for investors to make money from lenders which do not compound book value per share is by timing their entry and exit in these stocks perfectly. However, even if investors were able to time their entry in such stocks perfectly, the share price returns would be equal to book value per share compounding over longer periods of time. This makes it essential for investors to invest in lenders which are able to consistently compound book value at a healthy rate.
Outcome of investing in lenders solely on the basis of P/B multiples
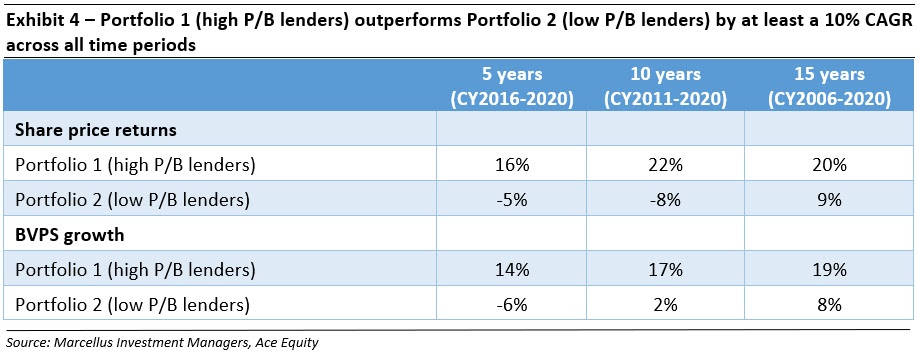
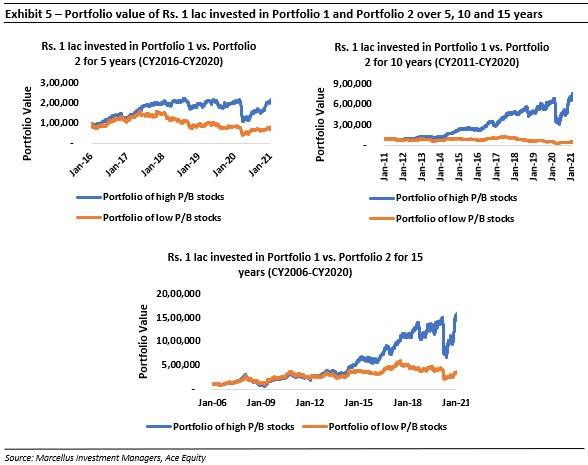
To compare returns of an investor who invests solely based on P/B multiples, we have created two hypothetical portfolios of banks and NBFCs – Portfolio 1 consists of lenders with high entry P/B multiples and Portfolio 2 consists of lenders with low P/B multiples. To create these two portfolios, we started with the universe of all listed banks and select listed NBFCs as on the beginning of the relevant period and which are still listed as on 31st Dec, 2020. We then calculated the median P/B multiple of this universe of lenders – on the inception date of the portfolio, all lenders with a P/B multiple above the median of the universe became a part of Portfolio 1 i.e. the portfolio consisting of lenders with high P/B multiples while all lenders with a P/B multiple below the universe median became a part of Portfolio 2. Portfolio 1 is therefore an equal weighted portfolio of lenders with above median entry P/B multiples and Portfolio 2 is an equal weighted portfolio of lenders with below median P/B multiples. The key observations from this exercise are:
5-year portfolio returns:
The average entry P/B multiple of Portfolio 1 on 1st Jan, 2016 was 2.0x vs. 0.7x for Portfolio 2. Portfolio 1 delivered a 16% share price CAGR vs. -5% for Portfolio 2 despite the entry P/B multiple of Portfolio 1 being about thrice that of Portfolio 2.
-
10-year portfolio returns:
The average entry P/B multiple of Portfolio 1 on 1st Jan, 2011 was 2.3x vs. 1.3x for Portfolio 2. Portfolio 1 delivered a 22% share price CAGR vs. -8% for Portfolio 2 despite the entry P/B multiple of Portfolio 1 being more than twice that of Portfolio 2.
15-year portfolio returns:
The median entry P/B multiple of Portfolio 1 in 2006 was 2.3x vs. 1.1x for Portfolio 2. Portfolio 1 delivered a 20% share price CAGR vs. 9% for Portfolio 2 despite the entry P/B multiple of Portfolio 1 being more than twice that of Portfolio 2.
The reason that this happens is because as illustrated in Exhibit 4 below – the book value per share compounding of Portfolio 1 is much higher than that of Portfolio 2. Over long periods of time, the portfolio compounding gets driven by the lender which continues to consistently compound as the weights of other stocks in the portfolio gradually diminish.