OVERVIEW
POPULAR ARTICLES

In the decade running up to Covid-19, corporate profits were increasingly polarized in India i.e., the top 20 listed companies accounted for an ever-larger share of India Inc’s profit pie. However, since FY21 the picture has changed as smaller companies have begun to grow their profits faster than the top 20 listed companies. This democratization of profits in India is a good thing and owes much to: (a) the India Stack and UPI; (b) the widespread availability of affordable credit; and (c) the rise of social media as a medium via which smaller companies can reach customers. Interestingly, though the stock market seems to have overdone its enthusiasm for SmallCaps – the top 20 companies’ share of BSE 500 market cap now stands at 35%, the lowest it has been in this century.
“A truly democratic society is one in which every citizen of these million smaller Indias is included in the mainstream, able to benefit from government services and participate in the country’s development. We need to fix our country’s problems at great speed, at scale, with high quality, while providing solutions that are easy to access, independent of geography, and low-cost. Technology, the great leveller, is our only hope of meeting these goals.” – Nandan Nilekani and Viral Acharya in their book ‘Rebooting India: Realizing a Billion Aspirations’ (2015).
Introduction
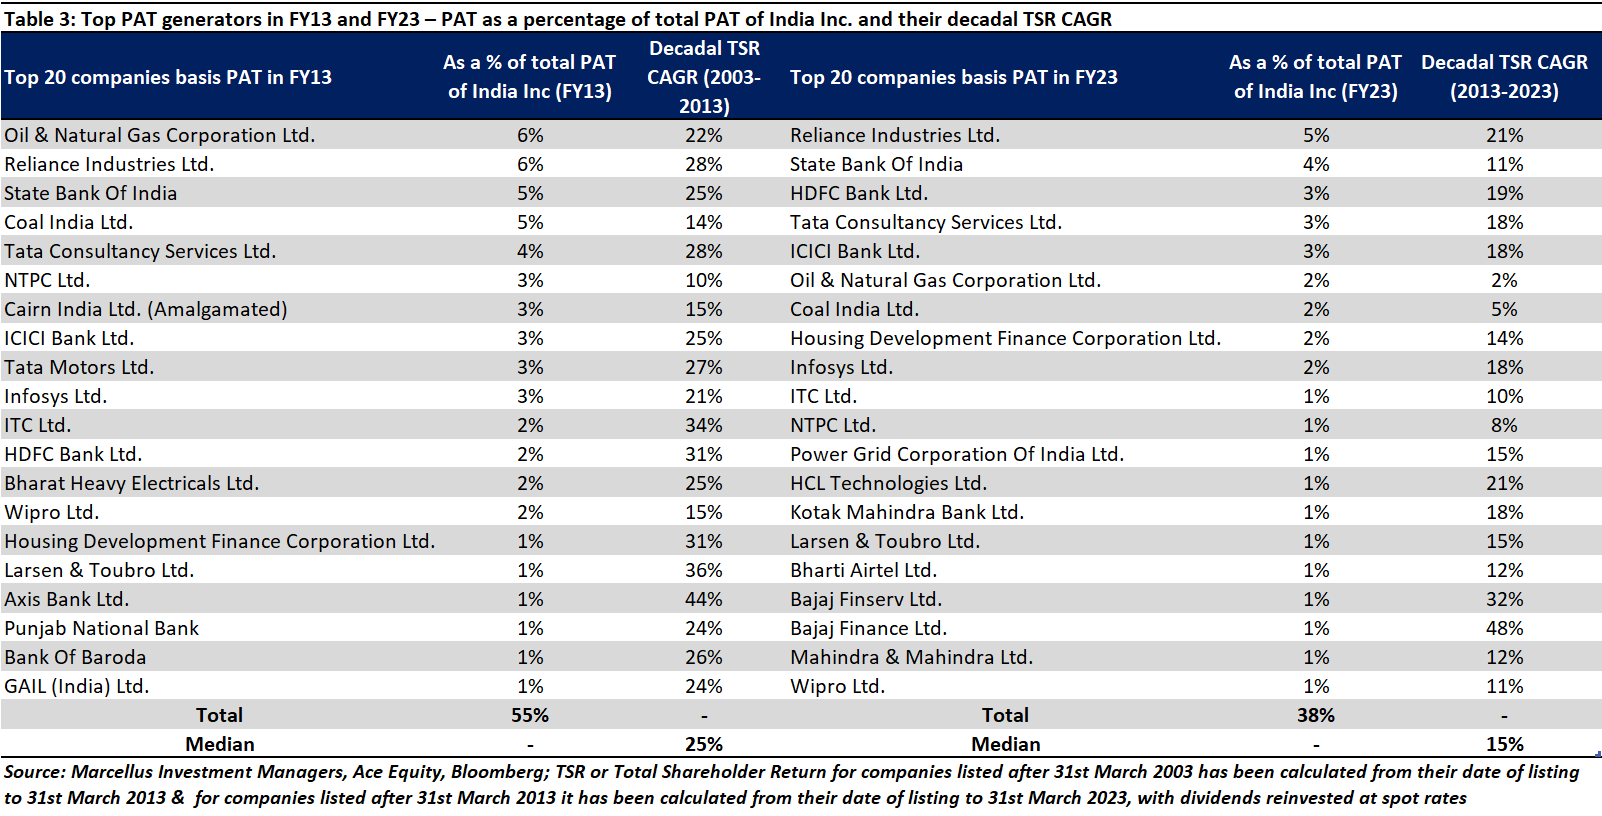
When we had first written on this subject two years ago (see https://marcellus.in/blogs/behold-the-leviathan-the-remaking-of-indian-capitalism/), we had noted that “The 20 most profitable firms in India now generate 70% of the country’s profits, up from 14% thirty years ago.” Thankfully, the data on corporate profitability which has emerged over the past two years shows a reversal in this decade long trend of ever-growing profit concentration in the hands of a handful of large, well-managed enterprises.
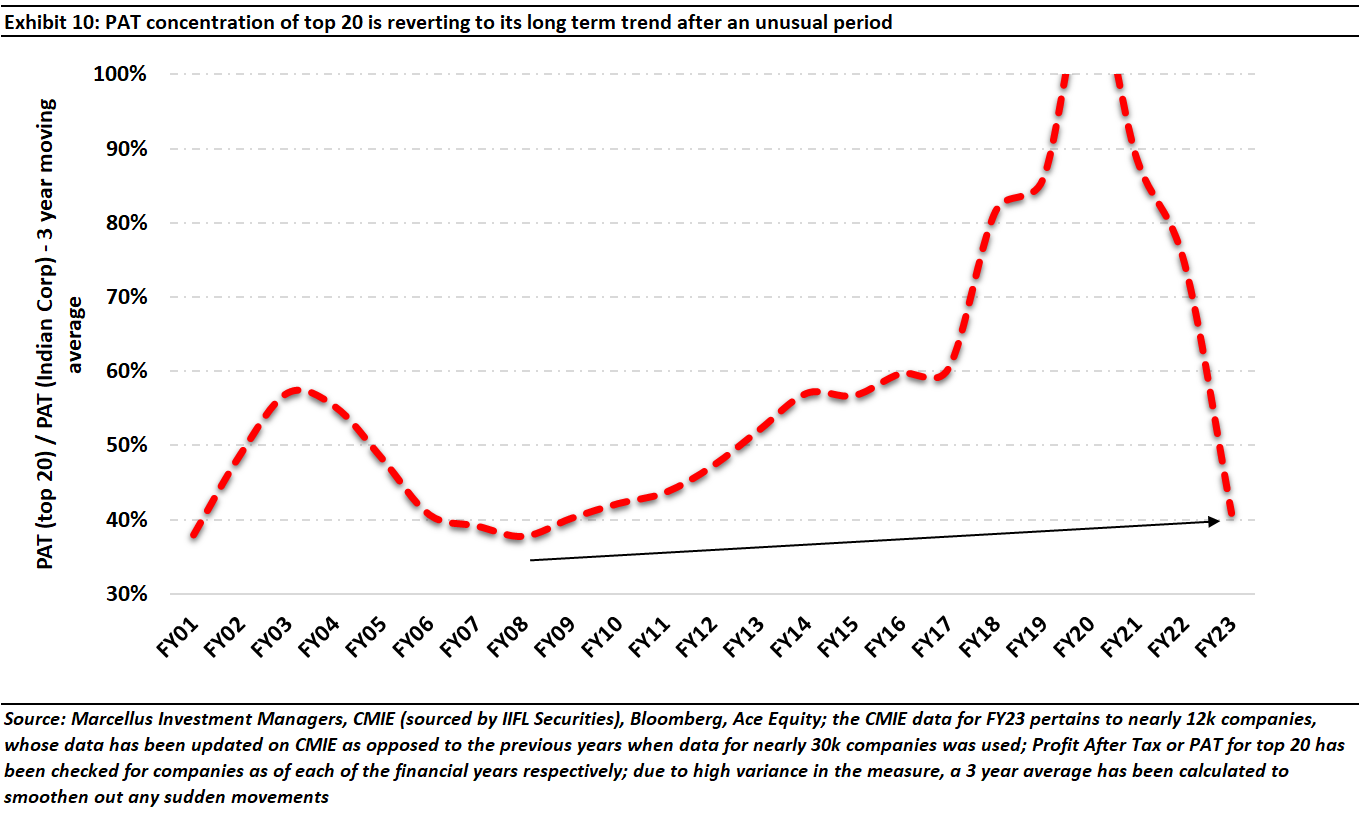
In the exhibit below, we have shown three different measures of profit concentration in India (using the three lines shown in the exhibit). For each of these lines, the numerator is identical, namely, the sum total of the profits of India’s 20 largest (by profit) listed companies. The denominator for each of the line differs.
- The denominator for the BLUE line is the Government of India’s corporate tax collection grossed up to give an approximation of the total profits of all profitable companies in India. By definition, this measure does NOT capture what’s happening to unprofitable companies in India.
- The denominator for the GREY line is the total profits of the BSE 500 listed companies. Whilst this measure includes both loss making and profitable firms, it omits the lakhs of Indian companies which are not in the BSE 500.
- The denominator for the RED, DASHED line is the total profits of the 12,000 largest companies in India (for the latest year FY23; each data point corresponds to ~30K companies in that year). We find this to be the most comprehensive measure of corporate profitability because it includes both loss making and profitable firms, large & small firms, listed & unlisted firms.
Note that for all three lines we are using a 3-year rolling average to cut out ‘noise’ contained in the year-to-year fluctuation in this metric (i.e., we calculate the ratio “top 20 PAT/ total PAT” for each year and then average the ratio across 3-years to create a rolling average).
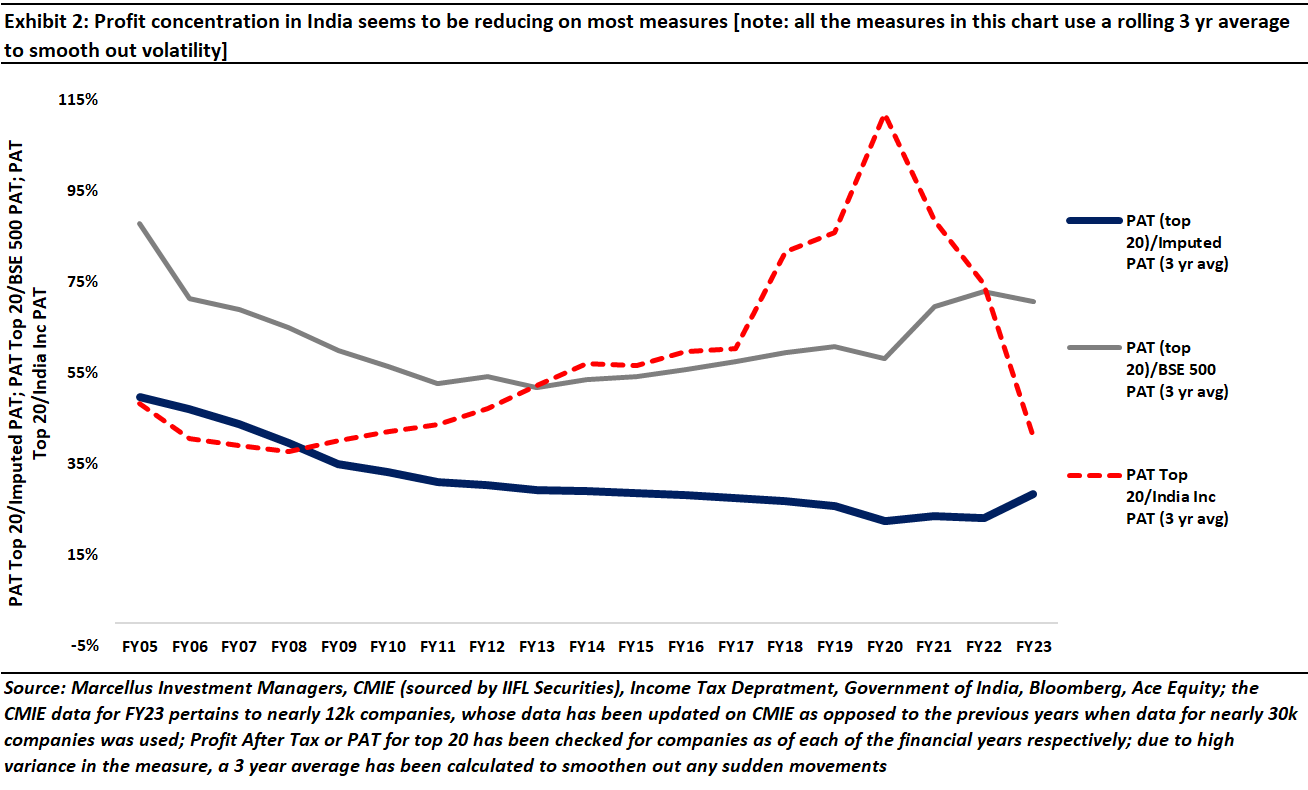
As mentioned above, we believe that the most comprehensive measure is ‘PAT top 20 / PAT India Inc’ wherein the data for the denominator is sourced from the Centre for Monitoring the Indian Economy (CMIE). For all the years barring FY23, we have used data for 30K Indian companies in the denominator. Unfortunately, for FY23, so far, the CMIE database has data only on 12K companies. [Note: in each of the two previous iterations of this blog, we have the same CMIE data that underlies the RED, DASHED line].
Since the three lines are moving in different directions, it is important to understand why we prefer to use ‘PAT top 20 / PAT India Inc’ red dashed line.
In the past we have received suggestions that we should use the PAT of the top 20 companies divided by the imputed PAT from corporate taxes. We believe that is not an accurate measure of profit concentration in India because: (a) the denominator only includes profitable companies, and (b) this line – i.e., the blue line – is moving in the wrong direction. If we compare this line with the red dotted line, we see a divergence where the prior has started lifting and the latter has witnessed a massive fall. This means that amongst the profitable companies top 20 are taking up more share now, and more importantly, companies which are beyond the BSE 500 (see grey line) all the way until the 12000th company, are becoming more profitable, leading to a rise in the denominator of the red line and therefore making it fall. This can be corroborated anecdotally as well with the reality of the post-Covid world in which VC and PE funding for smaller companies boomed and through FY22 and FY23 listed SmallCaps’ profits rose sharply.
The BSE 500 line (grey) exhibits this issue i.e., it is suggesting that profit concentration has risen post-Covid. Both the blue and grey lines are, we believe, misleading and fail to capture the extent to which profit concentration in India has reduced in the last couple of years.
Moving from PAT concentration to looking at Free Cashflow concentration
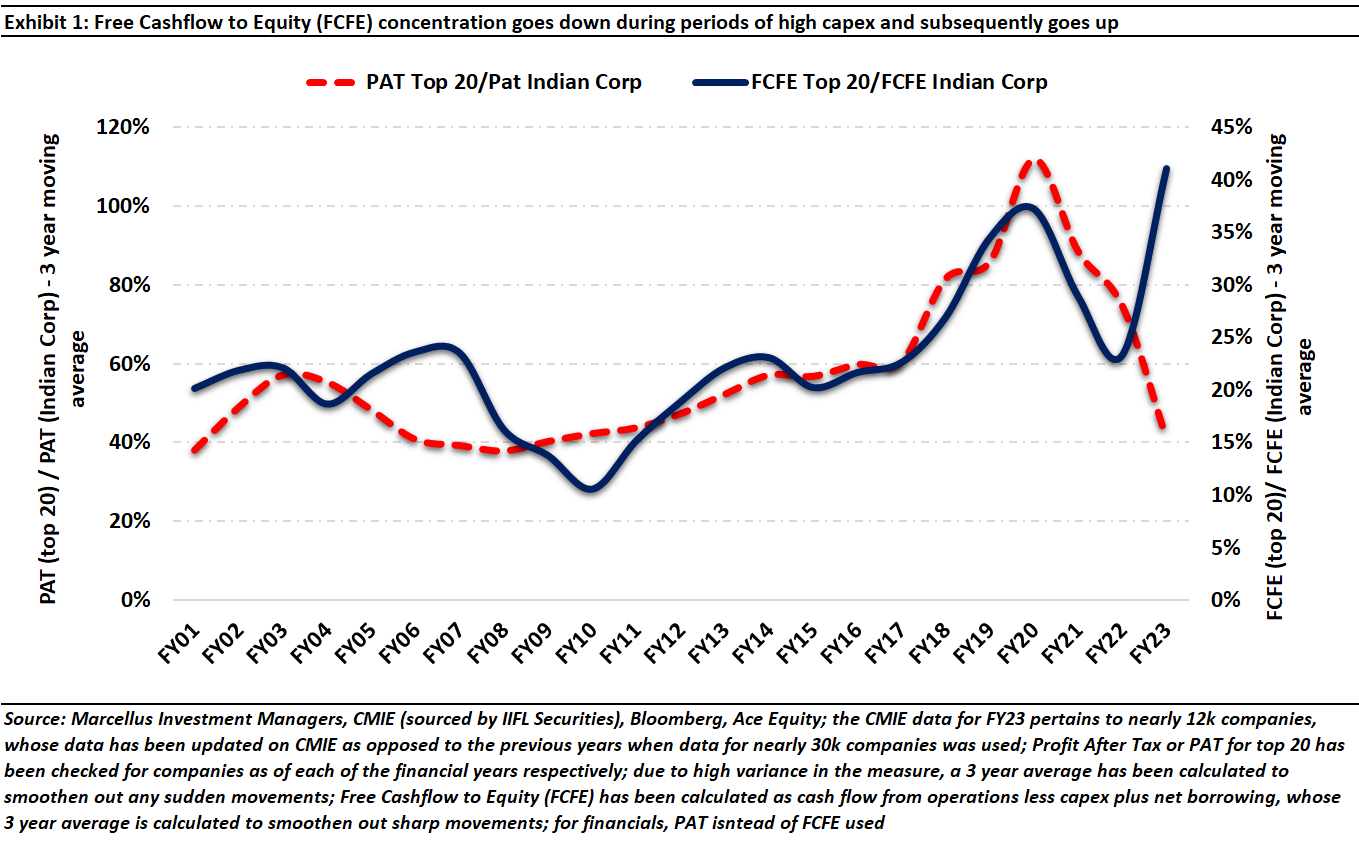
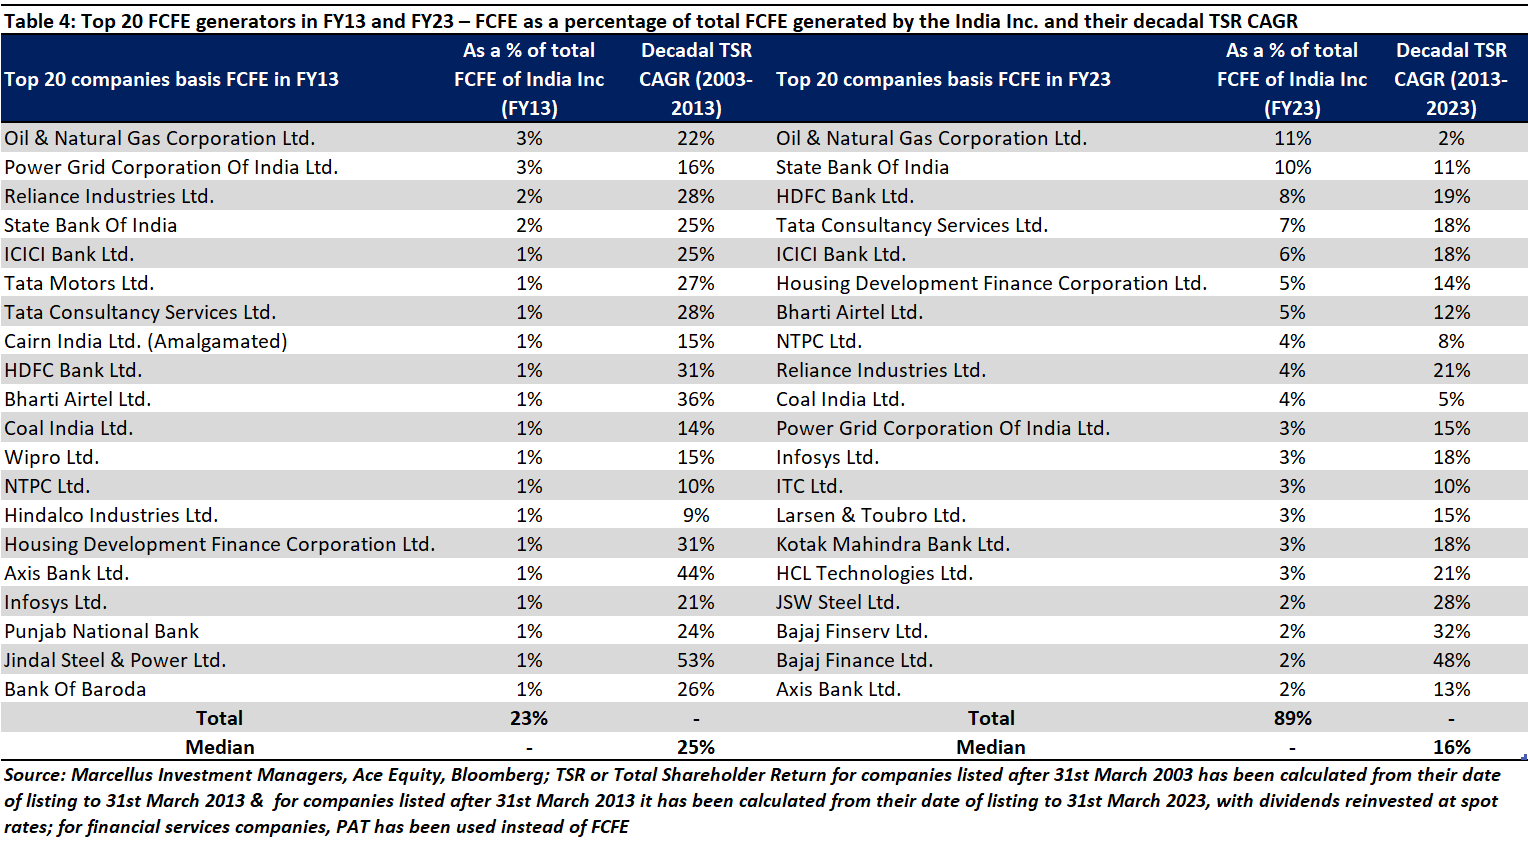
Interestingly, whilst profit concentration has reduced in the last couple of years, free cashflow concentration (as measured by Free Cashflow to Equity or FCFE) has increased in FY23 [see the first exhibit of this note]. Since most investors use FCFE, and not PAT, as the underlying metric in their valuation models, it is worth trying to understand why FCFE share is increasing for the top 20 even as their PAT share is falling. In particular, is this happening because: (a) the top 20 firms are doing less capex and thus seeing a surge in their FCFE; OR (b) the rest of India Inc, excluding the top 20, doing heavy capex which is reducing its FCFE?
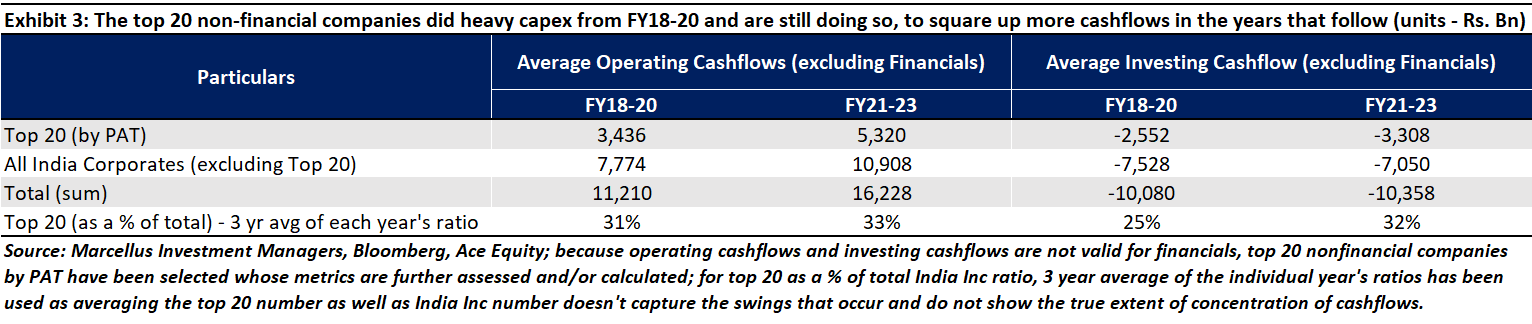
The above table shows that the operating cashflow growth for top 20 has outpaced that of rest of India in the post-Covid world. The critical driver of this is heavy capex by the top 20 firms. Whilst capex – measured by ‘investing cashflows’ here – for the top 20 has grown significantly from Rs 2.6 tn per annum in FY18-20 to Rs 3.3 tn per annum between FY18-20 and FY21-23, the same is not true for the rest of India Inc (they are flat at around the Rs. 7 tn per annum mark). In effect, the top 20’s share of the nation’s capex went up from around 25% to 32% in the post-Covid world versus the pre-Covid world.
As a result, of their heavy capex, the top 20 firms have seen a significant jump in their operating cashflows post-Covid. In exhibit 3, operating cashflow for top 20 companies has risen from Rs. 3.4 tn per annum to Rs. 5.3 tn per annum (a 55% jump) whereas that for rest of India Inc has gone up from Rs. 7.7 tn to Rs. 11 tn (a 40% jump).
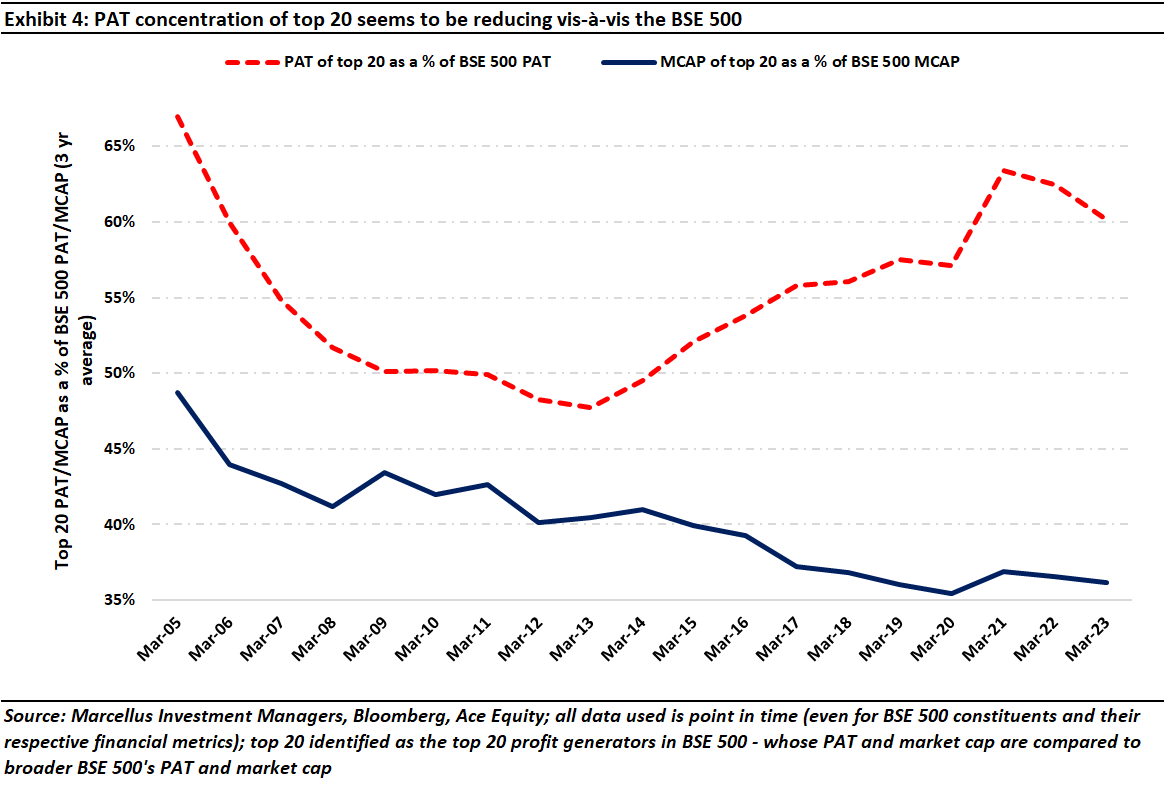
The stock market however does not seem to have clocked the fact that the dominance of the top 20 firms on free cashflows is higher than it has ever been (see exhibit 1 at the beginning of the note). Furthermore, within the listed universe, as the chart below shows, the top 20 companies’ share of BSE 500 market cap now stands at 35%, the lowest it has been in this century, whilst profit for top 20 as a percentage of BSE 500’s profits has only surged and not come off materially. This disconnect between the valuations of the top 20 firms and their share of India Inc’s free cashflows (from exhibit 1) represents, in our view, a massive opportunity for investors. In effect, in the middle of a bull market, investors have an opportunity to buy cash generative large cap companies at discounted valuations.
Why has profit concentration reduced post-Covid?
We believe three factors have played part in helping smaller companies address the profitability challenges they were facing in the decade running up to Covid:
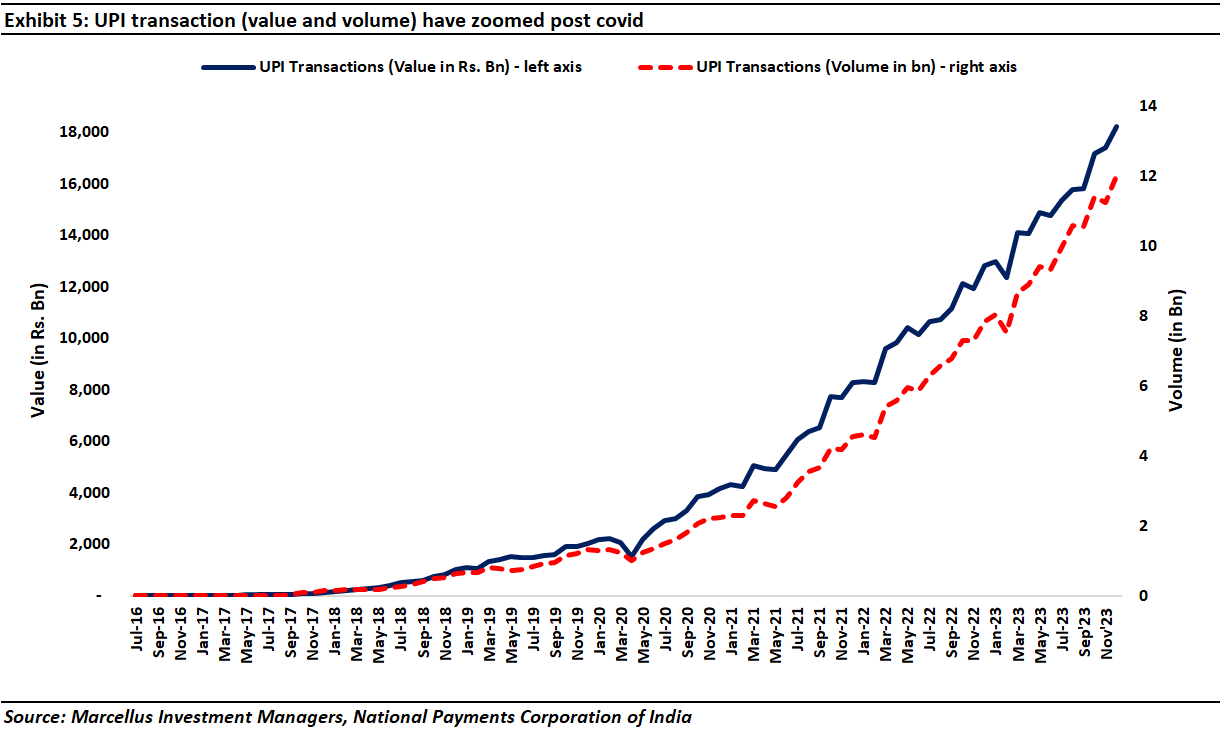
- Steady buildup of the India Stack and UPI: The JAM trinity (Jan Dhan, Aadhaar, and Mobile) has essentially pulled the country into the digital realm, by giving each citizen an identity (using Aadhaar), access to financial means (using Jan Dhan bank accounts), and overall access to the internet. Joining all of this together seems to have created a robust ecosystem that facilitates democratization of information and costless access to the financial system. Built on top of this is the Unified Payments Interface (or UPI) that facilitates transactions seamlessly and instantaneously across bank accounts [with no transaction costs at all for the payor or the receiver]. After growing exponentially through Covid, as of December 2023, UPI transaction value crossed INR 180 tn (or ~USD 2.17 tn per annum), more than 50% of Indian GDP (see chart below)! This rapid spread of a low cost, easy-to-use digital payments system has conferred many benefits on SMEs and MSMEs including: (1) a reduction in the time taken to settle transactions and, as a result, a reduction in working capital cycles; and (2) elimination of the transaction costs associated with plastic cards, cheques (which entailed visits to the bank) and cash (which also could entail visits to the bank and/or physically travelling to take or make a payment). For more on this please refer to our blogs dated 24th December 2022, ‘Winners Take All’ in India’s New, Improved Economy, and 17th February 2023, Nandan Nilekani and the $10 Trillion Remaking of India.
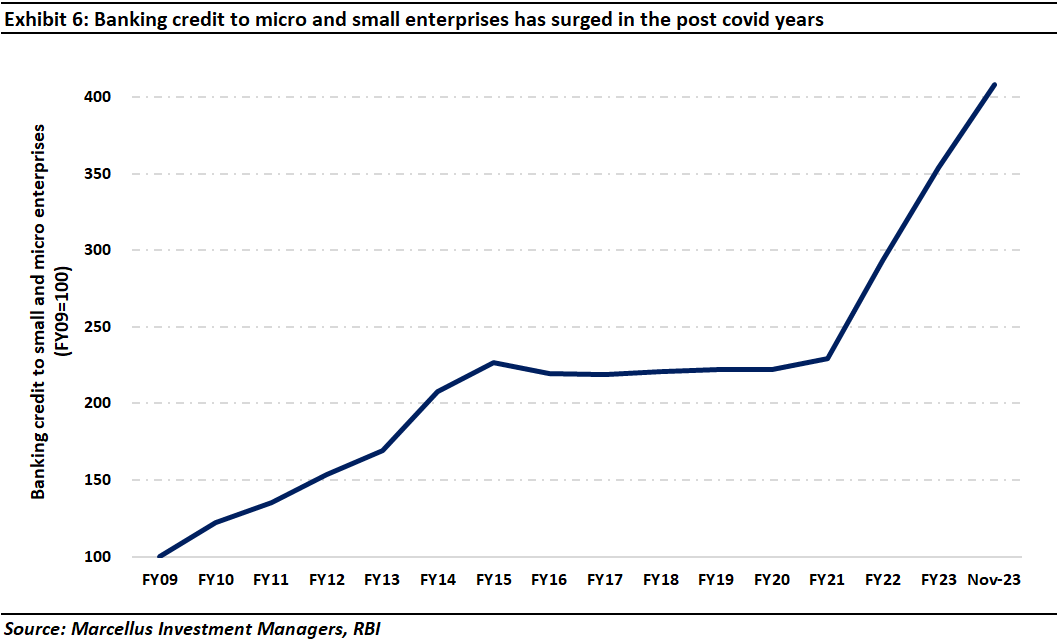
- Greater access to credit for creditworthy borrowers: An added benefit of the proliferation of instantaneous online transactions via UPI is the generation of multi-page bank statements for not just wealthy people but also for SMEs such as the local vegetable vendor, the roadside tea-stall and the rickshaw driver. Using these bank statements, any lender can now easily assess the creditworthiness of a customer and then offer working capital or housing loan. This has brought millions of borrowers who were hitherto unable to access credit from the formal financial system (and hence used to borrow from moneylenders at interest rates of 20% per annum or more) into the purview of the formal lending ecosystem (which lends to them at rates between 9-15% per annum). According to the RBI, bank lending to micro and small-scale companies has almost doubled post-FY21 (see chart below). This rapid growth in lending to SMEs has come at a time when the Indian banking system is witnessing its highest ever level of capital adequacy (hovering around 17%; source: RBI [sourced by Avendus Spark research]) and its lowest level of Non-Performing Assets (~3.2%). Therefore, the measures taken between 2015-18 to clean-up and reform the banking system (e.g., the Asset Quality Review of 2015, the Insolvency & Bankruptcy Act of 2016) have also been instrumental in driving credit into the hands of the credit starved SMEs
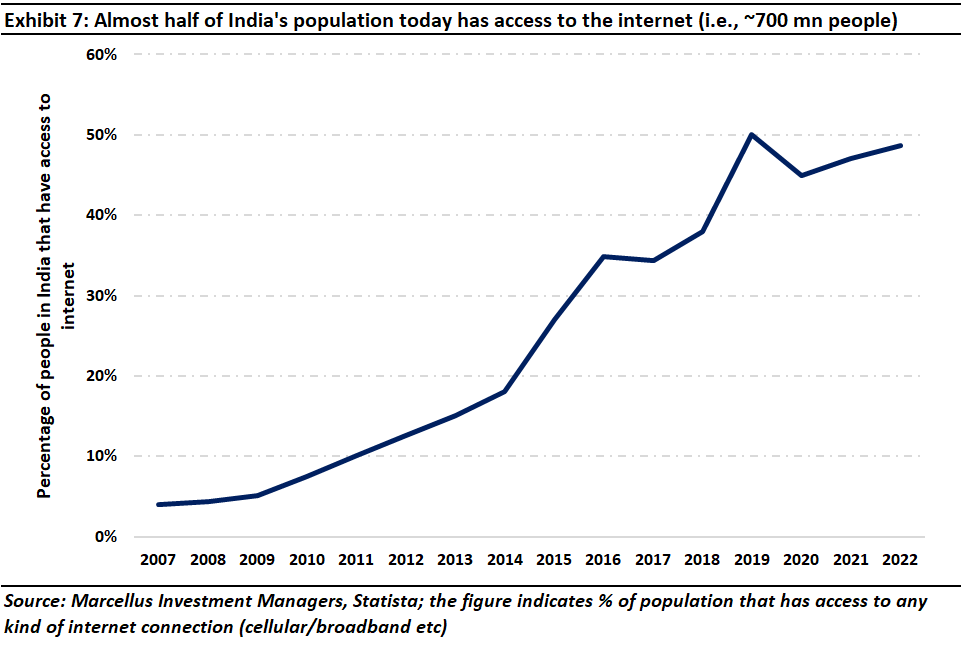
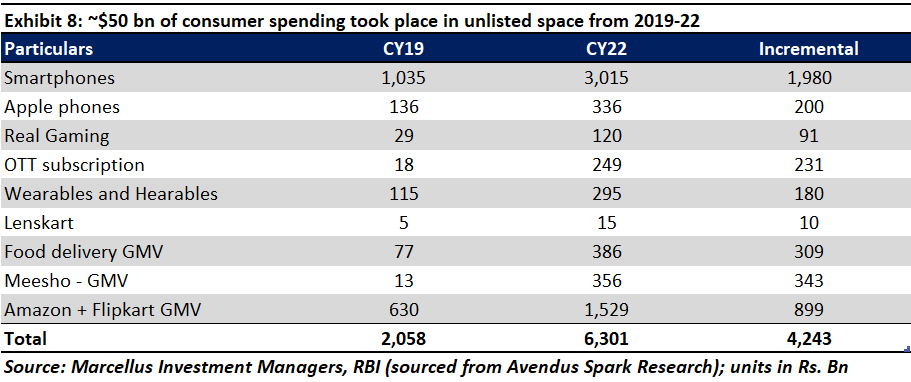
- Smaller firms’ use of social media to create brands & credibility: With Indians across the country getting access to speedy, low-cost internet connections (at 1/40th the cost of what Americans pay for ‘data’) from 2017 onwards, courtesy Jio, the proliferation of social media and e-commerce platforms has been a gamechanger, especially for SMEs. As a result, today almost half of the entire Indian population has access to internet (see exhibit 7 below). Just to contextualize this figure, this is almost 2x the size of the American population! Furthermore, E-commerce and social media platforms have allowed entrepreneurs to reach their end consumers virtually and reduced the moats associated with traditional ‘bricks & mortar’ distribution models. As a result, new age companies are pulling market share (and therefore profits) away from the large, entrenched incumbents. According to Avendus Spark research, roughly US$50 bn of incremental consumption by individuals in India is now accounted for by unlisted companies (see exhibit 8 below).
Will profit concentration continue to fall in the years ahead?
The FY15-22 period was an atypical period for India with the Asset Quality Review for banks, demonetization, GST, and Covid coming in quick succession and impacting smaller firms more than it impacted the giant top 20 companies. With no such exigencies hitting smaller business in FY22 and FY23 and with positive tailwinds from UPI, social media and a strong banking system, these firms are finding their feet again. Apart from the PAT of the top 20 firms, there is another way to understand this democratization of profits.
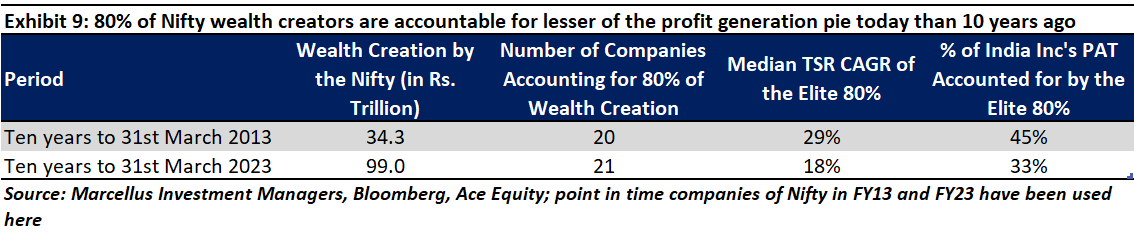
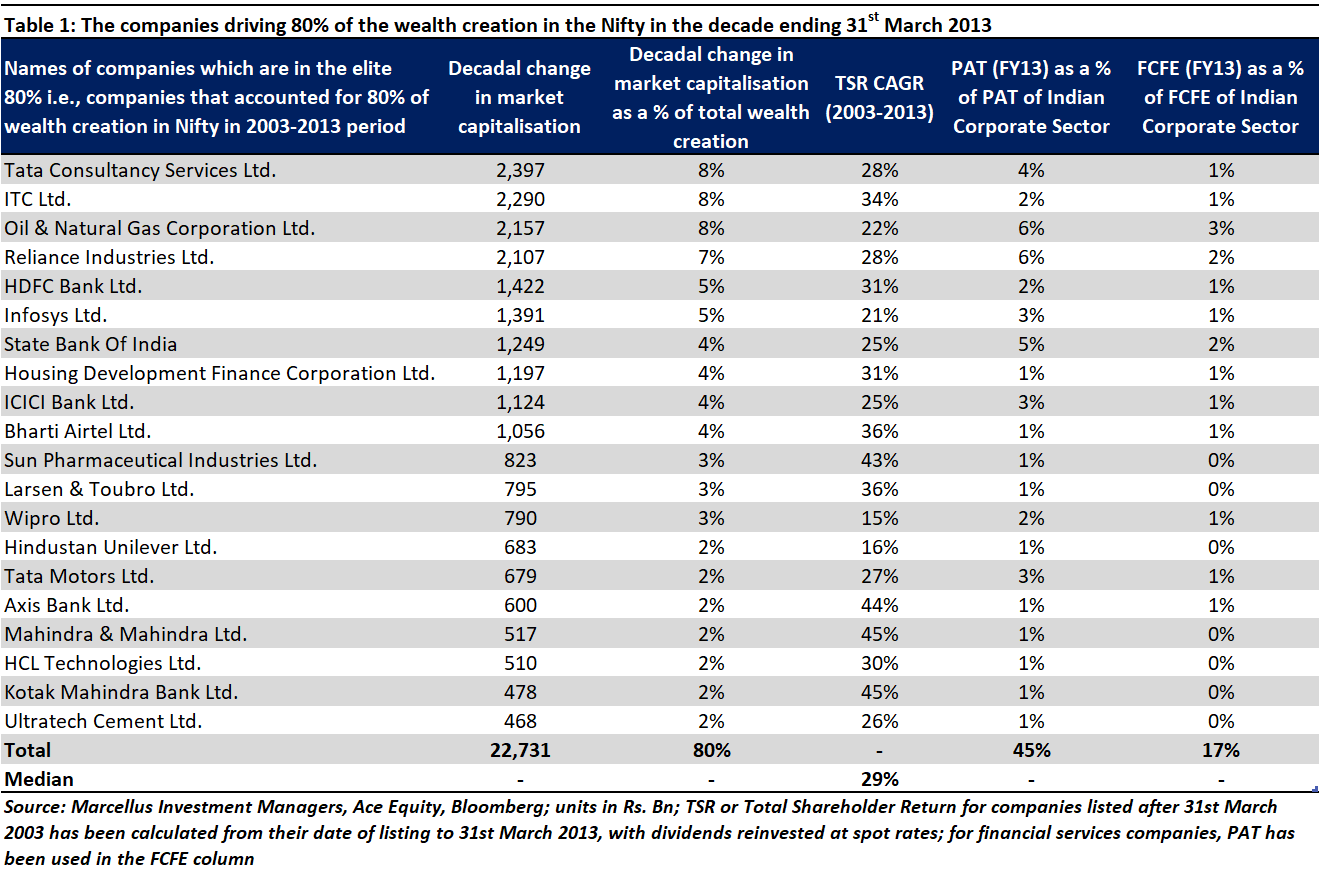
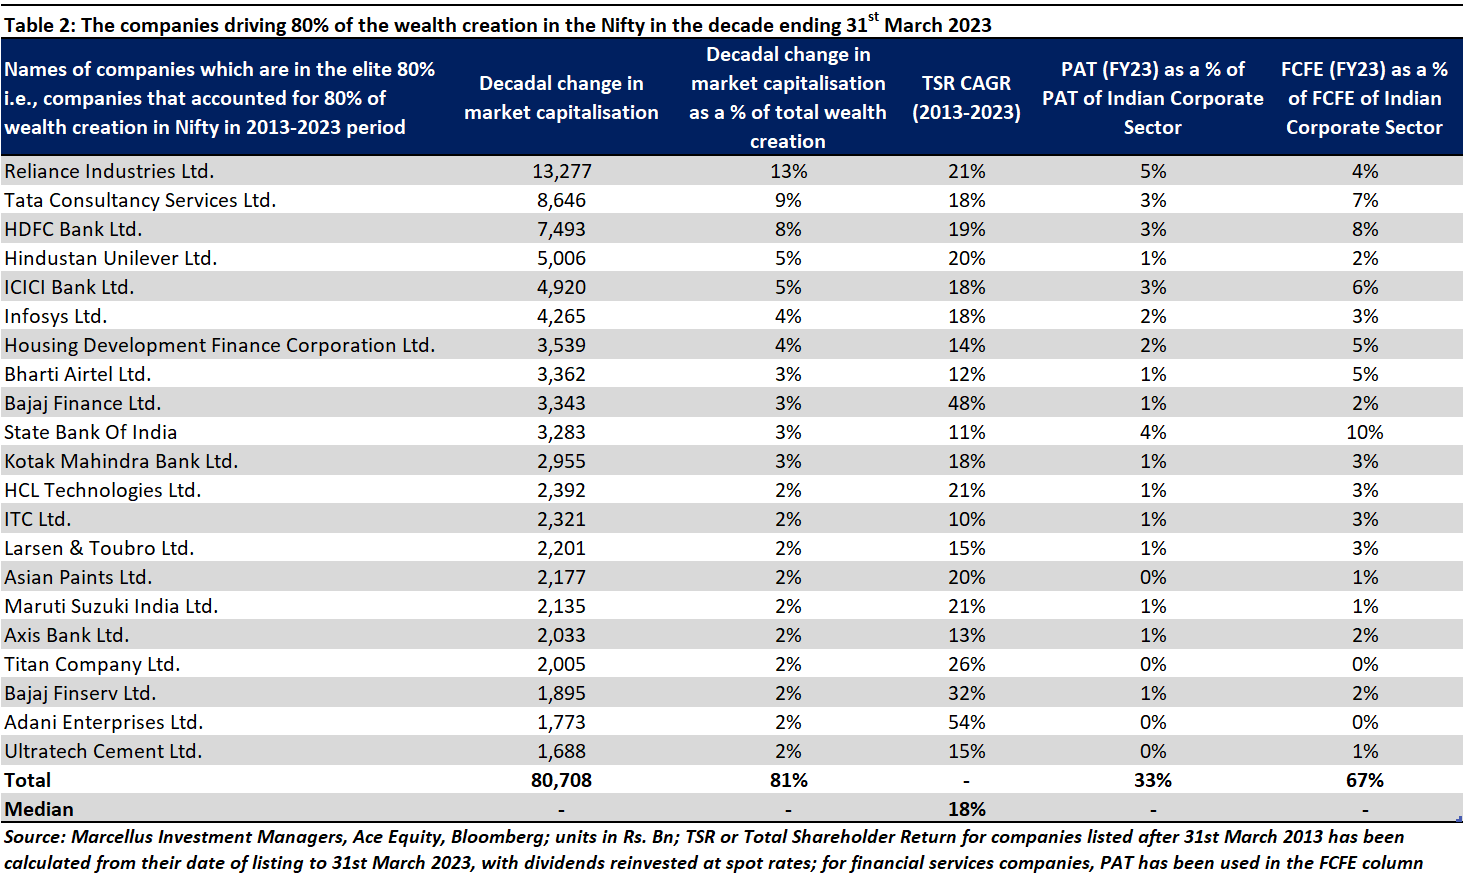
The concentration of profit amongst listed companies which have generated 80% of the wealth created by the Nifty in the last decade has shrunk to 33%, down from 45% a decade ago (see exhibit below – see appendix for a complete list of these securities).
The rapid build out of physical infrastructure over the past decade (the highway network has doubled, domestic passenger traffic on airlines has quintupled), the omnipresent digital ramp-up of the India stack and the advent of GST is creating a large, integrated economy. In such an economy, companies who can efficiently scale their businesses across India will naturally have lower per unit costs and hence, more profitability. Therefore, we believe the longer-term upward trajectory of the profits of the top 20 firms should continue. To put things into context, when the Indian economy was liberalized by the economic reforms of 1991, the top 20 firms accounted for around 15% of India Inc’s profits. This figure had gradually risen to 40% by FY08 and has now returned to that figure (after going above 100% in the wake of Covid). The odds are in favour of this number to continue to rise gradually as the Indian economy becomes more integrated and more efficient. In a note following this we will explore how sustainable is this trend i.e., will it invert or stay this way and what are its implications.
Nandita Rajhansa and Saurabh Mukherjea work for Marcellus Investment Managers (www.marcellus.in). Amongst the companies mentioned in this note, Tata Consultancy Services, HDFC Bank, Infosys, ICICI Bank, Axis Bank, Kotak Mahindra Bank, Bajaj Finance, Asian Paints, and Titan are part of Marcellus’ various portfolios. Nandita and Saurabh may be invested in these companies and their immediate relatives may also have stakes in the described securities. The described stocks/securities are for educational/illustration purpose only and not recommendatory.
Disclaimer:
If you want to read our other published material, please visit https://marcellus.in/pms-investment-blog/
Note: the above material is neither investment research, nor investment advice. Marcellus does not seek payment for or business from this material/email in any shape or form. Marcellus Investment Managers Private Limited (“Marcellus”) is regulated by the Securities and Exchange Board of India (“SEBI”) as a provider of Portfolio Management Services. Marcellus is also a US Securities & Exchange Commission (“US SEC”) registered Investment Advisor. No content of this publication including the performance related information is verified by SEBI or US SEC. If any recipient or reader of this material is based outside India and USA, please note that Marcellus may not be regulated in such jurisdiction and this material is not a solicitation to use Marcellus’s services. This communication is confidential and privileged and is directed to and for the use of the addressee only. The recipient, if not the addressee, should not use this material if erroneously received, and access and use of this material in any manner by anyone other than the addressee is unauthorized. If you are not the intended recipient, please notify the sender by return email and immediately destroy all copies of this message and any attachments and delete it from your computer system, permanently. No liability whatsoever is assumed by Marcellus as a result of the recipient or any other person relying upon the opinion unless otherwise agreed in writing. The recipient acknowledges that Marcellus may be unable to exercise control or ensure or guarantee the integrity of the text of the material/email message and the text is not warranted as to its completeness and accuracy. The material, names and branding of the investment style do not provide any impression or a claim that these products/strategies achieve the respective objectives. Further, past performance is not indicative of future results. Marcellus and/or its associates, the authors of this material (including their relatives) may have financial interest by way of investments in the companies covered in this material. Marcellus does not receive compensation from the companies for their coverage in this material. Marcellus does not provide any market making service to any company covered in this material. In the past 12 months, Marcellus and its associates have never i) managed or co-managed any public offering of securities; ii) have not offered investment banking or merchant banking or brokerage services; or iii) have received any compensation or other benefits from the company or third party in connection with this coverage. Authors of this material have never served the companies in a capacity of a director, officer or an employee.
This material may contain confidential or proprietary information and user shall take prior written consent from Marcellus before any reproduction in any form.