OVERVIEW
POPULAR ARTICLES
The 20 most profitable firms in India now generate 70% of the country’s profits, up from 14% thirty years ago. The rise of India’s networked economy (highways, cheap flights, broadband, GST) has allowed large, efficient firms to use superior technology & better access to capital to squash smaller competitors. In line with what is being seen in the US, the growing dominance of a handful of very large companies in India is changing the template of capitalism in India. This has very significant implications for how portfolios are constructed and how valuation techniques are used in India.
“This survival of the fittest, which I have here sought to express in mechanical terms, is that which Mr. Darwin has called ‘natural selection’, or the preservation of favoured races in the struggle for life.” – Herbert Spencer in ‘Principles of Biology’ (1864) after reading Charles Darwin’s book ‘On the Origin of Species’ (1859)
“Since the late 1990s, over 75% of US industries have experienced an increase in concentration levels. We find that firms in industries with the largest increases in product market concentration show higher profit margins and more profitable mergers and acquisitions deals. At the same time, we find no evidence for a significant increase in operational efficiency. Taken together, our results suggest that market power is becoming an important source of value…We also show that the higher profit margins associated with an increase in concentration are reflected in higher returns to shareholders. Overall, our results suggest that the US product markets have undergone a shift that has potentially weakened competition across the majority of industries.” – Gustavo Grullon, Yelena Larkin & Roni Michaely in ‘Are US Industries Becoming More Concentrated?’, Review of Finance, Volume 23, Issue 4, July 2019, Pages 697–743.
“The evidence suggests that there has been a moderate increase in those broad measures of concentration…at least in the US and Japan, though not in European countries….Looking at the evidence on other indicators of competitive intensity, we can see that mark-ups and profits in the US have significantly increased. Data on mark-ups in Europe is unfortunately more limited; however, the picture that is available suggests a more mixed picture on mark-ups across different European countries, though there is a strong trend towards increased profits. Worryingly the rate of churn in the US appears to have fallen, while again in Europe the picture is mixed….there are a broad range of indicators suggesting that, on average, market power is increasing.” – ‘Market Concentration Issues Paper’, OECD, 20th April 2018.
Time to rebuild our mental models of how India functions
Whilst several Western academics have published credible analysis of how their economies have become less equal, we haven’t come across analysis of comparable quality in India. In our January 23rd 2020, blog – How the Nifty will change in the coming decade? we had highlighted how in several sectors in India, one or two companies account for 80% or more of the profits generated:
“India is already an economy with extraordinary levels of profit share concentration in many key sectors. For example, in paints (Asian Paints, Berger Paints), premium cooking oil (Marico, Adani), biscuits (Britannia, Parle), hair oil (Marico, Bajaj Corp), infant milk powder (Nestle), cigarettes (ITC), adhesives (Pidilite), waterproofing (Pidilite again), trucks (Tata Motors, Ashok Leyland), small cars (Maruti, Hyundai) we already have one or two companies accounting for 80% of the profits generated in the sector. Now this trend looks likely to spread to more fragmented sectors where hitherto the unorganised players had greater profit share.”
Since at the core of our investment philosophy lies the notion of investing in firms with dominant positions and high barriers to entry, we decided to examine how the profit share of the top Indian companies has fared in the post-1991 era. What we found took our breath away.
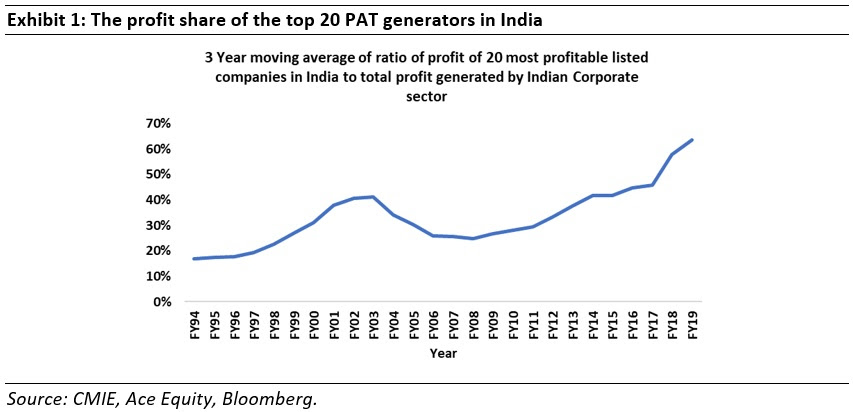
The vertical axis of the chart represents the 3-year moving average of the ratio of the amount of profit generated by 20 most profitable listed companies in India divided by the total profit generated by the entire Indian corporate sector. As the chart above shows, from around 14% when the country was opened up in the early 1990s, India’s top 20 PAT generators now account for nearly 70% of the profits generated in the world’s sixth largest economy.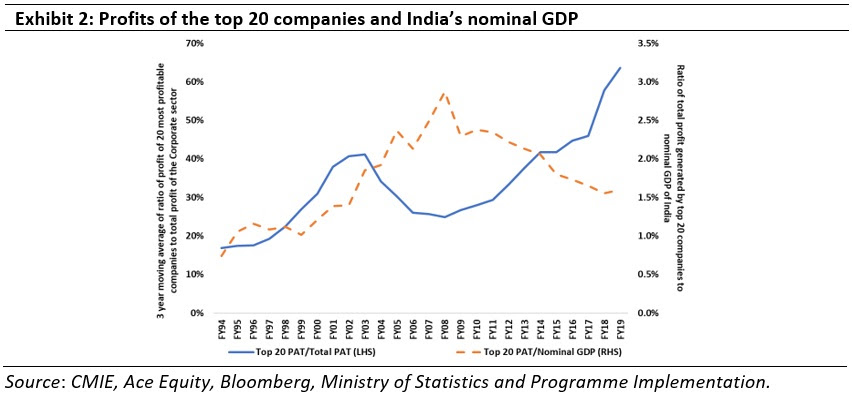
Since GDP is simply the aggregate of the returns to land, labour & capital, we then looked at what % of Indian GDP is accounted for by the PAT of the top 20 companies. In the above chart, the left axis is the same as Exhibit 1 and the right axis shows the PAT of the top 20 companies divided by India’s Nominal GDP. Although the share of top 20 companies in Total PAT has increased significantly (LHS) from FY08, their PAT as a % of GDP (RHS) has declined during the same period. In fact, for the entirety of the 21st century, the two lines in Exhibit 2 have moved in opposite directions.
So why are the largest Indian firms becoming utterly dominant leviathans?
- A networked economy helps more efficient companies: In our 1st March 2019 blog – Exit the Kirana Store, Enter the Supermarket we had highlighted how over the past ten years, the length of roads in India has increased from 3.3 million km to 5.9 million km (CAGR of 6%). The number of mobile phone subscribers has increased over the same period from 392 million to 1161 million (CAGR of 12%). The number of broadband users has increased from 6 million to 563 million (CAGR of 57%). A decade ago, around 44 million Indians were taking flights each year. Now 3x as many Indians are flying each year (CAGR of 13%). 15 years ago, only 1 in 3 Indian families had a bank account; now nearly all Indian families have a bank account.
As a result of this networking of the Indian economy, efficient companies with strong distribution systems have pulled away from regional & local players. For example, as the economy gets integrated, lending, which was once dominated by regional players is now seeing the emergence of a few national leviathans like HDFC Bank and HDFC with both lenders entering the list of top 20 PAT generators over the last 10 years.
- Regulatory burden is higher for smaller companies: Economists have long believed that onerous regulatory regimes hurt smaller companies more than larger ones. As highlighted in this article a newly incorporated Indian company has to obtain registrations under at least seven regulators and file a minimum of 18 to a maximum of 69 returns a year. Clearly, smaller players, with limited resources, must spend relatively more resources than the larger ones. Similarly, the cost of adapting to GST was negligible for a leviathan like Asian Paints but far more significant for a smaller paint company with a fraction of Asian Paints’ market share.
Interestingly, in this regard, social media has done a disservice to smaller companies – with regulators now worried that a small company under their watch will malfunction and thus cause a stink on social media, they have surrounded the small company with the same thicket of regulations which they used to foist exclusively on larger companies. In fact, the ability to handicap smaller competitors by influencing regulation has increasingly become the hallmark of many of India’s leviathans.
“Technological changes provide another plausible explanation for the recent increase in industry concentration levels. Developments in technology have created advantages for economies of scale, and have arguably changed the industry landscape….Public adoption of the Internet in the late 1990s, as well as the concomitant popularization of personal computers, has had an extensive impact on productivity and growth. If large firms are better able to develop and implement technology, then recent technological advances may create barriers of entry to new firms. In support of this argument, we calculate the evolution of patent-based industry concentration by looking at the share of total patent activity by the largest four firms in the industry using the patent database by Kogan et al…. These results suggest that complex technology also facilitates synergy potentials and increases barriers to entry.” – Gustavo Grullon, Yelena Larkin & Roni Michaely, Review of Finance, Volume 23, Issue 4, July 2019, Pages 697–743
- Technology as a barrier to entry: As per a March 2019 survey conducted by McKinsey, smaller Indian companies have adopted the system of accepting digital payments more than the larger companies. However, they just do not have the resources for advanced technologies such as artificial intelligence and the Internet of Things. This is where the larger companies score over the smaller companies. We find in our portfolios, that in businesses where pan-India distribution/presence is required, market leaders like Asian Paints, HDFC Bank, Astral Poly, Pidilite, Page Industries, etc. have made skilful use of technology to build barriers to entry (see Chapters 2, 5, 7 & 8 of ‘The Unusual Billionaires’ by Saurabh Mukherjea). For example, it is highly unlikely that any paint company will be able to build an Enterprise Resource Planning system remotely comparable to what Asian Paints has. Hence Asian Paints’ working capital cycle at 8 days will remain a massive source of superior cashflows whilst its competitors continue to live with working capital cycles in excess of 100 days.
Further as Sameer Arora of Syntel highlights, older Indian firms are reluctant to update their old IT systems because of the heavy capex involved and the need to provide training to the workforce (with many of the unionised workers themselves having no interest in being trained). India’s PSUs are an obvious example of this resistance to tech change (Link).
- Lower cost of capital for the giants: India’s top 20 PAT generators fall into two broad buckets: (a) private sector companies which have superior free cash flow generation thanks to their ROE being significantly above their cost of equity eg. HDFC Bank, ITC, HDFC, TCS, etc; and (b) giant PSUs which get access to capital at a low cost because of their implicit sovereign guarantee. Smaller companies have access to neither source of capital. This in turn all but eliminates their chances of being able to compete with these leviathans. For example, ITC has over Rs 28K crore of cash on its balance sheet. In addition, ITC generates Rs 10K of free cashflow in a typical year. For any FMCG firm which isn’t a leviathan, competing with ITC’s cash machine is a difficult proposition.
Investment Implications
“…we find that firms in more concentrated industries experience significant abnormal stock returns, which indicates that a considerable portion of the gains accrues to shareholders. Prima facie, the positive and significant alphas connote a simple and profitable trading strategy, which is interesting in its own right. This finding also raises the question, why does the market not “get it” in the first place.” – Gustavo Grullon, Yelena Larkin & Roni Michaely, Review of Finance, Volume 23, Issue 4, July 2019, Pages 697–743.
Implication #1: Consistent Compounding by investing in clean, well-managed leviathans
As we have highlighted repeatedly in Marcellus’ newsletters/blogs and in our books, dominant Indian companies’ very high ROCEs give them access to low cost capital which when reinvested sensibly in technology, distribution networks, new plants & more products, allows compounding machines like HDFC Bank and TCS to give their shareholders superior returns with risk comparable to a Government of India bond. See our 14th June 2019 blog for a fuller exposition of this point: Crushing risk is more rewarding than chasing returns
Implication #2: Invest in the next wave of ‘top 20 PAT generators’
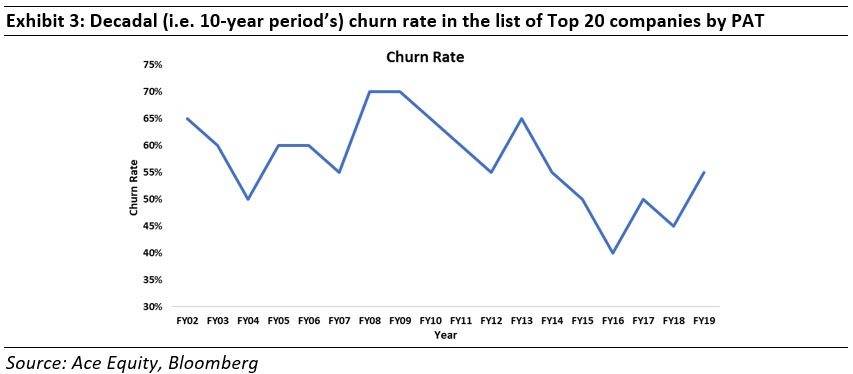
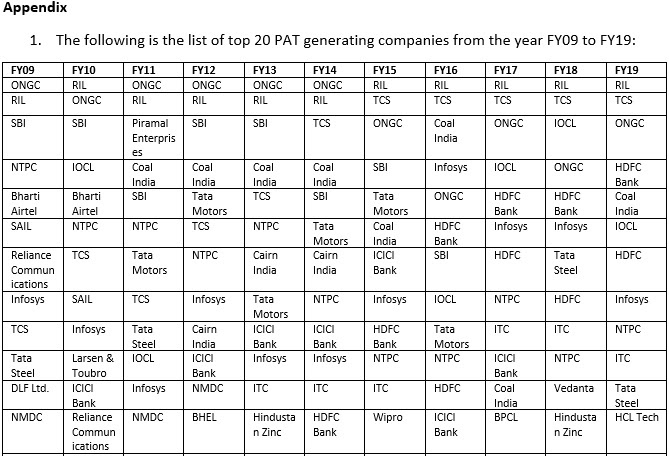
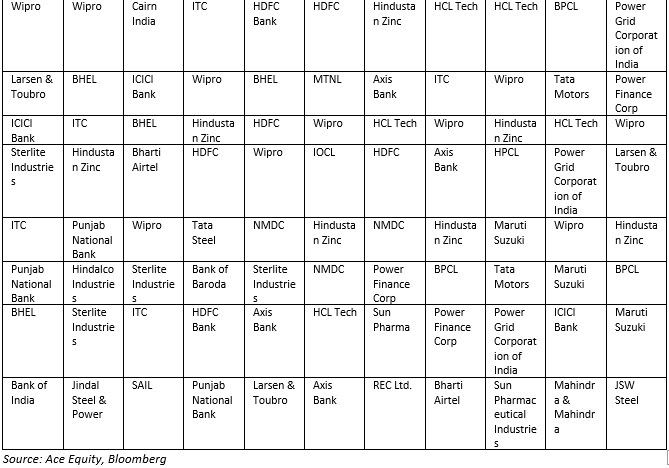
Whilst the dominance of the leviathans continues to grow, the list of the top 20 PAT generators is far from static. In the above chart, the vertical axis represent the churn rate in the top 20 companies over a 10-year period. Eg. In the FY19 list of 20 most profitable Indian companies, there were only 9 companies which were present in the list of FY09. Hence the churn rate is 55% (11 companies/20 companies). In fact, in our January 4th 2019 blog – How competitive advantage drives churn in the stockmarket we had mentioned that the churn rate for BSE500 is 55-60% over a 10 year period and then explained why it is so by breaking the industry life cycle into four stages.
The churn rate among the top 20 PAT generators is also high at 55-60% implying that there is still a lot to play since the commanding heights of the Indian economy have not yet been locked down firmly. In fact, if you had invested in an equally weighted portfolio in FY09 of the 11 companies which have been added to the top 20 list of FY19, your total shareholder return CAGR would be 26% CAGR (FY09-FY19).
So which companies will be in the top 20 PAT generators list in FY29? Peering into the (murky) crystal ball, we see the following:
- The giant PSUs will continue exiting from the list because of sub-par capital allocation (forced upon it by its largest shareholder) and because of the relentless need of the sovereign to exercise its patronage.
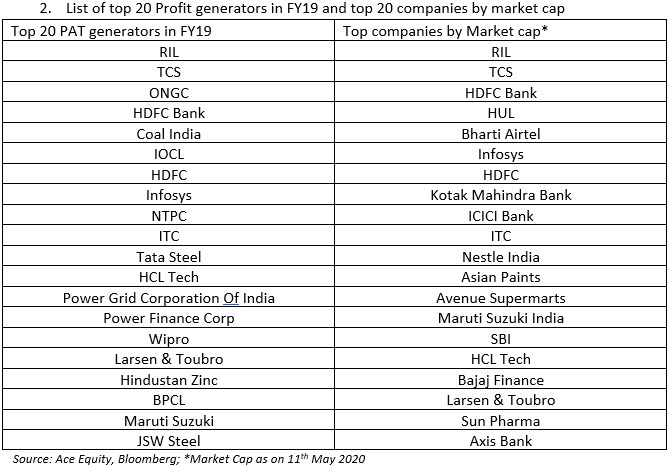
- Companies which are good capital allocators, whose promoters don’t fiddle with the figures and which have high barriers to entry are likely to enter the top 20 list. Here is a list of potential entrants (with their FY19 PAT ranking in brackets): Kotak Bank (21st), Axis Bank (29th), Bajaj Auto (30th), Bajaj Finance (35th), Eicher Motors (57th), Asian Paints (59th).
- Like other developed countries whose economies have formalised, the profit share of the top 20 PAT generators in India will also continue to increase from the current 70% to 80-90% due to the reasons mentioned above. By the time we finish our careers, we would be surprised if more than 20 Indian firms don’t take home 80% of India’s profits. If you care about understanding why this will happen, it is worth reading Thomas Piketty’s magisterial book ‘Capital In the 21st Century’ (2013). In Chapter 10 of this masterpiece he says, “In all known societies, at all times, the least wealthy half of the population own virtually nothing….the top decile of the wealth hierarchy own a clear majority of what is to own (generally 60% of total wealth and sometimes as much as 90%); and the remainder of the population…own from 5-35% of all wealth.”
Implication #3: Investors will need to use DCF models properly
Whilst most investors learn DCF valuation early on their careers, the prevailing tendency is to use a cookie-cutter approach to DCF valuation (of the sort taught in academic courses which were designed in the pre-leviathan era). As explained in our 4th January newsletter: “An investor looking to buy and hold stocks over a long time period, needs to be able to differentiate between businesses which can deliver longevity of consistently healthy free cashflows and those that run a high degree of uncertainty in their fundamental prospects. This differentiation is essential, both, in order to avoid premature exits from investments in great quality franchises due to concerns around expensive valuations (e.g. P/E multiples higher than 30x), and to avoid being tempted into investing in inferior quality franchises just because they are trading at apparently cheap valuations (a 10x P/E multiple might actually be super-expensive).”
The rise of the leviathans will force investors to think more deeply about how they fade ROCE to cost of capital in their DCF models. Given that for many of the firms mentioned so far in this note, ROCE or ROE has not faded to cost of capital over the past 20 years, investors who automatically assume that it will do so over the next 20 years will end up undervaluing the leviathans with potentially adverse consequences for the durability of their portfolios.
Disclosure: Marcellus and/or its advisory clients own HDFC Bank, Asian Paints, Eicher, Bajaj Finance, TCS, Pidilite, Astral Poly, Page Industries, Berger Paints and ITC.
Saurabh Mukherjea and Harsh Shah are CIO and Analyst respectively at Marcellus Investment Managers respectively (www.marcellus.in).
If you want to read our other published material, please visit https://marcellus.in/
Note: the above material is neither investment research, nor investment advice. Marcellus does not seek payment for or business from this email in any shape or form. Marcellus Investment Managers is regulated by the Securities and Exchange Board of India as a provider of Portfolio Management Services and as an Investment Advisor.