OVERVIEW
POPULAR ARTICLES

Capitalising on the exponential surge in digital transactions and the massive improvements in transport infrastructure and market structure seen over the past decade, a handful of Indian companies – no more than 20 – are taking home ~80% of the profits generated by the Indian economy. Simultaneously, a mere 20 companies account for 80% of the $1.4 trillion of wealth created by the Nifty over the past decade. Understanding these drivers of economic and financial polarisation is now critical for achieving success in the Indian stock market.
“….three big revolutions will be—democratizing credit through AA [Account Aggregation Framework], democratizing commerce through ONDC; and essentially making the delivery of products much simpler and cheaper with logistics’ transformation. These three steps will lay the foundation for equitable commercial activity for both goods and services. India will move from a pre-paid cash informal economy to a post-paid formal cashless productive economy.” –Nandan Nilekani in an interview with the Livemint, 2022.
India’s smallest businesses epitomize the rise of a new, more efficient economy.
We are seeing the rise of a new, more efficient, more digital and more scalable India. An example of this is the local chai vendor who has set up shop just outside our office in the Andheri East suburb of Mumbai. A year ago, when the tea stall started business, the said vendor was selling 500-600 cups per day. Today, the vendor sells around 7,000-8,000 cups of beverages per day i.e., 15x growth in one year. Spotting a gap in the market, a cigarette vendor set up shop next to the tea vendor, four months ago. From clocking revenues per day of Rs 1,000/day in his first few weeks, the cigarette vendor now generates Rs. 8,000 per day.
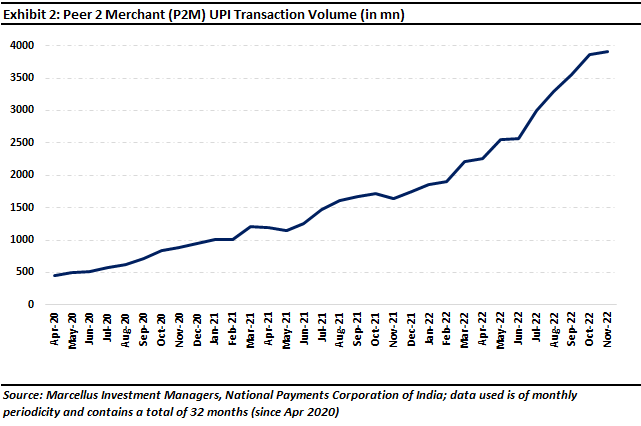
Both of these vendors receive vast majority of their payments via Unified Payments Interface (UPI), a real time mobile-based payment system. According to them, when they started their tea and cigarette stalls hardly 20-30% of people used to pay via UPI. Today, almost 70-80% of their customers pay via UPI (the remainder still use cash). According to National Payments Corporation of India (NPCI), peer-to-merchant (P2M) UPI transactions recorded 138% YOY growth in November 2022 – see exhibit below which shows that in November alone, India recorded 4 billion peer-to-merchant transactions!
If we look at the digital payments data in India, National Electronic Fund Transfer (NEFT) accounts for 55% of all digital transactions in FY22. Going further, if we look at transactions done via smartphones [which includes UPI (16% share), Immediate Payment Service or IMPS (12%), and e-wallets (1%)], they account for another 29%, which brings the total to 84%. If we again add the share of debit and credit cards, another 3.5% is added, which brings the total to 87.5%. Therefore, as of FY22, around 88% of transactions in India (by value) were via digital methods of various sorts (source: SBI Research, 2022).
Among categories which recorded high volumes of approved UPI transactions in November were groceries and supermarkets, eating places and restaurants, games, department stores, pharmacies, etc.(source:Financial Express, 2022). In fact, the cigarette vendor outside our office told us that when it comes to online payments, he only transacts via UPI. This implies that he does not use any banking apps or websites, nor does he use debit/credit cards. According to the Ministry of Finance, now more than 40% of total digital transactions (by volumes) in India are via UPI and UPI based transactions amounted to more than $140 billion in August 2022. In other words, on an annualized basis UPI transactions are running at $1.7 trillion per annum (source: Press Information Bureau, Government of India, 2022). UPI has become ubiquitous in India. For instance, recently one of our colleagues was in a small village in Meghalaya, near the border with Bangladesh, and there he paid for his Maggi noodles using UPI.
The polarization of profits and of wealth India
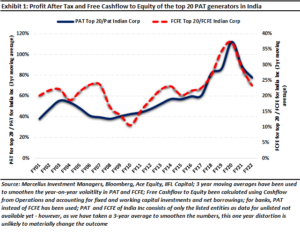
UPI and the digitization of business activity in India is one of the several factors driving an exponential surge in the concentration of corporate profitability in India. As explained in this note, improvements in transport infrastructure (e.g., the highway network has doubled over the past decade), the introduction of GST (in 2017) and new business models which have migrated from the developed world to India over the past decade, are resulting in India’s 20 largest profit generators earning a staggering 80% of the nation’s profits as compared to around 40% a decade ago (see Exhibit 1). This in turn is leading to an increasingly polarized stock market.
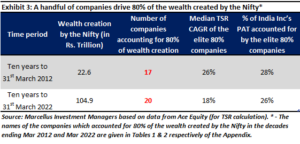
In the decade ending 31st March 2012, the Nifty added around $440 bn in market cap. In these ten years, ~80% of the value generated came from 17 companies and the median Total Shareholder Return (TSR) CAGR was 26% for these 17 companies. Moving forward by a decade, in the decade ending March 31st, 2022, the Nifty added ~$1.4 trillion in market cap. And 80% of the value generated in these ten years came from just 20 companies whose median TSR CAGR was 18%.
As the table above shows, wealth creation in India is being driven by a dozen and a half companies. Another way to understand this is to look at the polarisation in Free Cashflows to Equity (FCFE). A decade ago, the top 20 FCFE generating companies in the Nifty (in the decade ending March 2012) accounted for just 23% of India Inc’s FCFE. Moving forward by a decade, if we look at the top 20 FCFE generating companies in the Nifty in the decade ending 31st March 2022, they account for 51% of India Inc’s FCFE (see table 4 in the Appendix).
Polarisation in the Indian stock market therefore has TWO separate dimensions:
- A handful of companies – precisely TWENTY are now taking close to 80% (on a 3-year moving average basis) of the profits and more than half of the FCFE generated by the Indian corporate sector – see tables 3 & 4 in the Appendix. Even though the concentration has reduced on an absolute basis in FY22 vis-à-vis FY20 and FY21, the uptrend (as seen in Exhibit 1) is quite distinct and clear. This profit concentration in the hands of the top 20 companies and an even greater concentration of cashflows in the past decade has allowed strong franchises (with healthy PAT to FCFE conversion rates) to reinvest in their businesses and thus outgrow their competition. And it has nothing to do with Quantitative Easing (QE) by central banks or with Covid.
- Just TWENTY companies have accounted for 80% of the wealth created by the Nifty in the decade ending March 2022 (see Exhibit 3). In comparison, 17 companies accounted for the same proportion of the wealth created by the Nifty in the decade ending Mar 2012, meaning wealth creation has consistently remained concentrated in the hands of a few dominant franchises over the last decade – see Tables 1 & 2 in the Appendix.
The drivers of polarisation in the Indian stock market
So why is this happening? Two different dynamics – one Indian and one global – are at play here. We begin by highlighting the Indian dynamic at play which is the networking of the Indian economy over the past decade.
A networked economy helps more efficient companies.
In our 1st March 2019 blog Exit the Kirana Store, Enter the Supermarket we had highlighted how over the 2012-2022 period, the length of highways in India has nearly doubled from ~76k km to ~140k km (CAGR of 6%). The number of smartphone subscribers has increased over the same period from 44 million to 600 million (CAGR of 30%). The number of internet users has increased from 137 million to 658 million (CAGR of 17%). A decade ago, around 162 million Indians were taking flights each year. Now 2x (pre pandemic in FY20) as many Indians are flying each year (CAGR of 6%). 15 years ago, only 1 in 3 Indian families had a bank account; now nearly all Indian families have a bank account.
As a result of this networking of the Indian economy, efficient companies with strong pan-India distribution systems have pulled away from regional & local players. For example, as the economy gets integrated, lending, which was once dominated by regional players is now seeing the emergence of a few national leviathans like HDFC Bank and HDFC with both lenders entering the list of top 20 PAT generators over the last 10 years.
The global dynamic is the rise of affordable, easy to use enterprise technology (built around mobile, SaaS, and cloud) which if implemented well, increases profit margins, reduces working capital cycles, and increases asset turnover. We now describe how India’s best compounders are using technology and the changes in the country to create wealth for Marcellus’ clients.
Sunk costs drive industry concentration
In 1991, John Sutton of the London School of Economics wrote a prescient book titled ‘Sunk Costs and Market Structure’ which foresaw how the application of modern marketing techniques, of R&D, and of technology was going to lead to polarisation of profits. Sutton said that companies which invest in brand building and in R&D – basically, invest in intangible assets which are critical sources of competitive advantage – go on to dominate that industry, provided intangible assets are a source of competitive advantage in that industry i.e., this theory is not applicable to sectors like cement and steel where intangibles confer little by way of competitive advantage. The technical name of such investments in intangibles is “Endogenous Sunk Costs” (ESC) and Sutton said that in in absence of ESC, an industry would see tough price-based competition [which is exactly what we see in sectors like steel, cement, construction, and wherever else intangibles don’t matter].
Companies that invest in technology benefit from increasing returns to scale
Sutton’s book was followed by a remarkable paper published in 1996 in the Harvard Business Review by Brian Arthur. Titled ‘Increasing returns and the new world of business’, Arthur highlighted that the conventional idea of diminishing returns to scale is being replaced by businesses that are generating increasing returns to scale. Increasing returns basically mean the tendency of returns (on the goods produced or the services provided) to keep increasing as output increases whereas diminishing returns imply the opposite. In Arthur’s words: “As the economy shifts steadily away from the brute force of things into the powers of mind, from resource-based bulk processing into knowledge-based design and reproduction, so it is shifting from a base of diminishing returns to one of increasing returns. A new economics—one very different from that in the textbooks—now applies, and nowhere is this more true than in high technology. Success will strongly favor those who understand this new way of thinking.”
Tying this idea to what Sutton had said in 1991, several management gurus then pointed out in the years that followed that the nature of goods that are produced has changed radically from being bulk-produced and process-driven to increasingly being technology driven and customized to a greater extent. This enables a positive feedback loop in the economy where one set of, say algorithms, once developed by someone can be applied to numerous other functions by tweaking them slightly at no extra cost, essentially making the idea of marginal cost of production (the cost to produce one additional unit) redundant. Therefore, once returns start accruing for such companies, they continue to grow over time at an increasing rate. Microsoft’s Windows operating system became the classic example of this sort of product.
Furthermore, as we entered the 21st century, another economic factor emerged to make the increasing returns to scale ever more dramatic – network effects. Network effect is a phenomenon where the utility of any product/service gets enhanced as the number of people using it rises. Simply put, higher the number of users, more efficient the product/service becomes, leading to more people using it and so on. A classic example of this is the Windows operating system by Microsoft. Because of the ease of use and sheer computational power of the operating system, a lot of people end up using it. Because they use it, the people who interact with them would also want to use it for seamless collaboration. This creates a positive feedback loop which feeds into itself and creates strong network effects that results in Windows being the most preferred operating system. In fact, the compatibility and interoperability of software with certain hardware, like the iOS with iPhones and MacOS with MacBooks for example, lead to this effect kicking in among customers, who after some initial training, need only adapt a little as the products update, further strengthening the positive feedback loop.
Growth in profitability is increasingly NOT related to traditional capex.
Jonathan Haskel & Stian Westlake then developed this line of thinking further in their 2017 book “Capitalism Without Capital”. The central theme of the book is that corporate investments, in the past 40 years especially, have become increasingly intangible rather than tangible. Aggregating data for the developed world, the authors show that around the turn of the century, the developed economies started investing more in intangibles (which traditional accounting techniques do NOT capture as capex) and less in tangibles (like factories & machines). The pre-eminence of intangible investing according to the authors have brought to the fore four effects that intangible assets showcase:
- Scale: intangibles are easily scalable to any length once developed initially,
- Sunk costs: intangibles have sunk costs tied to them i.e., costs that cannot be recovered),
- Spillovers: a company that makes an investment in intangibles may not be the only one, or not even the one to reap its benefits fully later; they are more often than not reaped by others, and
- Synergies: multiple intangible assets may collectively produce even higher returns than what they would produce individually.
These four effects are crucial for a company to become a consistent compounder because once a company scales using intangibles assets (such as a proprietary database), it can then extract spillovers from other companies’ investments in intangibles (such as a third party software platform like SAP), and then create synergies between intangible investments (the proprietary database feeds the SAP with big data) which can potentially help the company corner the entire industry (first in its home market and then in the global market).
Scale, sunk costs, spillovers and synergies and the underlying heavy intangible investments that enable them, have been catalyzed in India by the:
- Introduction in 2017 of a single Goods and Services Tax (GST) which has integrated the economy (as compared to the pre-2017 position where each of India’s 28 states & union territories had separate indirect tax regimes which resulted in an artificially fragmented economy).
- Building of infrastructure like extensive road networks and freight corridors that has eased transportation of goods and materials across geographies. For example, it now takes 3 days for a truck to go from Coimbatore in south India to Ludhiana in north India, a distance of ~2800 km. Ten years ago, the same journey would have taken 10 days.
- Attack on the tax evasion and the associated shift by Indian households to financial savings from physical savings. Indian households have over each of the past five years generated incremental financial savings of $300 bn per annum. This has sharply reduced the cost of capital for companies with clean accounts and prudent capital allocation.
- Rise of mobile broadband – the cost of 1 MB of mobile broadband in India has fallen to Rs. 0.0043, versus Rs. 2.5 a decade ago. India is now the world’s biggest user of mobile data with ~40x growth over the past decade in the number of Indians using smartphones.
These four economic changes have in the space of a decade, created a cohort of well-managed, increasingly high-tech listed Indian companies which are investing heavily in intangible assets (R&D, networks, training, branding, databases, etc.). We now highlight three such companies from our Consistent Compounders Portfolio (CCP – click here for our Nov ’22 newsletter which explains how these companies have doubled our clients’ wealth over the past four years).
Case #1:Tata Consultancy Services (TCS)
TCS has been at the forefront of fusing technology with scale over the past four decades and is now the world’s second largest IT Services firm. The Tata Group were probably the first India conglomerate to establish an R&D center, back in 1981, in order to stimulate innovation. The largest beneficiary of this innovation center has been TCS. The tools and processes developed at Tata Research Development and Design Centre (TRDDC) helped TCS accomplish some of its crucial projects in its early days, like scaling millions of transactions for stock exchanges and clearing and settlement systems, developing a factory model for the Y2K problem, or automation of large-scale manufacturing processes. Some of these eventually grew into TCS’ own products and platforms, including but not limited to BaNCS (which is a whole suite of software based service solutions like payments, transaction banking, trade processing, portfolio accounting to name a few), MasterCraft (which includes scalable Agile and DevOps solutions that assist in planning, execution, demand-to-deploy software, data management product for enterprises and so on), and recently, ignio (which is their Artificial Intelligence or AI based product that helps businesses automate and eventually become Autonomous Enterprises) and TwinX (which leverages AI to create a digital representation of operating processes for easier and better monitoring) (source: Tata Newsroom).
Over and above its investments in research & innovation, what TCS has done particularly well over the last 30-40 years is heavily investing in its most important asset – people. In 1995-97, ahead of the pack, they were the first ones to establish a training center for their employees to get skilled, in Thiruvananthapuram, Kerala. This park set up by TCS became a hub for the broader Tata Sons’ research and innovation activities, making it fungible across verticals and industries. In fact, TRDDC helped TCS not only in their traditional line of business of software development, but also extended the benefit to manufacturing firms to improve process control and systems. According to S. Ramadorai in his book ‘The TCS Story … and beyond’ (2011), “TRDDC worked on projects for Tata Steel, Tata Chemicals, Hindustan Zinc and Hindustan Copper and did some important work with Associated Cement Companies (ACC)… TRDDC researchers worked closely with ACC to develop online process controls and to improve performance. By 1999 the project had matured into a product that was adopted not just by ACC, but by other cement companies as well.”
A combination of these two factors – innovation and skilling – has helped TCS create massive amounts of intellectual property (they had applied for ~6.5k patents as of FY22). This intellectual property in turn helps TCS innovate further which then spurs upskilling of the employees. This virtuous cycle of incremental reinvestments in intangibles delivers tangible rewards. Over the last 17 years, TCS’ revenues have grown consistently at 19% p.a., Free Cashflows to Equity has grown at 22% p.a., and total shareholder return has compounded at 18% per annum.
Case #2: Dr. Lal PathLabs
The Indian market remains dominated by smaller diagnostic chains who attract business either through doctor incentivisation or on the back of reputation built by the local pathologist running the lab. We believe 80% of the diagnostics market in India is accounted for by such local labs.
From 2005 onwards, the team at Dr Lal PathLabs led by Dr. Om Manchanda has moved away from the old practice towards a hub-and-spoke supply chain led retail business model by:
(a) Going closer to the customer through gradual expansion of Collection Centres & Labs. From ~820 collection centres a decade ago, Dr Lal now has ~4,730 collection centres, ~2x as many as the second largest diagnostics firm in India.
(b) Optimizing sample collection logistics and lab automation to reduce report generation time from ~8-12 hours a decade ago to ~3-5 hours now.
Over the past 15 years, it has become part of the firm’s DNA to constantly invest in technology-based systems and processes to improve the turnaround time, improve quality of reports and become efficient.
For example, the firm’s recent ‘Control Tower’ initiative which enables monitoring of a sample lifecycle and identification/correction of bottlenecks has allowed Dr. Lal to meet the ETR (Estimated Time for Report) more than 90% of the time vs. 80% earlier.
On the back of this Control Tower initiative, Dr. Lal will be able to further reduce turn-around-time or TAT by eliminating bottlenecks in the sample journey through real time monitoring. This initiative has enabled sharing real time tracking of samples with its B2B clients (e.g., hospitals), further building the stickiness of the firm with them.
Another initiative has been implementation of ‘Digital Pathology’ which is a major mindset shift where doctors are trained to use digital screens to read samples instead of microscopes improving TAT (since samples can be viewed from anywhere even over mobile screens). These initiatives have allowed Dr. Lal to grow its revenues by ~6x and their profits by ~8x over the last 10 years.
Case #3: HDFC Bank
From its inception in 1995, HDFC Bank has been consistent in the way it has built its business. Very early on the bank was able to figure out that building a low-cost liability franchise with a robust risk-management system in place for lending is a recipe for success.
Then as the bank grew bigger and older, management started unlocking the value embedded in the reams of data collected by HDFC Bank in its first two decades of its existence.
One case in point is the 10 second personal loan innovation by the bank. Existing customers are given a credit score based on their transactions and payment records (behavioural score of spending habits or past repayments). This is then cascaded with the score of the credit bureau and meshed with a social score (by capturing an individual’s internet consumption patterns). After analysing data (which is continuously updated), the bank awards a credit score on the basis of an algorithm. All such customers are then ‘pre-approved’ for a specific loan amount at a certain rate. Once the customer confirms the loan requirement with a click, it gets disbursed immediately. In 2022, the personal loans segment is ~10% of the loan book for the bank and is growing at 20%+ CAGR. Now HDFC Bank has embarked on a new challenge to fund even ‘New to Bank’ customers using algorithm-based digital end to end solutions.
It is the gradual buildup of strong systems and processes over the years, and the reinvestment of profits into these key aspects of the business that has helped HDFC Bank to race well-ahead of its peers. This in turn has been reflected in consistently high RoEs over the years and higher incremental market share gains; as we had mentioned in our July 2022 newsletter, The Never Ending Generosity of the Public Sector – Over FY12-22, HDFC Bank’s incremental market share in advances as well as deposits has been the highest amongst its peers – 15.8% (for advances) and 12.1% (for deposits).
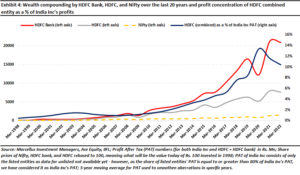
In fact, even if we look at just the last decade, HDFC Bank’s PAT as a percentage of total Indian corporate sector’s PAT risen from 1.5% in FY12 to 3.4% in FY22. Once HDFC Ltd merges with HDFC Bank next year, the combined entity will account for an astonishing 5% of India Inc’s PAT.
Therefore, a trifecta of higher reinvestments in intangibles (systems & processes, databases, algorithms), resultant higher RoEs, and higher incremental market share gains has helped HDFC Bank compound wealth for its shareholders at 25% p.a. for the last 23 years! To put this in context, the BSE 500 index in the same time period has compounded at just 13% p.a.
Nandita Rajhansa and Saurabh Mukherjea work for Marcellus Investment Managers (www.marcellus.in). Saurabh and Nandita’s families, Saurabh personally and Marcellus’ clients are shareholders in Tata Consultancy Services, Dr. Lal’s PathLabs, and HDFC Bank.
APPENDIX
Table 1: The companies driving 80% of the wealth creation in the Nifty in the decade ending 31st March 2012
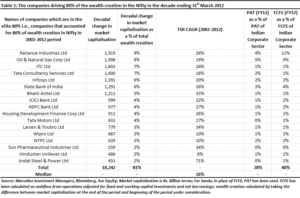
Source: Marcellus Investment Managers, Bloomberg, Ace Equity; Market capitalization is Rs. Billion terms; For banks, in place of FCFE, PAT has been used. FCFE has been calculated as cashflow from operations adjusted for fixed and working capital investments and net borrowings; wealth creation calculated by taking the difference between market capitalization at the end of the period and beginning of the period under consideration.
Table 2: The companies driving 80% of the wealth creation in the Nifty in the decade ending 31st March 2022
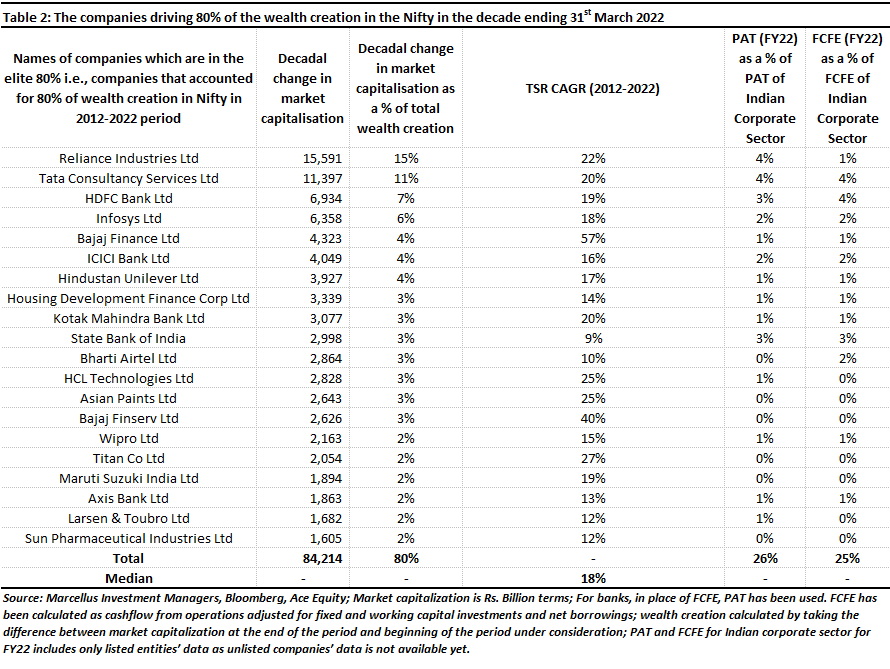
Source: Marcellus Investment Managers, Bloomberg, Ace Equity; Market capitalization is Rs. Billion terms; For banks, in place of FCFE, PAT has been used. FCFE has been calculated as cashflow from operations adjusted for fixed and working capital investments and net borrowings; wealth creation calculated by taking the difference between market capitalization at the end of the period and beginning of the period under consideration; PAT and FCFE for Indian corporate sector for FY22 includes only listed entities’ data as unlisted companies’ data is not available yet.
Table 3: Top PAT generators in FY12 and FY22 – PAT as a percentage of total PAT of India Inc. and their decadal TSR CAGR
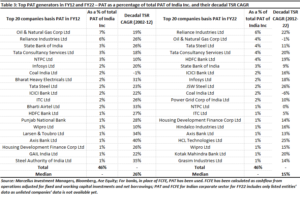
Source: Marcellus Investment Managers, Bloomberg, Ace Equity; For banks, in place of FCFE, PAT has been used. FCFE has been calculated as cashflow from operations adjusted for fixed and working capital investments and net borrowings; PAT and FCFE for Indian corporate sector for FY22 includes only listed entities’ data as unlisted companies’ data is not available yet.
Table 4: Top 20 FCFE generators in FY12 and FY22 – FCFE as a percentage of total FCFE generated by the India Inc. and their decadal TSR CAGR
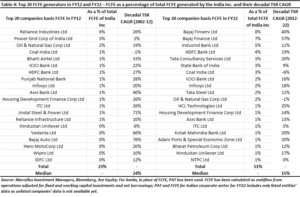
Source: Marcellus Investment Managers, Bloomberg, Ace Equity; For banks, in place of FCFE, PAT has been used. FCFE has been calculated as cashflow from operations adjusted for fixed and working capital investments and net borrowings; PAT and FCFE for Indian corporate sector for FY22 includes only listed entities’ data as unlisted companies’ data is not available yet.
Note: the above material is neither investment research, nor investment advice. Marcellus does not seek payment for or business from this material/email in any shape or form. Marcellus Investment Managers Private Limited (“Marcellus”) is regulated by the Securities and Exchange Board of India (“SEBI”) as a provider of Portfolio Management Services. Marcellus is also a US Securities & Exchange Commission (“US SEC”) registered Investment Advisor. No content of this publication including the performance related information is verified by SEBI or US SEC. If any recipient or reader of this material is based outside India and USA, please note that Marcellus may not be regulated in such jurisdiction and this material is not a solicitation to use Marcellus’s services. All recipients of this material must before dealing and or transacting in any of the products and services referred to in this material must make their own investigation, seek appropriate professional advice. This communication is confidential and privileged and is directed to and for the use of the addressee only. The recipient, if not the addressee, should not use this material if erroneously received, and access and use of this material in any manner by anyone other than the addressee is unauthorized. If you are not the intended recipient, please notify the sender by return email and immediately destroy all copies of this message and any attachments and delete it from your computer system, permanently. No liability whatsoever is assumed by Marcellus as a result of the recipient or any other person relying upon the opinion unless otherwise agreed in writing. The recipient acknowledges that Marcellus may be unable to exercise control or ensure or guarantee the integrity of the text of the material/email message and the text is not warranted as to its completeness and accuracy. The material, names and branding of the investment style do not provide any impression or a claim that these products/strategies achieve the respective objectives. Further, past performance is not indicative of future results. Marcellus and/or its associates, the authors of this material (including their relatives) may have financial interest by way of investments in the companies covered in this material. Marcellus does not receive compensation from the companies for their coverage in this material. Marcellus does not provide any market making service to any company covered in this material. In the past 12 months, Marcellus and its associates have never i) managed or co-managed any public offering of securities; ii) have not offered investment banking or merchant banking or brokerage services; or iii) have received any compensation or other benefits from the company or third party in connection with this coverage. Authors of this material have never served the companies in a capacity of a director, officer, or an employee.