A review of the last four years of CCP returns highlights the consistency of performance across investee companies – almost all constituent stocks have compounded their share prices at 15-30% annually demonstrating that stock selection contributed significantly to portfolio returns. Additionally, portfolio management tools such as the Longevity Framework and Margin of Safety & Sustainability (MOSS) have added extra layers of portfolio performance and risk reduction through position sizing and rebalancing. We continue to focus on deepening our research processes and sharpen our portfolio management tools to increase the value add to our clients in future.
Performance update – as on 30th November 2022
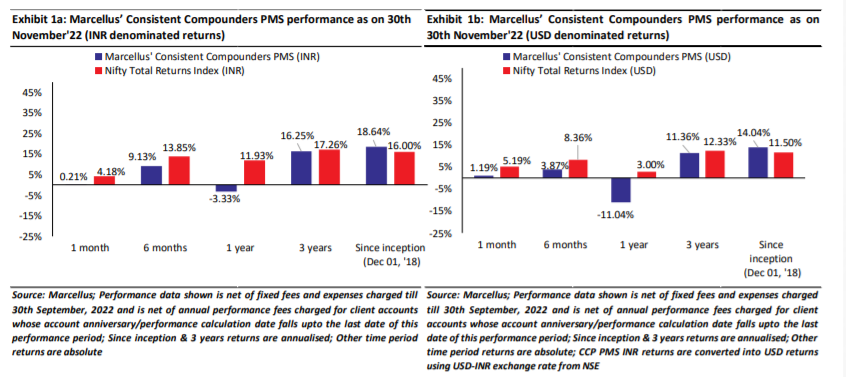
We have a coverage universe of around 25 stocks, which have historically delivered a high degree of consistency in ROCE and revenue growth rates. Our research team focuses on understanding the reasons why these companies have delivered healthy and consistent historical track record and which of these companies are likely to sustain their superior financial performance in future. Based on this understanding, we construct a concentrated portfolio of companies with an intended average holding period of stocks of 8-10 years or longer. The latest performance of our PMS portfolio is shown in the charts below.
Attribution analysis of 18.6% CAGR returns since inception
On 30th Nov 2022, Marcellus’ Consistent Compounders Portfolio (CCP) completed four years. The portfolio has generated a cumulative return of 98.2% or 18.6% CAGR over the last four years.
Attribution analysis weighted by allocations (i.e. position sizing) and by time period of investment is highlighted in the exhibit below.
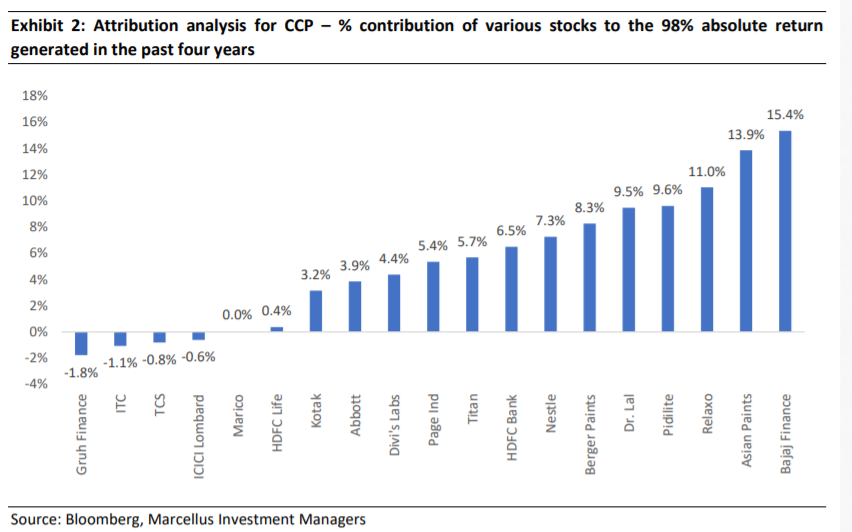
The attribution bar-chart above has a steep gradient of bars i.e. individual stock contributions to the overall performance have varied significantly across the portfolio. Whilst the absolute return generated by the stock is one of the factors driving the gradient in this chart, there are two other factors beyond just stock returns which drive attribution of returns to specific stocks in the portfolio:
Position sizing (allocation) of the stock in the portfolio skews the height of the bar:
Stocks such as Bajaj Finance and Asian Paints, which have been two of the biggest allocations in the portfolio, have the tallest bars in the attribution chart above.
Duration for which the stock was held in the portfolio skews the height of the bar:
Marcellus’ CCP is a low churn portfolio. Most stocks have been in the portfolio throughout the last 4 years – such stocks have tall positive bars in the attribution chart above. Stocks with the shortest bars (including those with negative attribution) such as Gruh Finance, ICICI Lombard, HDFC Life, TCS etc have all been in the portfolio for less than 12-18 months – either because they are recent additions or because they were exited from the portfolio soon after CCP’s inception.
However, the share price returns of investee companies do NOT have a steep gradient over 4 years – almost all CCP companies delivered between 15% and 30% share price CAGR over the last 4 years.
Last four-years’ total returns CAGR for all the portfolio stocks ever held in Marcellus’ CCP are shown in exhibit 2 below.
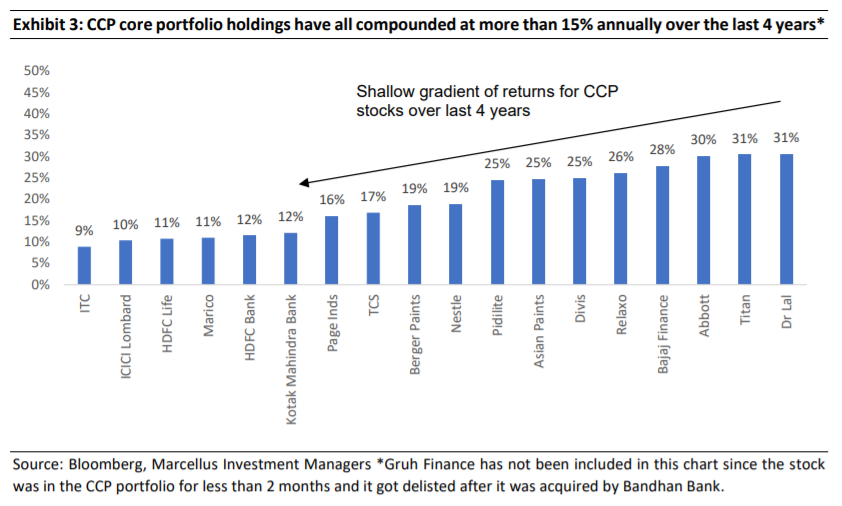
Most stocks have delivered 15%+ total returns CAGR over the last four years. Hence, there are three key conclusions worth drawing from the chart above, around which our bottom-up research framework (summarised later in this newsletter in exhibit 7) adds value to our clients:
- Since the performance of all constituent stocks is broad-based, stock selection has added more value to the CCP portfolio than position sizing.
- Since fundamentals (revenues, earnings and free cash flows) of all CCP constituents consistently compound at a healthy rate (15-30% CAGR over the last four years), share prices of these stocks have also consistently compounded at a healthy rate of 15-30% CAGR over these four years.
- Position sizing within the portfolio plays a role in significantly reducing the risks embedded in the portfolio – measured by our proprietary Longevity Framework.
The shallow gradient of total returns across stocks over four years hides a phenomenon that prevails over shorter time horizons. This phenomenon offers us an opportunity to add extra layers of performance to the overall portfolio. We now focus on explaining this phenomenon in more detail.
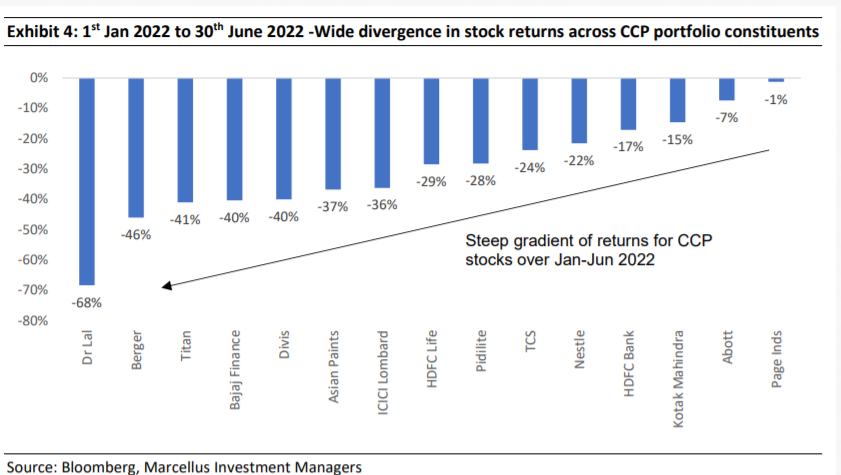
Share price dislocations emerge over shorter time horizons
Even though share price returns of most CCP stocks are similar to each other over longer time horizons, there
are several instances of significantly divergent returns of stocks over the short term – say a six-month period.
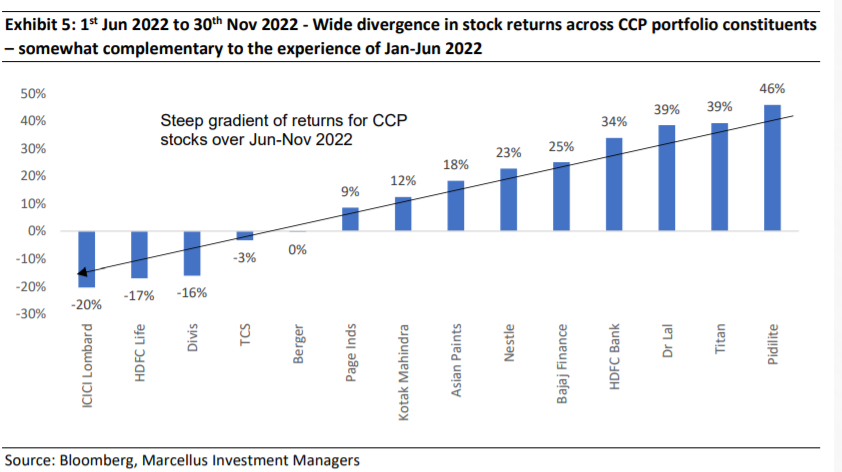
For instance, during calendar year 2022 so far, there has been a very wide spread of share price returns across CCP portfolio constituents both during the first half as well as the second half of the year – see exhibits below.
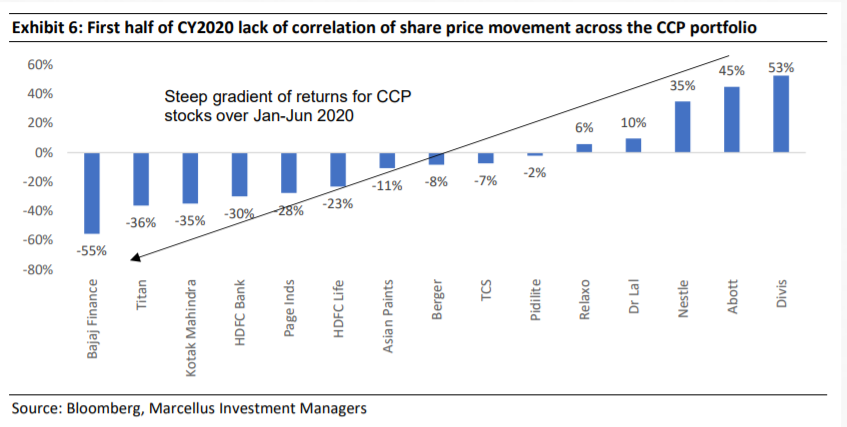
Similarly, during the stock market crash of March-April 2020 when the Covid-19 crisis started, there emerged a significant dislocation in the share prices of certain stocks in the CCP portfolio compared to the rest of the portfolio constituents – see exhibit 6 below. These dislocations give us an opportunity to use our portfolio management tools – namely, the Longevity Framework and MOSS – and thereby capitalise on the fact that the stockmarket has erroneously significantly mispriced a great company.
Investment implications – evolution of fund management tools in Marcellus’ CCP
Much like we expect our portfolio companies to evolve and strengthen their capabilities progressively, Marcellus’ investments team has also endeavoured to do so over last four years of its existence. This evolution includes tools such as our Longevity Framework for bottom-up research and Margin of Safety & Sustainability (MOSS) based position sizing and rebalancing tools.
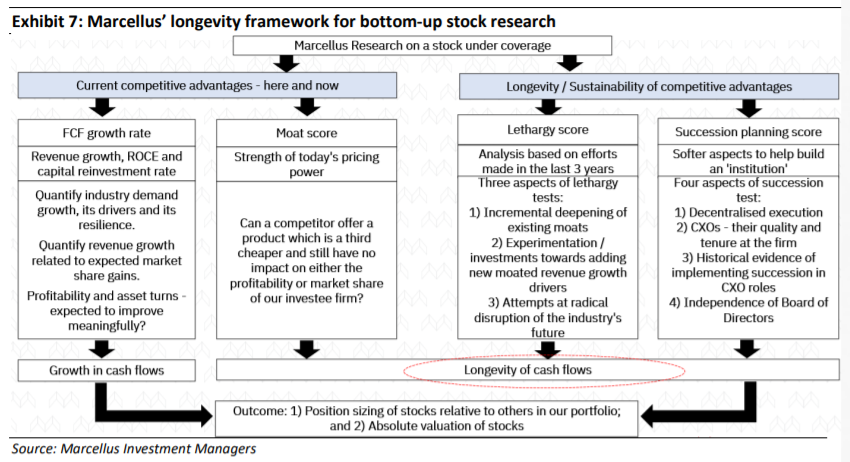
The introduction of Longevity framework two years ago for streamlining our bottom-up research process was a significant initial step in this direction. Our research’s core tenet rests on correctly ascertaining the longevity of free cash flow compounding for quality franchises – something that the market tends to misprice (as discussed in our Jan’20 newsletter). The longevity framework aims to do so by quantifying a company’s potential by scoring it both on current competitive advantages (via Moat score) as well as sustenance of such advantages over long term (via Lethargy score and Succession Planning score). Details on how the Lethargy framework and the Succession Planning frameworks work can be found in our Aug’20 and Sep’20 newsletters.
The position sizing of stocks in CCP portfolio is carried out using our Margin of Safety and Sustainability (MOSS) framework which quantifies the gap between the intrinsic value and current share price of a stock
using the inputs of our Longevity Framework. This approach aims to reduce the portfolio’s risk arising from succession planning, capital allocation around new growth drivers and/or disruption of industry. The franchises that score the highest on the Longevity Framework (indicating lowest risk) get the highest portfolio allocation while the franchises that score lower get a lower allocation.
That being said, the stock prices of even the highest quality franchisestend to go through short term gyrations as a result of a prevailing short term narrative (eg. the spring 2020 narrative that Covid-19 will damage the Bajaj Finance franchise) or extrapolation of short-term weakness in business (eg. the market’s reaction to the Covid-19 drug Molnupiravir becoming less relevant for Divis). Resultantly, we have observed wide dissonance (or low correlation) amongst our portfolio holdings over specific 6-month periods – as shown in Exhibits 4-6 above – even though over a longer period of four years the returns are clustered in a tight band (as shown in Exhibit 3).
Such short-term dislocations (and the extent of it) are near impossible to predict beforehand. However, they do provide excellent opportunities to rebalance our exposure to such dislocated stocks. For instance, it is worth noticing that in Exhibit 4 (i.e. Jan-Jun 2022) stocks such as Dr. Lal Pathlabs, Titan and Bajaj Finance were amongst the worst performers in CCP. However, in exhibit 5 (i.e. Jun-Nov 2022), these three stocks were amongst the best performers in CCP. Our MOSS (Margin of Safety and Sustainability) framework aims to benefit from such dislocations through rebalancing stock-specific allocations in the portfolio.
In 2022, as the share prices of stocks like Divis Labs (Oct ’21 – Nov ‘22) and Dr. Lal Pathlabs (Sept ’21 – June ‘22) saw a significant correction, we dug deeper to review our understanding of their fundamental strengths and subsequently increased the position size of these stocks significantly in our clients’ portfolios.
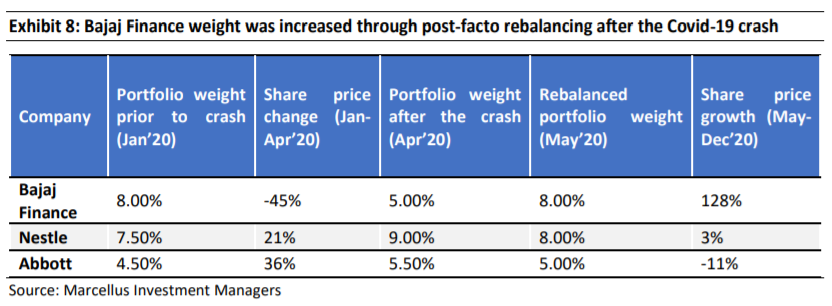
Similarly, when Bajaj Finance’s stock price almost halved between Jan’20-Apr’20 leading to a decline in its portfolio weight, we rebalanced the portfolio by increasing the weight of the stock (see exhibit below). By Dec’20 the stock had recovered nicely and delivered 128% returns with overall portfolio benefiting immensely from the higher weight.
As we look forward to continuing to compound our clients’ monies, we thank our clients for reposing their faith in us over the past four year

