OVERVIEW
POPULAR ARTICLES

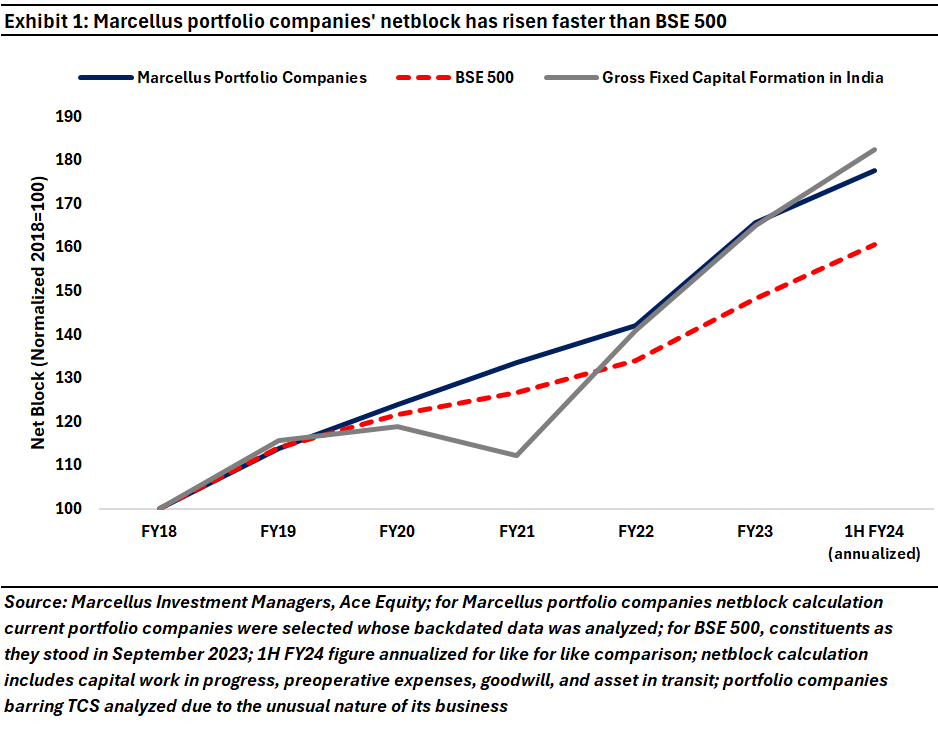
Whilst public sector capex has grown steadily in India between FY19 and FY23 (14% CAGR in nominal terms), the same is NOT true for private sector capex (7% CAGR in nominal terms). In such a scenario, Marcellus’ portfolio companies have grown capex (i.e., net block) significantly faster than the capex growth in the BSE500 – see chart below. History shows that net block growth for Marcellus’ portfolio firms is a precursor to rapid earnings growth which in turn feeds into superior share price compounding.
“The ideal business is one that earns very high returns on capital and that keeps using lots of capital at those high returns. That becomes a compounding machine” – Warren Buffet as quoted in ‘The Snowball: Warren Buffett and the Business of Life’
India’s capex story has been driven by the Government
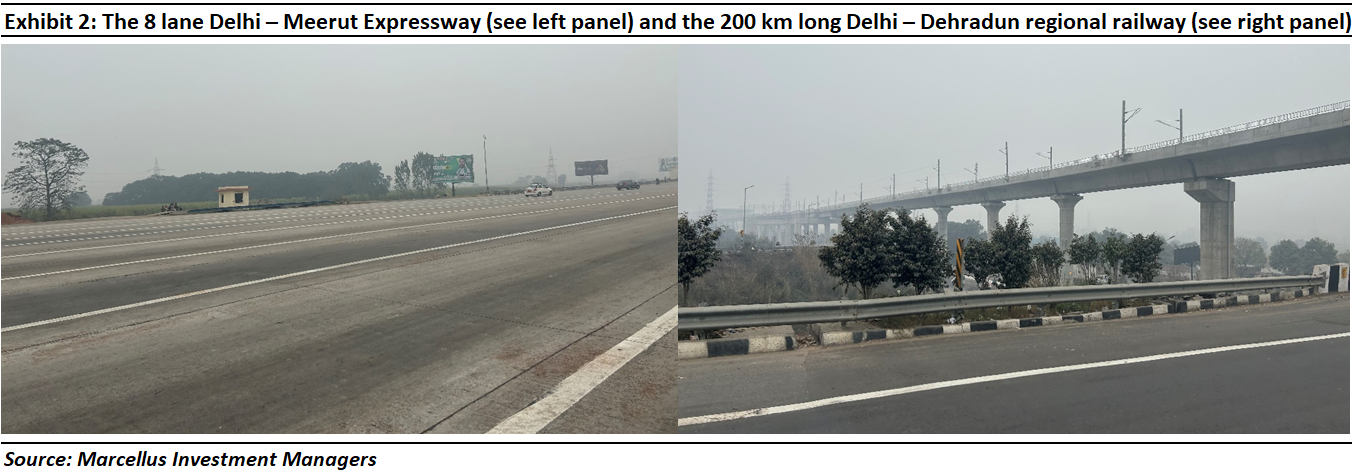
Some of our senior colleagues have been travelling around India for several decades now. For example, Saurabh has been travelling down the Delhi – Dehradun belt for four decades now. His last journey on this route was exactly 10 years ago. However, earlier in January when Saurabh travelled from Noida to Meerut and then onwards to Bijnor, Haridwar and, finally, Dehradun, he was stunned by the massive scale at which public sector capex has taken place in UP and Uttarakhand over the past few years. Saurabh saw hundreds of kilometers of expressways, highways, long distance metro lines being built. He saw that Dehradun airport is now bigger than the airports in smaller American state capitals like Des Moine and Kansas City. He saw Jewar Airport coming up in Noida and he was told that more fast trains (Shatabdi’s and Vande Bharat’s) are now running on the Delhi – Dehradun belt than has ever been the case before.
The public infra build on the Delhi – Dehradun belt is now the norm, not the exception, in India. Eight- and sixteen-lane highways are being built across the land, reducing travel times to a quarter of what it used to take previously. In a similar vein, critical river and sea bridges are being built as well. The Atal Bihari Vajpayee Mumbai Trans Harbor Link Road – India’s longest coastal bridge – is the latest development on this front (see more here).
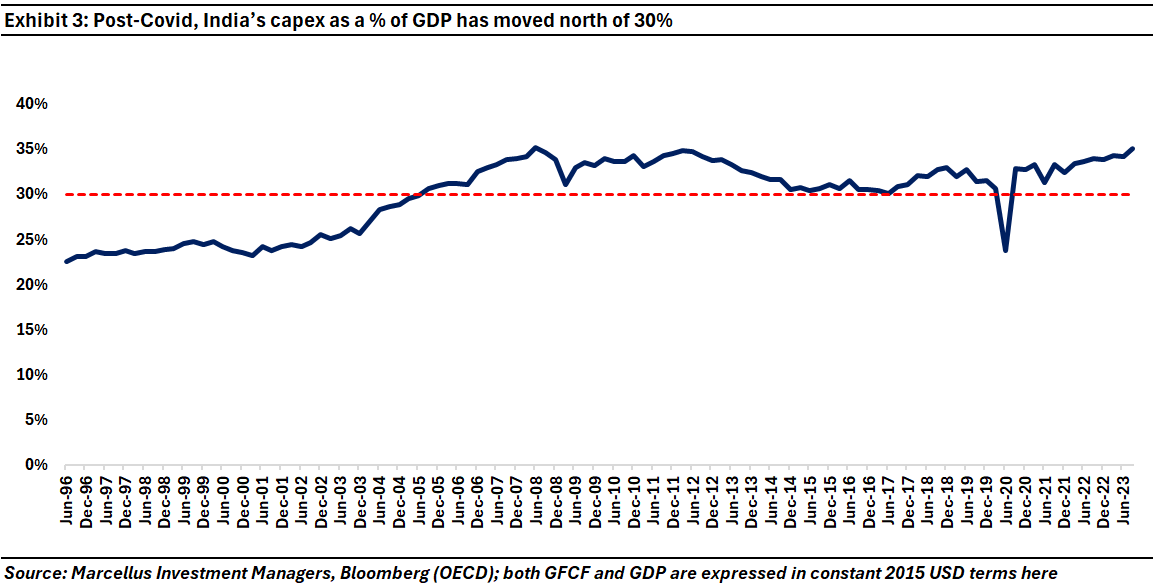
This anecdotal evidence from our travels throughout the country is also evident in hard, empirical data. If we look at India’s Gross Fixed Capital Formation (GFCF) data, it has hovered around the 30% of GDP mark for the last 5-7 years (see exhibit below) implying that India is amongst the only 2 or 3 countries in the world consistently clocking in excess of $1 trillion per annum of capex (the other two countries being USA and China). Another way to appreciate the impressive scale on which capex is taking place in India is to look at GFCF growth in the country since Covid – YoY growth of GFCF post-Covid has been upwards of high teens in (see table below).
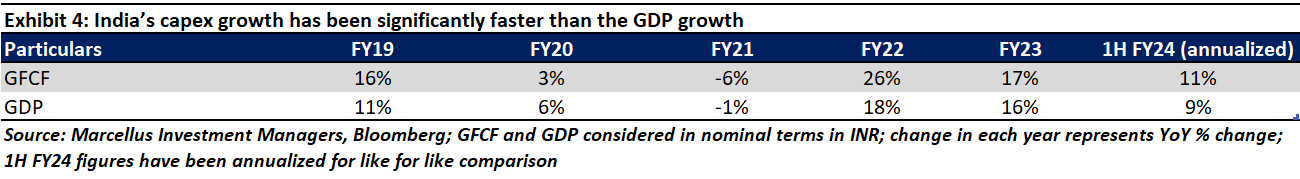
Whilst government capex has grown at a 14% CAGR in nominal terms over FY19-23, growth in private sector capex has been lackluster, growing at just 7% CAGR in nominal terms over the same period.
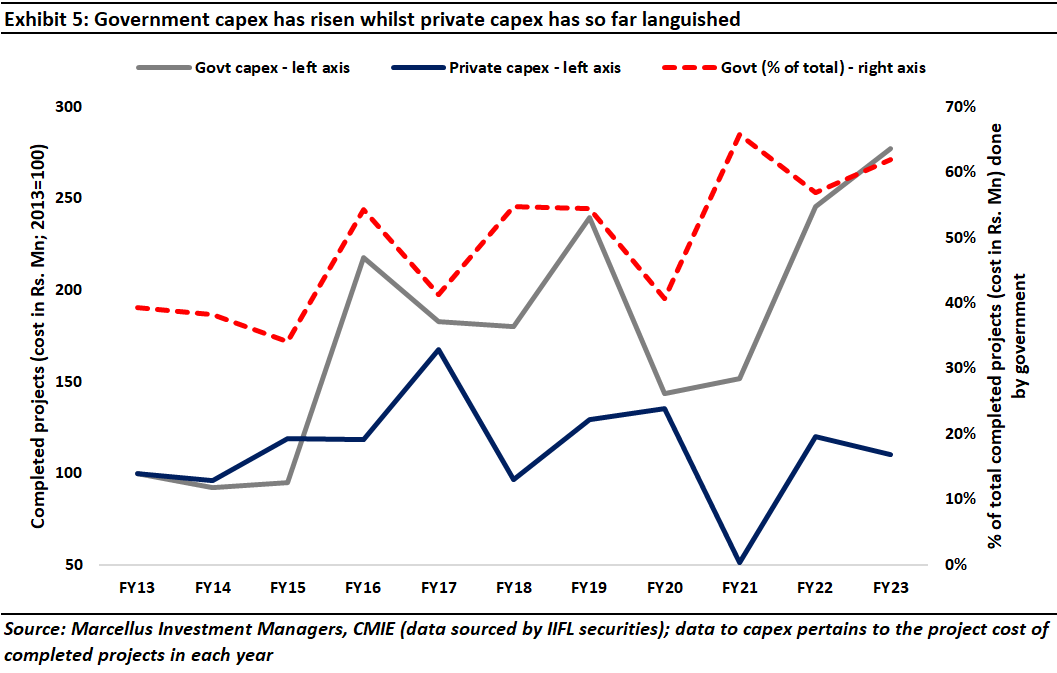
In the midst of this surge in government capex, a few private sector companies have upped the ante in terms of reinvesting their profits to grow their factories and their businesses. Marcellus’ investee companies have been at the vanguard of the handful of private sector companies rapidly growing their installed capacity.
Marcellus’ portfolio companies are at the forefront of private capex in India
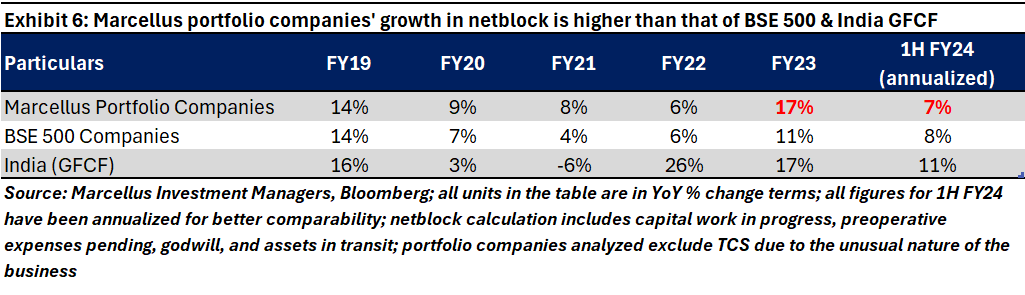
We assessed the growth in the net block (i.e., the balance sheet line item that measures assets built by the company adjusted for the depreciation that has taken place in the value of that asset) of all our portfolio companies and then did the same for the BSE 500 companies. We excluded Financial Services companies from both datasets as ‘net block’ (and capex) is not the correct way to measure the growth in the productive capacity of Financial Services companies.
We then compared the growth in the net block of our investee companies with the country’s capex growth (in nominal terms i.e., including inflation) over the last five years. We found that:
- Our portfolio companies have grown capex significantly faster than both the BSE 500 and the broader Indian economy;
- Our portfolio companies’ capex surge has further accelerated relative to the BSE 500 over the past couple of years; and
- BSE 500 has grown capex slower than the broader economy over the past couple of years. [Remember, Financial Services firms are excluded from this analysis. So, they cannot be the constituency responsible for the slow growth in BSE 500 capex.]
Why should you care that the Marcellus investee firms have hit the capex accelerator?
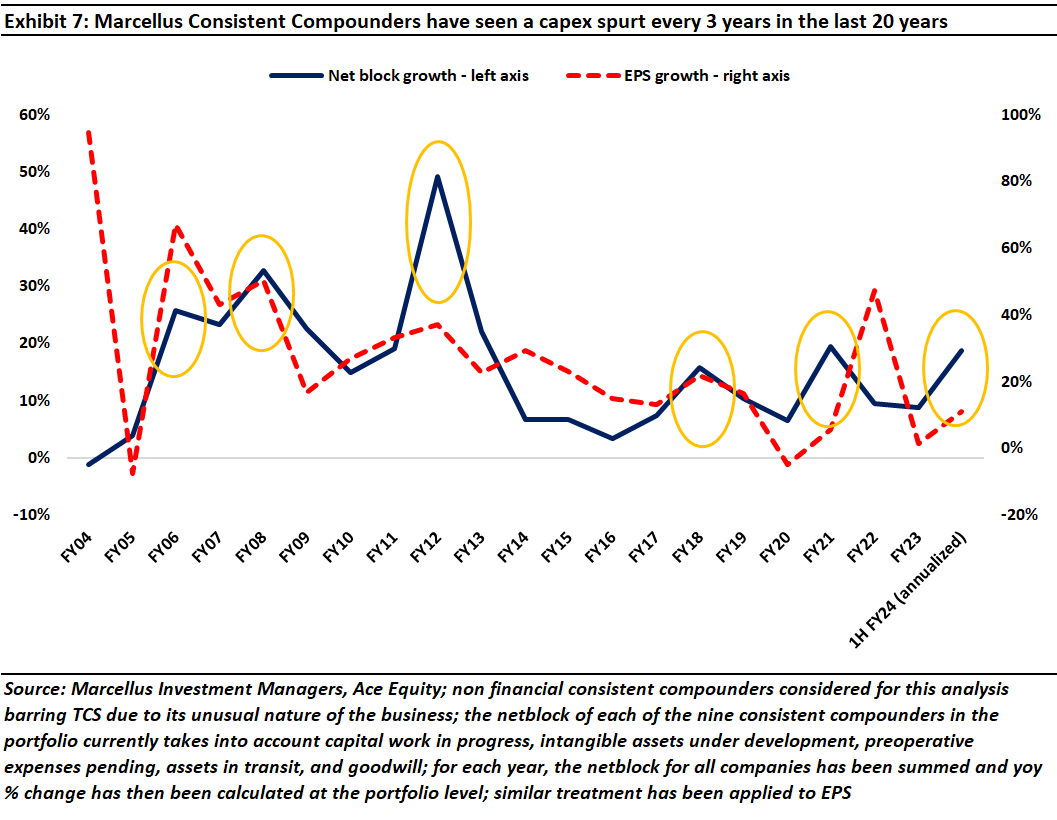
This surge in capex is the sixth instance in the last 20 years that our Consistent Compounder Portfolio companies have pushed the accelerator pedal on capex (see the YELLOW ovals in the chart below). As you can see in the chart, each surge in capex has been followed by a surge in EPS growth (i.e., profit growth) for our investee firms.
Broadly speaking, our investee companies accumulate their profits for three years and then every third year they invest those accumulated profits in ramping up the scale of the operations. Those investments then bear fruit in terms of accelerated profit growth in the next few years. As a result, over the past 20 years, our Consistent Compounder investee firms have grown EPS at 26% CAGR. In contrast, the Indian economy’s nominal GDP growth over the past two decades has averaged 12%.
So, which are the Marcellus investee companies at the forefront of this capex surge?
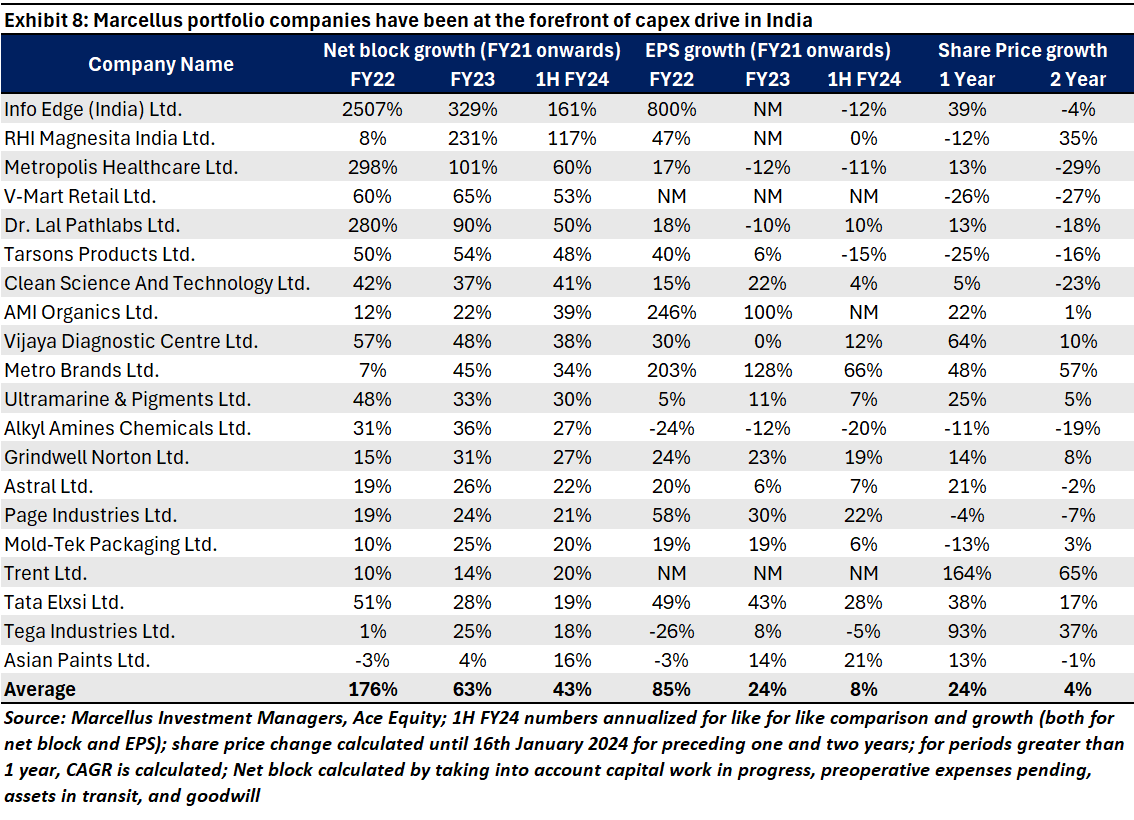
Out of the 41 non-Financial Services stocks that we own across our portfolios, here are the 15 companies whose net block has risen the sharpest [in % CAGR terms] between FY21-end to H1 FY24-end (see exhibit below). Note that the surge in net block includes acquisitions – e.g., Dr Lal’s acquisition of Suburban Diagnostics in December 2021 shows up in the 280% surge in Dr Lal’s net block in FY22. Similarly, RHI Magnesita’s acquisition of the refractory business of Dalmia Bharat Refractories Ltd in January 2023 shows up in 231% jump in RHI’s net block in FY23.
Implications for the investors
From the above exhibit we can see that:
- Whilst Marcellus’ investee companies have in totality grown their net block at a faster rate than the BSE 500 (as can be seen in Exhibit 6), the most aggressive of our investee companies are growing their productive capacity in excess in 50% p.a. implying that their productive capacity has more than doubled over the past couple of years (see the ‘net block growth’ columns in the preceding exhibit).
- Over the past couple of years, profits of the Marcellus investee companies have NOT grown as fast the growth in their productive capacity – see the EPS growth columns of the preceding exhibit. This is to be expected as the growth in productive capacity feeds through into profit growth with a lag.
- The share prices of Marcellus investee companies whose net block has grown the fastest in the past couple of years have stagnated over the past couple of years (see the last column of Exhibit 8). Our view is that that this creates a straightforward opportunity for patient investors who want to benefit from the capex surge that we are seeing in the strong balance sheets of Marcellus’ investee companies.
The exhibit below, shows the net block growth for each of Marcellus’ portfolios:
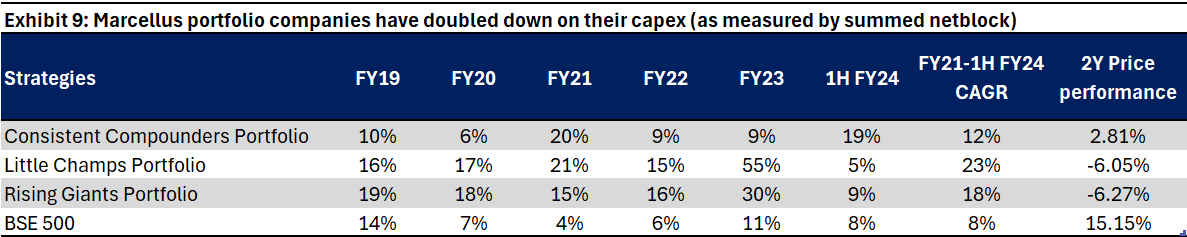
Source: Marcellus Investment Managers, Ace Equity; all netblock % are YoY % changes; 1H FY24 figure has been annualized for like for like comparison; TCS has been excluded from analysis as ‘capex’ isn’t relevant for the company; netblock calculation includes capital work in progress, preoperative expenses pending, goodwill, and asset in transit; Performance data is net of fixed fees and expenses charged on a quarterly basis, effect of the same has been incorporated up to 31st December 2023; Performance data is not verified either by the Securities and Exchange Board of India or U.S. Securities and Exchange Commission; For relative performance of particular Investment Approach to other Portfolio Managers within the selected strategy, please refer https://www.apmiindia.org/
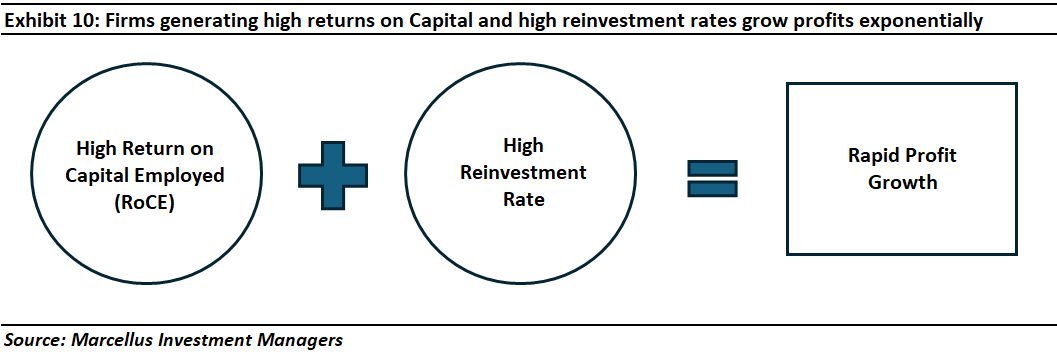
Why are Marcellus’ portfolio companies able to grow capex so much faster than the BSE500?
There are two simple reasons why Marcellus’ investee companies grow their capex and their earnings significantly faster than the broader market over medium-long run time horizons. Firstly, our investee firms have much higher Return on Capital than the broader market (around 25-35% vs around 15% for the broader market). High ROCEs imply that our investee have more surplus capital to deploy than the broader market.
Secondly, our investee firms reinvest (back into their business) 60-90% of the profits that they generate. Our 9th May 2023 CCP newsletter (https://marcellus.in/
We have described in several of our previous blogs how India’s infrastructure build has revolutionized business life over the last decade (read our blog dated May 2022 for more on this: India’s Moment After a Decade of Structural Reforms). What the smart promoters running our investee firms have been able to do though is capitalize on these changes and in turn benefit from the higher economies of scale that these changes have to offer. Our work at Marcellus revolves around identifying such management teams who are cleverly (and cleanly) running their companies to benefit from India’s growth and progress.
Nandita Rajhansa and Saurabh Mukherjea work for Marcellus Investment Managers (www.marcellus.in). Amongst the companies mentioned in this note, Info Edge, RHI Magnesita, Metropolis Healthcare, V-Mart Retail, Dr. Lal PathLabs, Tarsons Products, Clean Science and Technology, Ami Organics, Vijaya Diagnostics Centre, Metro Brands, Ultramarine and Pigments, Alkyl Amines, Grindwell Norton, Astral, Page Industries, Mold-Tek Packaging, Trent, Tata Elxsi, Tega Industries, Asian Paints, and Tata Consultancy Services are part of Marcellus’ various portfolios. Nandita and Saurabh may be invested in these companies and their immediate relatives may also have stakes in the described securities. The described stocks/securities are for educational/illustration purpose only and not recommendatory.
Disclaimer:
If you want to read our other published material, please visit https://marcellus.in/pms-investment-blog/
Note: the above material is neither investment research, nor investment advice. Marcellus does not seek payment for or business from this material/email in any shape or form. Marcellus Investment Managers Private Limited (“Marcellus”) is regulated by the Securities and Exchange Board of India (“SEBI”) as a provider of Portfolio Management Services. Marcellus is also a US Securities & Exchange Commission (“US SEC”) registered Investment Advisor. No content of this publication including the performance related information is verified by SEBI or US SEC. If any recipient or reader of this material is based outside India and USA, please note that Marcellus may not be regulated in such jurisdiction and this material is not a solicitation to use Marcellus’s services. This communication is confidential and privileged and is directed to and for the use of the addressee only. The recipient, if not the addressee, should not use this material if erroneously received, and access and use of this material in any manner by anyone other than the addressee is unauthorized. If you are not the intended recipient, please notify the sender by return email and immediately destroy all copies of this message and any attachments and delete it from your computer system, permanently. No liability whatsoever is assumed by Marcellus as a result of the recipient or any other person relying upon the opinion unless otherwise agreed in writing. The recipient acknowledges that Marcellus may be unable to exercise control or ensure or guarantee the integrity of the text of the material/email message and the text is not warranted as to its completeness and accuracy. The material, names and branding of the investment style do not provide any impression or a claim that these products/strategies achieve the respective objectives. Further, past performance is not indicative of future results. Marcellus and/or its associates, the authors of this material (including their relatives) may have financial interest by way of investments in the companies covered in this material. Marcellus does not receive compensation from the companies for their coverage in this material. Marcellus does not provide any market making service to any company covered in this material. In the past 12 months, Marcellus and its associates have never i) managed or co-managed any public offering of securities; ii) have not offered investment banking or merchant banking or brokerage services; or iii) have received any compensation or other benefits from the company or third party in connection with this coverage. Authors of this material have never served the companies in a capacity of a director, officer or an employee.
This material may contain confidential or proprietary information and user shall take prior written consent from Marcellus before any reproduction in any form.