OVERVIEW
POPULAR ARTICLES

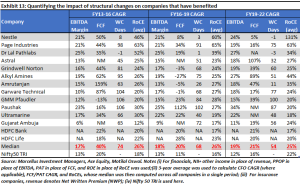
Between 1870 to 1940, America became the world’s most industrialised economy. During this period, with the emergence of railroads, the telegraph, cars and roads, the American economy was ‘networked’. This joining up of America helped efficient, well capitalised companies with competitive advantages to consolidate entire industries. After a decade of pathbreaking structural reforms, India is going through a similar phase. Massive improvements in transport & communication networks, in the banking system, in the tax regime and in the way social security benefits are dispensed have allowed enterprising companies to capitalise on these changes and create mouth-wateringly valuable franchises.
| India’s rise today echoes America’s ascent
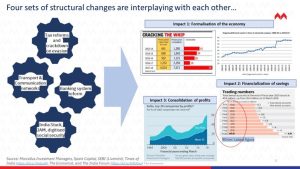
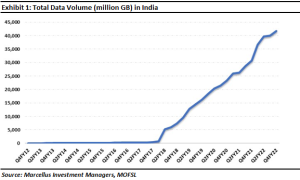
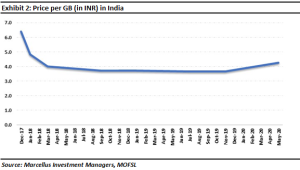
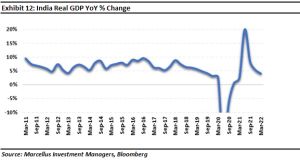
“The year 1870 represented modern America at dawn. Over the subsequent six decades, every aspect of life experienced a revolution. By 1929, urban America was electrified and almost every urban dwelling was networked, connected to the outside world with electricity, natural gas, telephone, clean running water, and sewers….More than 80 percent of urban homes in 1940 had interior flush toilets, 73 percent had gas for heating and cooking…In short, the 1870 houses were isolated from the rest of the world, but 1940 houses were ‘networked’, most having the five connections of electricity, gas, telephone, water and sewer…Networking inherently implies equality. Everyone, rich and poor, is plugged into the same electric, water, sewer, gas and telephone network.” – Robert Gordon in ‘The Rise and Fall of American Growth’ (2016). The networking on the US economy in the half a century prior to World War II transformed how business & industry functioned in that country. The emergence and completion of railroad networks by the 1880s, the advent of the telegraph at the turn of the century, the arrival of the Model-T Ford in 1908 and the creation of a tarmac road network by 1940 joined up an economy which until then was a cluster of rural and regional economies. As a result, giant American companies emerged with superior R&D capabilities and with national sales & distribution networks. These companies were increasingly funded by a booming stockmarket and the first generation of investment banks (JP Morgan, Lazard, Goldman, etc). India today is in a similar situation today as USA was between 1870-1940. The Economist, in its 14th May editorial, said “…a novel confluence of forces stands to transform India’s economy over the next decade, improving the lives of 1.4bn people and changing the balance of power in Asia…As the country emerges from the pandemic, however, a new pattern of growth is visible. It is unlike anything you have seen before…. These changes…help explain why India is forecast to be the world’s fastest-growing big economy in 2022 and why it has a chance of holding on to that title for years.” – The Economist, 14th May 2022 (source: https://www.economist.com/leaders/2022/05/13/the-indian-economy-is-being-rewired-the-opportunity-is-immense). The four structural changes which have transformed India “As the pandemic recedes, four pillars are clearly visible that will support growth in the next decade: the forging of a single national market; an expansion of industry owing to the renewable-energy shift and a move in supply chains away from China; continued pre-eminence in it; and a high-tech welfare safety-net for the hundreds of millions left behind by all this.” (source: The Economist, 14th May 2022, https://www.economist.com/briefing/2022/05/14/india-is-likely-to-be-the-worlds-fastest-growing-big-economy-this-year). So, what exactly has changed in India over the past decade for The Economist to take such an optimistic view of the country’s economic growth? We believe four distinct sets of structural changes are interplaying with each other very effectively to give contemporary India its growth story: 1. Change in Transport and Communication Networks: Not only has India’s highway network doubled over the past decade, air passengers have tripled, and freight corridors have reached 1,110 km by March 2021 (from zero a decade ago; source: Investec). Furthermore, the proportion of the population using the internet has risen from 8% to 43% from 2010 to 2020 (source: https://bit.ly/3O2lmtD) whilst the cost of using data has fallen sharply as evidenced in the following exhibits. In fact, India today uses more data than any other country in the world.
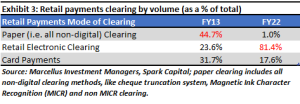
Just as importantly, over the past decade, retail payment settlements have shifted from being predominated by paper clearing to almost 100% electronic clearing – see exhibit 3 below. A critical driver of the digitisation of payments has been Unified Payments Interface (UPI). UPI, transactions have risen from ~USD 1 billion in FY16-17 to ~USD 560 billion by FY20-21. To put this in perspective, BHIM UPI (which is a free UPI app) transactions accounted for 15% of GDP in FY19-20 (source: https://bit.ly/3xKmkoq).
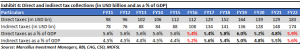
2. Tax Reforms and the Formalization of the Economy: Over the past decade India has witnessed non-stop tax reforms (both on indirect and direct tax regimes), improved enforceability, compliance and hence collections. Both, direct and indirect taxes, as a percentage of GDP, have risen materially as evidenced in the exhibit below.
|
Disclaimer:
|