The Rising Giants (RG) portfolio companies have witnessed significant acceleration in their Free Cash Flow (FCF) compounding in recent years. In terms of trend in FCF generation, the RG companies currently are where Consistent Compounder Portfolio (CCP) companies were about a decade ago. Given that the CCPs have been consistently improving their FCF conversion (i.e. FCF/ Revenues and FCF/EBITDA) over several decades, if the RG companies continue to follow suit, we expect them to produce plenty of upside for our clients. Our Longevity Framework comes in handy in assessing whether the RG companies are indeed on that path. In that regard, the decline in FCF for most of the RG companies in FY22 due to heavy reinvestments (accelerated organic and inorganic investments to exploit growth opportunities) is a positive sign as it underscores their confidence in their business prospects.
Performance update for the Rising Giants PMS
This portfolio intends to invest primarily in high quality mid-sized companies (less than Rs 75,000 crores market-capitalisation, predominantly in the Rs 7,000 crores – 75,000 crores range) with: 1) Well moated dominant franchises in niche segments; 2) A track record of prudent capital allocation with high reinvestment in the core business and continuous focus on adjacencies for growth; and 3) Clean accounts and corporate governance. From a universe of ~450 companies in this segment, a portfolio is constructed of 15-20 companies which make it past Marcellus’ proprietary forensic accounting & capital allocation filters as well as our bottom-up stock selection & position sizing frameworks.
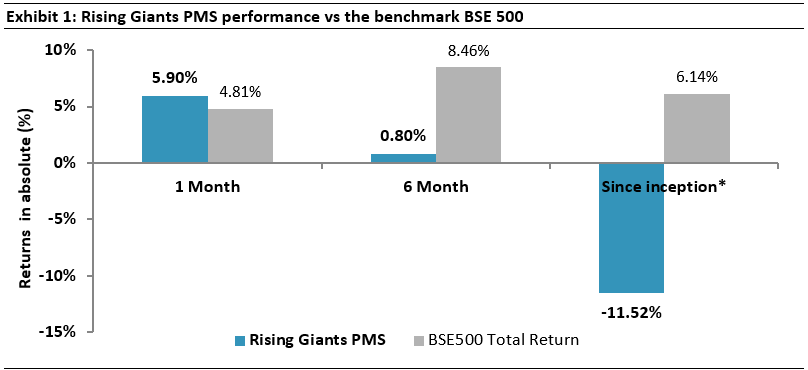
Source: Marcellus Investment Managers. Note: (i) *Portfolio inception date is December 27, 2021. (ii) Returns as of August 31, 2022. (iii) Performance data is net of annual performance fees charged for clients whose account anniversary falls upto the last date of the performance period. Since fixed fees and expenses are charged on a quarterly basis, effect of the same has been incorporated up to 30th June, 2022. (iv) Returns shown above are net of transaction costs and includes dividend income. (v) Total returns index considered for BSE500 above.
Accelerated FCF compounding is one of the key themes for the Rising Giants portfolio
Rising Giants (RG) portfolio companies have witnessed consistent acceleration in Free Cash flow (FCF) growth in recent years with median FCF growth of the portfolio rising from 5% over FY13-15 to 25% over FY16-18 and then further to 42% over FY19-21. As shown in exhibit below, even as the median EBITDA growth of the RG portfolio has remained more or less constant over the last decade, operating cash (CFO) and FCF have both witnessed significant improvements in recent years.
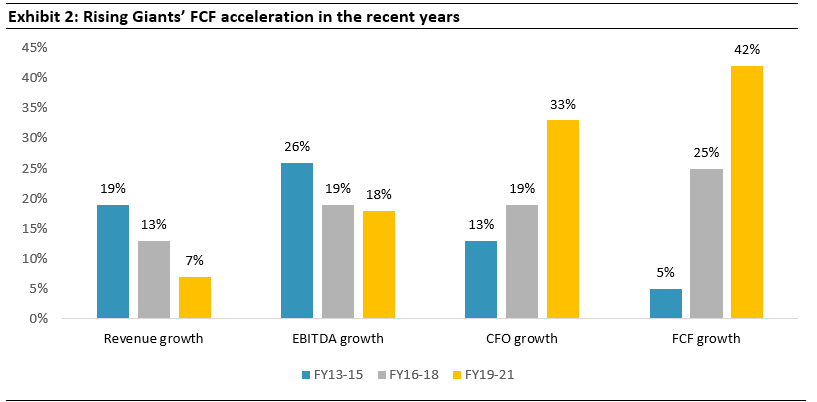
Source: Companies, Ace Equity, Marcellus Investment Managers
Note: (1) The above does not include financial services stocks in the portfolio namely – Aavas Financiers, Cholamandalam Investment, ICICI Lombard General Insurance and Info-Edge since FCF is not a relevant metric for such companies (2) L&T Tech’s business kicked off meaningfully only in FY15 after it took over business divisions of L&T and L&T Infotech and hence analysis not presented for FY13-15 period above
The key reasons for profits (i.e. EBITDA) growing faster than revenues and FCF in turn growing faster than profits are as follows:
Margin improvement: as the RG companies grow, their EBITDA margin tends to improve;
Working Capital reduction: as the RG companies grow, their working capital cycle tends to improve i.e. they pay their suppliers later and they get paid by their customers quicker; and
Continued reinvestments: The two factors listed above produce more cashflow for the RG companies as they grow and reinvestment of this cashflow then ramps up the rate of growth of FCF.
While the above drivers of FCF compounding are summarised in the exhibit below, more detailed explanation on the same can be read in our April 2022 Rising Giants newsletter.
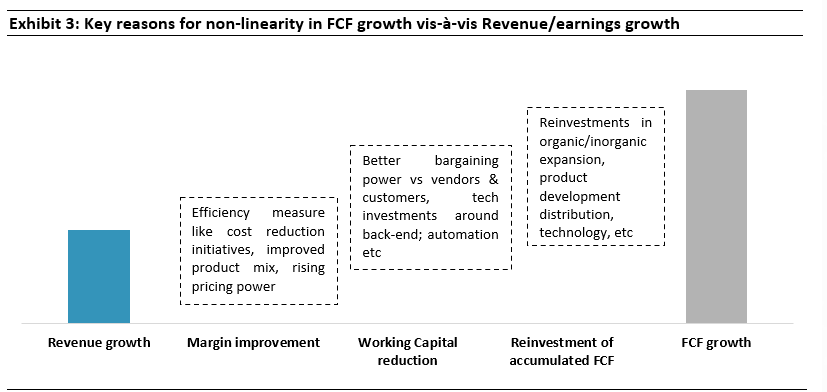
Source: Marcellus Investment Managers
Addressing questions surrounding the FCF compounding of the RG portfolio
While the FCF compounding for RG companies are on an uptrend in the recent years, we usually face two questions regarding the same:
- How long can the Rising Giants sustain FCF compounding at a healthy clip?
- Why did FCF generation reverse in FY22 for the RG companies?
We present our take on both these questions/concerns in the following sections.
Question #1: Headroom for long term FCF compounding for Rising Giants?
As explained in our January 2022 Little Champs newsletter and depicted in the chart below, there are four stages involved in the FCF cycle – Nascent, Growth, Maturity and Decline. A small set of companies with competitive advantages escape the nascent phase and enter the growth phase of FCF as they scale up their operations and operating cashflow starts outpacing the reinvestments.
The fair value (or intrinsic value) of a company is the net present value of all its expected future FCF over its life cycle. The future FCF that the Company generates over its lifecycle are in turn dependent on the length of the FCF curve (i.e. the longevity of the cash flows). The longer a Company stays in the FCF growth phase, the higher the intrinsic value generated by that Company over the longer term.
However, most companies are unable to sustain the growth phase for long periods of time and quickly slide into the maturity (peaking of FCF) and eventually the decline phase.
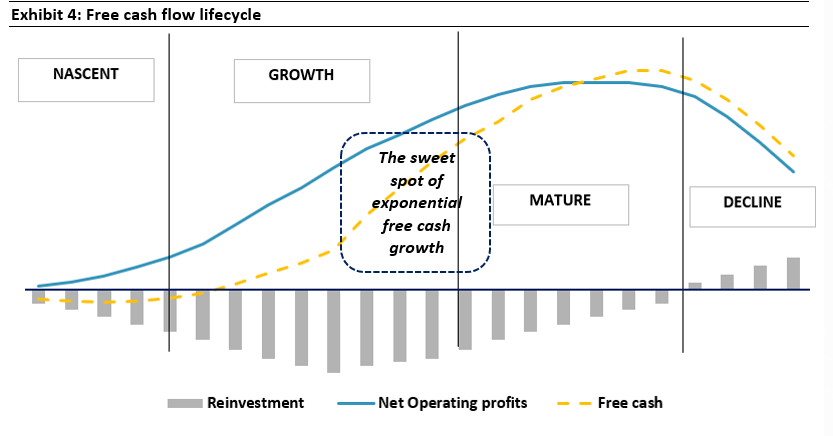
Source: Marcellus Investment Managers. Note: (i) Reinvestment above includes both working capital and fixed assets/intangible investments; (ii) Free cash is calculated as Operating profits post tax (i.e. Net Operating profits) less Reinvestment
While RG companies have indeed witnessed an acceleration in FCF in recent years, what gives us confidence regarding the sustenance of the upward trend in their free cash flows for long periods of time? How do we know that the RG companies will not follow the pattern that the vast majority of Indian companies follow of quickly sliding into plateauing and decline of FCF?
Our Consistent Compounders Portfolio (CCP) companies have shown the path of long term FCF compounding in practice and Rising Giants seem to be following that path: While sliding into mediocrity is a norm, there are exceptional set of companies that generate several decades of growth in FCF i.e. remain in the ‘sweet spot’ phase of FCF growth for decades such as the case with our Consistent Compounder portfolio companies as shown in the below exhibit.
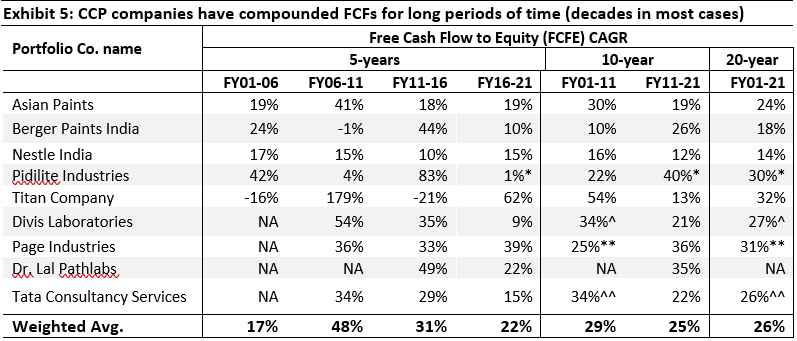
Source: Marcellus Investment Managers; Ace Equity; FCFE = Operating cash flow less Capex less Investment in Subsidiaries/Strategic investments /Acquisitions less Net debt repayments less Interest Paid less Lease liabilities; *In case of Pidilite, high capex on account of Araldite acquisition skews the CAGR % making it incomparable, hence CAGR for the period FY16-20, FY11-20 and FY01-20 is considered; ^Divis’ FCFE is for the period FY02-11 and FY02-21 since the company was not listed prior to FY01; **Page’s FCFE is for FY04-11 and FY04-21 since company was not listed prior to FY04; ^^TCS’s FCFE is for FY06-11 and FY06-21 since FCFE for FY04 and FY05 was negative; Free Cash Flow is not an appropriate metric for Banking & Financial stocks, hence BFSI names viz. HDFC Bank, Kotak Mahindra Bank, Bajaj Finance, HDFC Life and ICICI Lombard in our portfolio are not part of the above table
As explained in our December 2021 Consistent Compounders Portfolio (CCP) newsletter, some of the factors that have boosted the longevity of CCP companies’ free cash flow compounding are:
- Competitive advantages created by the company so as to generate formidable pricing power.
- Focus on operating efficiencies i.e. generating the same revenues as its competitors but with lower expenses.
- Prudent capital allocation which invests the firm’s cashflows to generate further growth in profits.
- An emphasis on high quality HR practices and succession planning.
In terms of their stage of FCF evolution, the RG companies seem to be where CCP companies were about a decade ago (as can be seen in the exhibits below both in terms of FCF conversion per unit sales and operating profit). Furthermore, CCP have continued to improve their FCF conversion. Thus, if RG companies continue to follow the CCP companies on the FCF conversion path (as they have done over the last decade), it would imply that the RG companies have many years of strong compounding ahead of them.
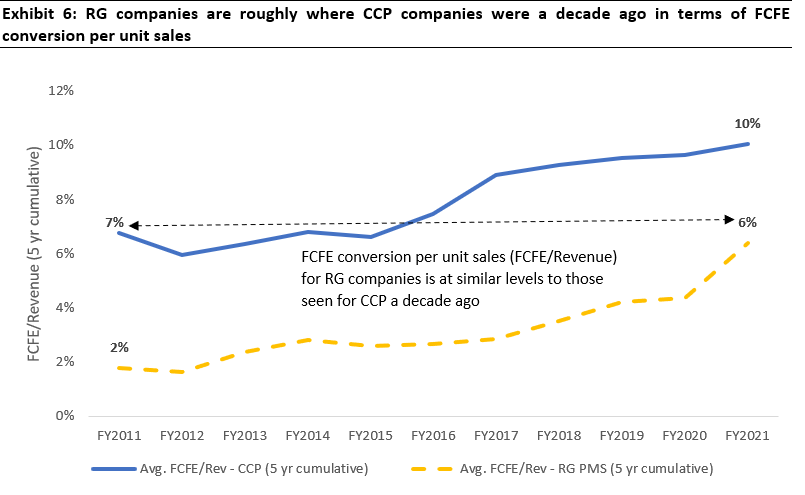
Source: Marcellus Investment Managers; Ace Equity; FCFE = Operating cash flow less Capex less Investment in Subsidiaries/Strategic investments /Acquisitions less Net debt repayments less Interest Paid less Lease liabilities; numbers above have been calculated using cumulative 5 year FCFE and cumulative 5 year revenue for current non-financial companies in the portfolios. Data for L&T Technology services starts from 2017
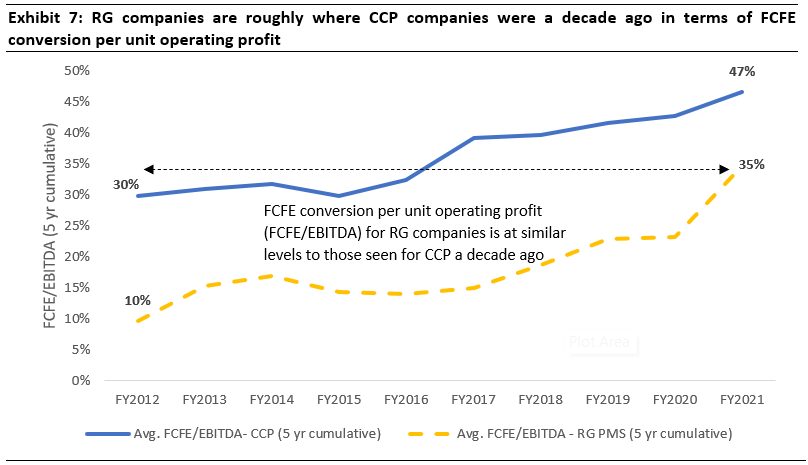
Source: Marcellus Investment Managers; Ace Equity; FCFE = Operating cash flow less Capex less Investment in Subsidiaries/Strategic investments /Acquisitions less Net debt repayments less Interest Paid less Lease liabilities; numbers above have been calculated using cumulative 5 year FCFE and cumulative 5 year EBITDA for current non-financial companies in the portfolios. Data for L&T Technology services starts from 2017
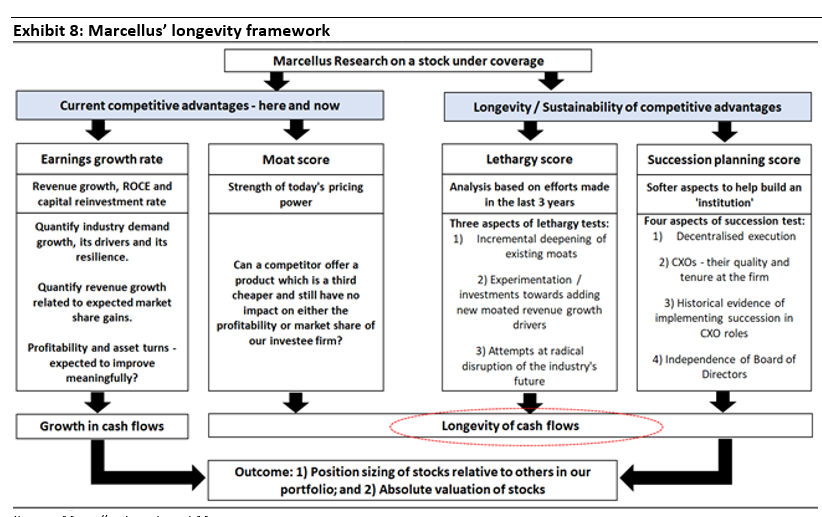
- Our Longevity Framework checks whether the Rising Giants are continuing on the path of FCF compounding: Our Longevity Framework (see exhibit below) helps us in assessing how long a company is likely to sustain healthy growth in FCF. We make this judgement call by assessing objective parameters around the firm’s competitive strengths, its capital allocation initiatives and the institutionalisation of the business. Our framework penalises companies with lethargic management teams that are letting the company be competed or disrupted away. The longevity framework forms the key basis for deciding not only whether a company makes it to/remains in the portfolio but also the inter-se position sizing amongst the portfolio companies. Thus, through this framework, we ensure that portfolio is made up of companies that are likely to witness the highest and longest FCF compounding. More details on the components of our Longevity Framework can be found towards the end of our February 2022 Rising Giants newsletter.
Source: Marcellus Investment Managers
Question #2: Why did FCF generation reverse in FY22 for the RG companies?
Free Cashflow (FCF) for the RG companies witnessed a significant decline in FY22. This was a departure from the FCF growth witnessed by most portfolio companies over FY19-21 which we have been highlighting for the RG portfolio above. The key reasons for the FCF decline are:
Increase in working capital and particularly inventory levels:The increase in inventories was because of increase in the raw material costs and stocking of both raw material as well as the finished goods inventories due to supply chain related issues. At the median level, the inventory level for the portfolio companies (excluding the Financial Services stocks and excluding LTTS, a service-oriented company) increased by 58% and on a ‘day sales’ basis from 68 days at FY21-end to 76 days at FY22-end. To our mind this is a sensible response by the RG companies to the breakdown in global supply chains.
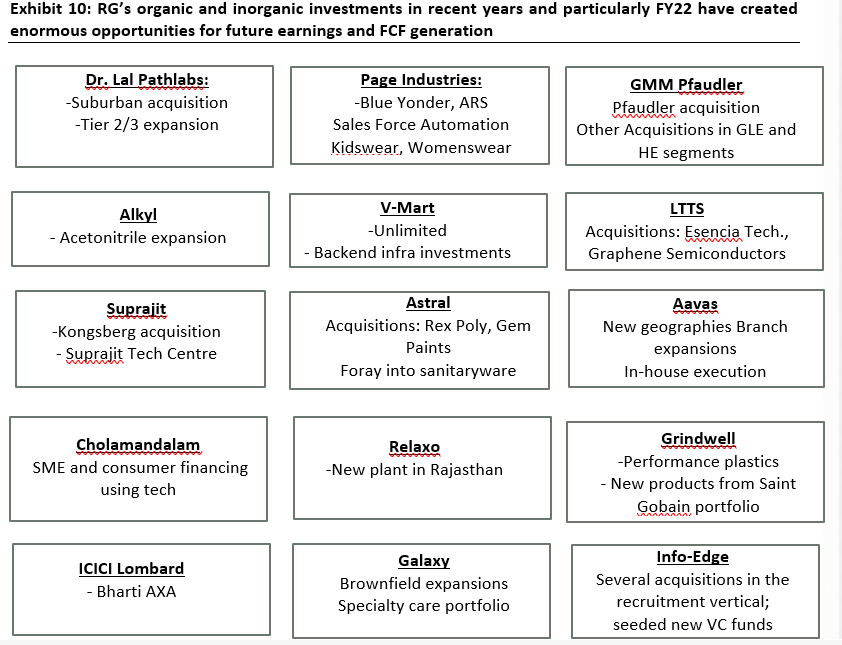
Massive reinvestments in FY22:The median capex at the RG portfolio level for FY22 is more than 2x that of the FY19-21 average. This is because most RG companies saw a massive jump in reinvestments through organic and inorganic expansions as shown in the below exhibit. We find this jump in reinvestment to be encouraging because it a signal that the RG companies are optimistic about their growth prospects.
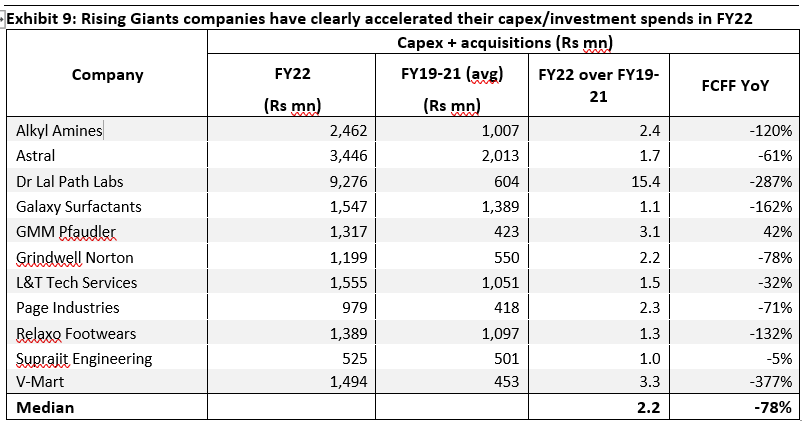
Source: Companies, Ace Equity, Marcellus Investment Managers. Note: (1) The above does not include financial services stocks in the portfolio namely – Aavas Financiers, Cholamandalam Investment, ICICI Lombard General Insurance and Info-Edge since Capex is not a relevant metric for such companies
Source: Companies, Marcellus Investment Managers
However, we do not see any cause for worry as regards deterioration in FCF in FY22. A degree of volatility in the YoY movement in FCF is inherent due to the lumpy nature of capex and reinvestment. This volatility smoothens out over longer time periods. Nonetheless, we expect the high inventory levels at FY22-end to unwind as these get translated into production and sales in FY23. More importantly, we expect the significant capex/reinvestments that the RG companies have made in FY22 to drive future FCF growth and thence share price compounding. That is how today’s RG companies will become tomorrow’s CCPs.
Team Marcellus
If you want to read our other published material, please visit https://marcellus.in/
Copyright © 2022 Marcellus Investment Managers Pvt Ltd, All rights reserved
Note: the above material is neither investment research, nor investment advice. Marcellus does not seek payment for or business from this material/email in any shape or form. Marcellus Investment Managers Private Limited (“Marcellus”) is regulated by the Securities and Exchange Board of India (“SEBI”) as a provider of Portfolio Management Services. Marcellus is also a US Securities & Exchange Commission (“US SEC”) registered Investment Advisor. No content of this publication including the performance related information is verified by SEBI or US SEC. If any recipient or reader of this material is based outside India and USA, please note that Marcellus may not be regulated in such jurisdiction and this material is not a solicitation to use Marcellus’s services. This communication is confidential and privileged and is directed to and for the use of the addressee only. The recipient, if not the addressee, should not use this material if erroneously received, and access and use of this material in any manner by anyone other than the addressee is unauthorized. If you are not the intended recipient, please notify the sender by return email and immediately destroy all copies of this message and any attachments and delete it from your computer system, permanently. No liability whatsoever is assumed by Marcellus as a result of the recipient or any other person relying upon the opinion unless otherwise agreed in writing. The recipient acknowledges that Marcellus may be unable to exercise control or ensure or guarantee the integrity of the text of the material/email message and the text is not warranted as to its completeness and accuracy. The material, names and branding of the investment style do not provide any impression or a claim that these products/strategies achieve the respective objectives. Further, past performance is not indicative of future results. Marcellus and/or its associates, the authors of this material (including their relatives) may have financial interest by way of investments in the companies covered in this material. Marcellus does not receive compensation from the companies for their coverage in this material. Marcellus does not provide any market making service to any company covered in this material. In the past 12 months, Marcellus and its associates have never i) managed or co-managed any public offering of securities; ii) have not offered investment banking or merchant banking or brokerage services; or iii) have received any compensation or other benefits from the company or third party in connection with this coverage. Authors of this material have never served the companies in a capacity of a director, officer or an employee.
This material may contain confidential or proprietary information and user shall take prior written consent from Marcellus before any reproduction in any form.

