A basic takeaway of cashflow based valuation is that a longer a company generates healthy free cash flow (FCF) growth, the higher its intrinsic value. Our longevity framework helps in assessing, using objective parameters, how long a company is likely to sustain healthy growth in FCF. For younger companies like the Little Champs, after a particular size & scale is attained, incremental growth in operating profits and improvement in capital efficiency results in much higher growth in FCF. This is also corroborated by strong FCF growth generated by companies like Astral and Relaxo in recent years. Given this non-linearity, FCF, rather than measures like earnings, should be the primary input for determining the intrinsic valuation for Little Champs. More specifically, the FCF performance of a number of Little Champs demonstrates that they are on their path to becoming consistent cash compounders.
Performance update for the Little Champs Portfolio
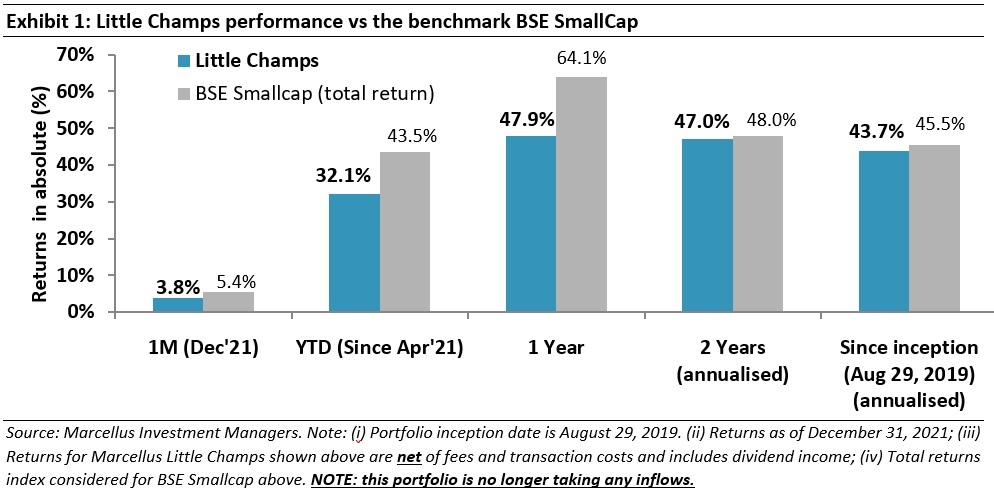
At Marcellus, the key objective of our Little Champs Portfolio is to own a portfolio of about 15-20 sector leading franchises with a stellar track record of capital allocation, clean accounts & corporate governance and at the same time high growth potential. While we intend to fill our portfolio with winners, we want to be sure of staying away from dubious names where we are not convinced about the cleanliness of accounts or the integrity of the promoters (even though the business potential may sound promising) as the fruits of company’s performance may not get shared with minority shareholders. We intend to keep the portfolio churn low (not more than 25-30% per annum) to reap the benefits of compounding as well as minimize trading costs. The Little Champs Portfolio went live on August 29, 2019. The performance so far is shown in the below table.
Understanding free cash flow from a Company lifecycle perspective
A typical firm’s life cycle consists of four stages – Nascent, Growth, Maturity and Decline. Free cash flow (FCF) is calculated as the difference between operating profits generated by the Company for the year and the amount reinvested back into the business (investments into working capital and fixed/intangible assets). These key determinants and thus the quantum of FCF is significantly influenced by the stage of a Company’s lifecycle as shown in the exhibit below.

In the Nascent phase, the Company’s revenues are growing but small & insufficient to cover the operating costs (most of which are fixed and to an extent front ended in nature) resulting in operating level losses. However, at the same time, the Company needs to give credit to its customers, build inventories and invest in capacities. Non-existent operating profits but inevitable investment needs lead to reliance on outside cash flows (equity or borrowings) to stay afloat and grow. FCF is deep in the red in this phase.
In the Growth phase, as the Company reaches a decent size and scale, operations start becoming profitable as growth in revenues outperform the growth in costs. However, given the healthy growth prospects (driven by market and/or market share expansion), a large part of operating profits needs to be reinvested back into business. Hence growth in operating profits don’t fully translate into FCF growth – in fact FCF could even be negative during the early part of the growth phase. However, as the Company continues on its growth journey, operating profits start becoming sizeable enough to cover the working capital and capex needs resulting in FCF turning positive and starting to grow exponentially (and much faster than operating profits).
The revenues and profits of the Company hit the peak in the Maturity phase. So does the quantum of FCF as reinvestment needs ebb off due to plateauing growth. The peak in FCF usually supersedes the peak in operating profits.
As growth opportunities dwindle, competition intensifies and/or redundancy in products sets in, the Company enters the Decline phase. Revenues & operating profits start on a descending journey followed eventually by the cash flows.
The fair value (or intrinsic value) of a company is the net present value of all its expected future FCF over its life cycle. The future FCF that the Company generates over its lifecycle are in turn dependent on the length of the FCF curve (i.e. the longevity of the cash flows) and the slope of the FCF curve (i.e. the growth in cash flows). The longer a Company stays in the zone of exponential FCF growth (shown as the ‘sweet spot’ in exhibit 2 above), the higher the intrinsic value generated by that Company over the longer term (as such companies have much longer as well as higher FCF generation).
Marcellus investment process & frameworks to own companies maximising FCF generation over their life cycles
At Marcellus, we typically stay away from companies at the Nascent stage of their evolution. For these companies, their relative short operating track record does not give us the required conviction regarding the governance, long-term cash generation ability, etc. Our research process and in particular our quantitative filters with minimum thresholds around the history of the Company, its forensic accounting quality and its capital allocation normally weed out such early-stage companies.
Similarly, we stay away from a franchise which is past its prime and hence witnessing a plateauing of its growth rates or even an actual structural decline in its operating profits/cash flows. This plateauing/decline in FCF could be a result of several factors like demand saturation for company’s products, technological disruption in its business or reflective of a lethargic management letting the company to be competed or disrupted away or lacking the vision of taking mitigating steps like adding new growth initiatives in time. Here too, our investment process, more particularly our longevity framework (see exhibit below) helps us to stay away from such stocks during our new stock selection process as well as detect early signs in our existing portfolio companies.
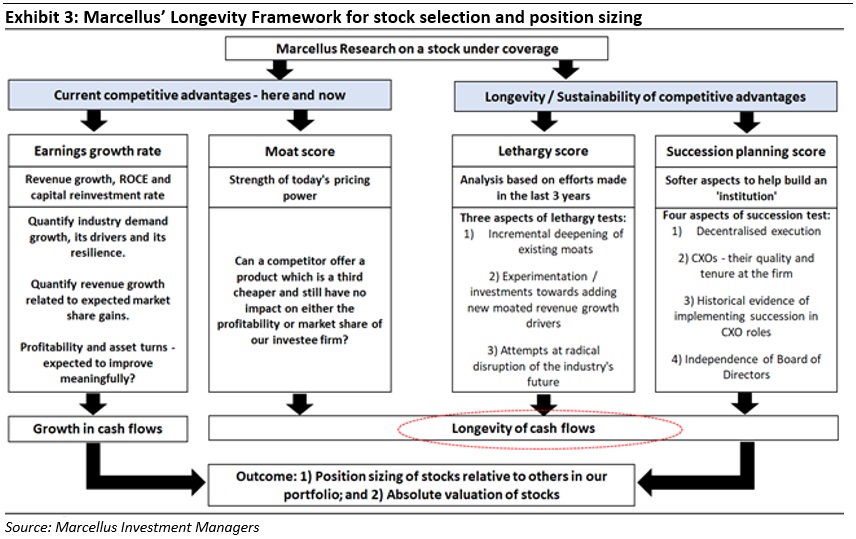
However, all companies don’t follow the typical FCF pattern shown in exhibit 2. Great companies generate several decades of growth in FCF i.e. remain in the ‘sweet spot’ phase of FCF growth for decades. As explained in our December 2021 Consistent Compounders Portfolio newsletter, some of the factors that positively impact the longevity and growth in the FCF of a Company as assessed through our longevity framework are:
1. Inherent advantages enjoyed by the Company like strong pricing power (i.e. strong moat).
2. Focus on operating efficiencies (how the firm achieves the same revenues as its competitors but with lower expenses).
3. Prudent capital allocation/adding profitable new growth initiatives.
4. Softer aspects around management quality and succession planning.
The above framework for assessing the longevity and growth of the cash flows is also applied to the Little Champs portfolio with some variations (for example relationship between family members become a very important risk surrounding the longevity of FCF for family run smaller companies).
In summary, our longevity framework helps in assessing using objective set of parameters, how long the Company is likely to sustain the healthy growth in FCF and a Company’s score in the longevity framework forms an important basis in deciding not only whether a company makes it to/remains in the portfolio but also the inter-se position sizing amongst the portfolio companies.
Sweet spot can get even sweeter for younger companies like the Little Champs
Whilst we steer clear of nascent companies, we look to invest into well-managed market leading franchises with healthy RoCEs but currently ‘suppressed FCF’ due to high reinvestment needs (due to investment in working capital and fixed assets). In fact, most of the Little Champs companies fit to this definition where they have built a track record of consistency in profits but are still witnessing somewhat YoY volatility in FCF generation. Such inconsistency in the FCF generation usually inhibits analysts from using FCF for arriving at the intrinsic value for smaller/young companies. However, we believe replacing free cash flow with other proxy metrics like earnings ends up underestimating the intrinsic value of the franchise. This is because of the following reasons:
1) As these companies achieve scale, operating profits start becoming sizeable enough to cover the working capital and capex needs. This not only results in FCF moving into a consistent positive zone but also brings about non-linear growth in FCF as more and more incremental operating profits flow through into FCF. This non-linearity in FCF generation – which you can see in exhibit 2 – does not get captured in an earnings growth.
2) Many well-run companies irrespective of their lifecycle proactively focus on generating efficiencies around working capital (for instance investing in inventory management system that helps bring down the level of inventories) or fixed assets investment (better throughput from automation of the production line). These efficiencies are again not fully captured in a measure like earnings growth.
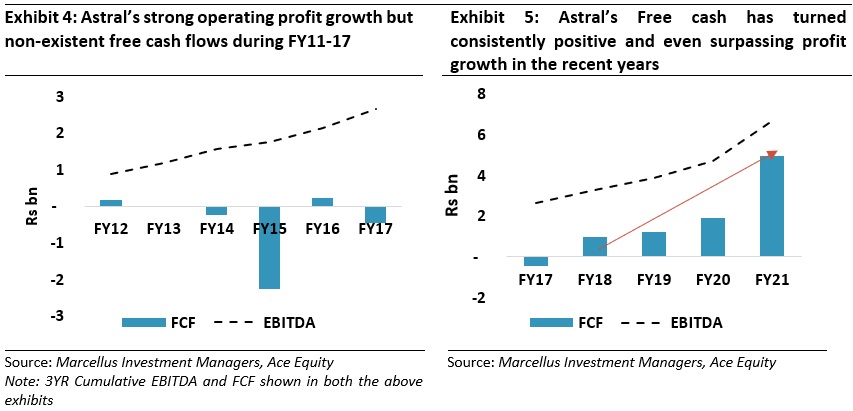
The result of the above is that, after a particular size and scale, every unit of incremental growth in operating profits result in much higher growth in FCF. In such cases, FCF estimation becomes all the more relevant and important. This importance of using FCF is also underpinned by the growth in FCF in some of Marcellus’ portfolio companies like Astral, Relaxo (which are not part of the Little Champs portfolio but are part of other Marcellus portfolios) in recent years. Both these companies have a good operating profit track record but had inconsistent FCF generation until few a years ago. Now they have turned into consistently strong FCF generating machines in recent years as we show in the exhibits below due to the precise reasons mentioned under points 1 and 2 above.
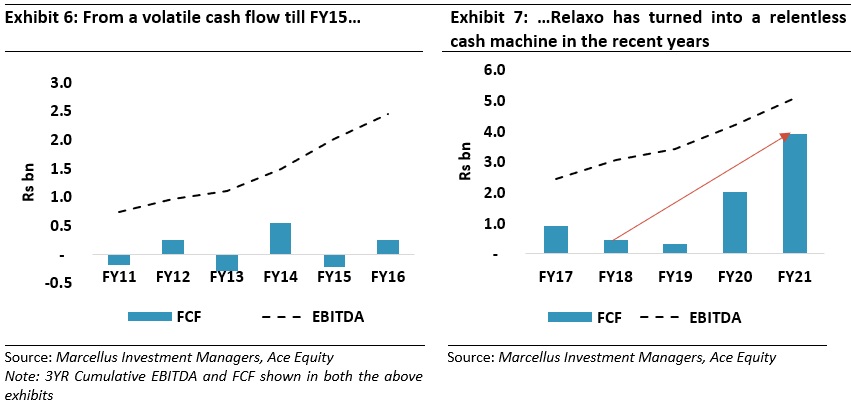
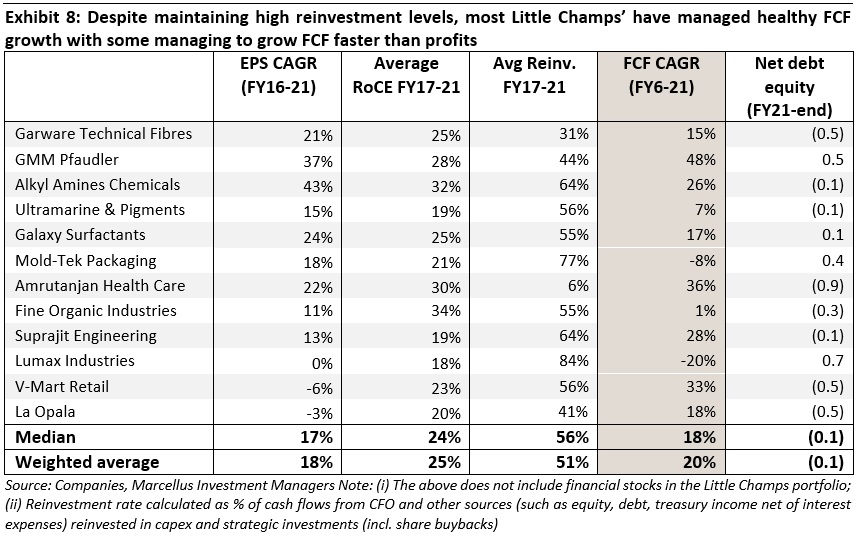
Conclusion: The examples of Astral and Relaxo highlighted above indicates there is a lot of value add in building long-term FCF projections of companies notwithstanding the near-term complexities. Our longevity framework which focusses on specific management actions surrounding increasing the longevity and growth of the FCF gives us an objective way of determining the long-term FCF compounding for Little Champs companies. We also derive confidence from the fact that a number of Little Champs companies have in fact in the most recent years, started generating healthy FCF despite maintaining high reinvestment rates as highlighted in the below exhibit – for example, GMM Pfaudler, Alkyl Amines, Amrutanjan and Suprajit. Furthermore, 10 out of the 12 non-financial Little Champs portfolio stocks generated positive FCF in the three most recent financial years i.e. FY19, FY20 and FY21. These data points point towards an inflection point for these Little Champs stocks as they transition towards becoming long-term consistent cash compounders.