Short term (less than 12 months) performance of an equity portfolio is significantly affected by noise. The tools that can help deliver consistent short-term outperformance over benchmark indices usually bring with them the risk of compromising long term (3 years or longer) absolute returns. For instance, Berkshire Hathaway’s monthly performance has exceeded that of S&P500 in only 51% of historical instances, despite the firm having outperformed the index over most long time horizons. Choosing long term absolute performance objectives over short term relative performance objectives becomes even more important in the Indian stock market where benchmark index returns on average do NOT materially exceed the nominal GDP growth of the country. At Marcellus, we focus on a healthy rate of compounding the fundamentals of our investee companies as the key driver of long-term portfolio performance – an absolute return focus which also results in healthy relative returns over the long term.
Performance update – as on 31st August 2022
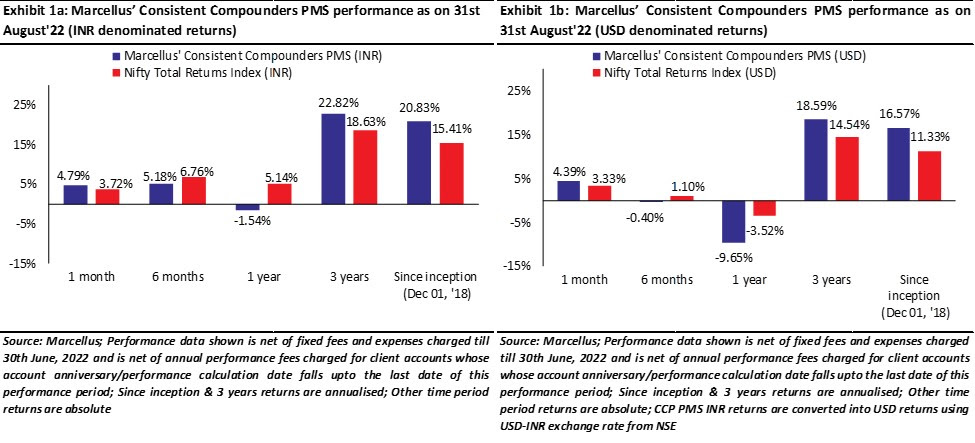
We have a coverage universe of around 25 stocks, which have historically delivered a high degree of consistency in ROCE and revenue growth rates. Our research team focuses on understanding the reasons why these companies have delivered healthy and consistent historical track record and which of these companies are likely to sustain their superior financial performance in future. Based on this understanding, we construct a concentrated portfolio of companies with an intended average holding period of stocks of 8-10 years or longer. The latest performance of our PMS portfolio is shown in the charts below.
The choice between absolute vs. relative objectives
In almost all fields of life, the way to achieve your goals is to focus on your own absolute performance (inner scorecard) rather than relative performance vs. your peers (outer scorecard). The best performers in almost all arenas of life – sports, performing arts, academia and even investing have tended to focus on honing their own skills over the long term rather than tweaking their approach basis what their peers are doing at a point of time. Interestingly, focus on healthy absolute objectives also helps achieve relative objectives in the long run.
Let’s take an intuitive example from the world of cricket – the irrelevance of the worm chart in defining a player’s strategy. In a recently concluded T20 match between India and Pakistan (Asia Cup – 28th Aug 2022), the Indian team achieved the absolute target of scoring 148 runs in 20 overs. However, a ball-by-ball progression of scores between the two teams (also called the worm chart, see exhibit 2 below) through their respective innings shows that the Indian Team’s worm was underperforming vs the Pakistan Team’s worm throughout the first 17 overs of their innings.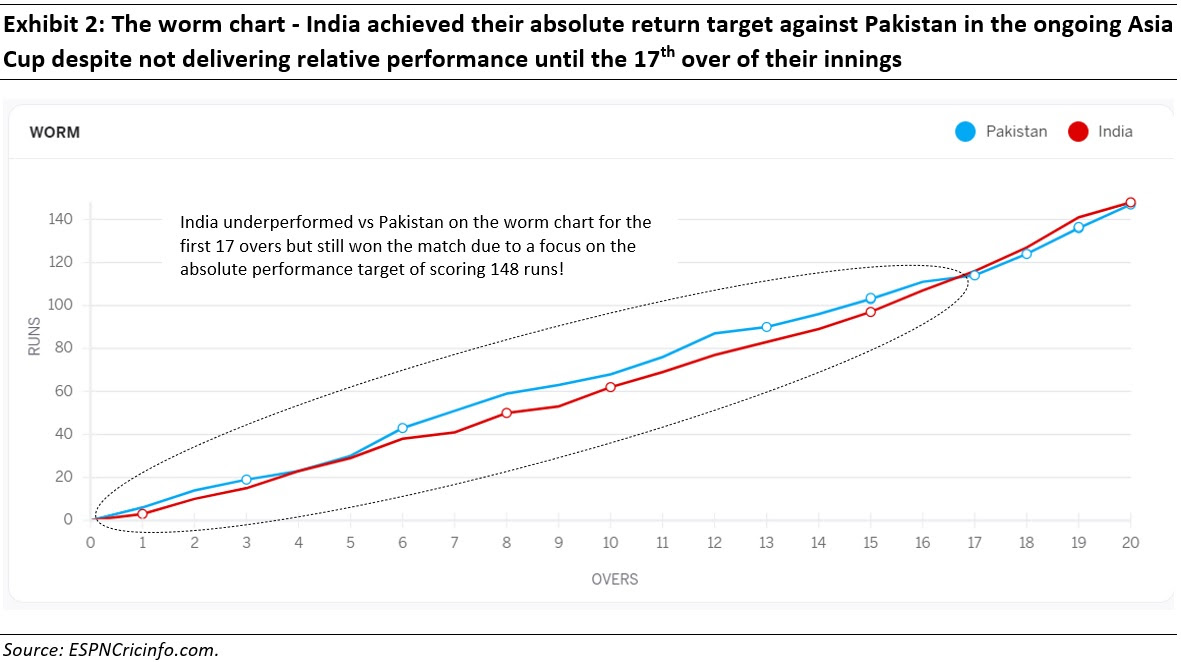
Now, let us say you are one of the players in the Indian Cricket Team. As the Indian Team’s innings progressed (India was chasing the target), you could have had either of the following two approaches to analyse the progress of the game:
-
The relative approach – India’s outperformance on the worm chart vs Pakistan at every stage of the game:
This approach clearly does not have much relevance. If the objective of the match is to score 148 runs, then it doesn’t matter at any interim stage, what the relative performance on the worm chart of one team is versus its rival. Moreover, if as a player in the chasing side (in this case, India) you tweak your game basis your performance on the worm chart, then it is quite possible that you will miss achieving the long-term target of winning the match.
-
The absolute approach – India’s current run-rate vs the required run-rate at every stage of the game:
By keeping your eyes only on the current run-rate vs the required run-rate to win the match, you might completely ignore the worm chart as part of your strategy. In this case, you would recalibrate your strategy at different stages of the innings (basis required run-rate), regardless of whether the worm chart is showing outperformance or underperformance at any point of time.
A similar principle applies to equity investments as well wherein a clear focus on generating high absolute returns works better than the relative (to markets/benchmark) approach over any short period of time.
Clarity of thought around drivers of performance over the long term in equity investing
Any measure of good performance in equity investing helps compound the wealth of an investor only if the performance was delivered over long-time horizons i.e. over several years, if not several decades. Performance objectives over short time horizons (like 1 month or even 1 year) can be classified as either speculation or trading, and do NOT generate material wealth for any investor.
Having said that, even over the long term, share price performance of any portfolio is just an outcome of the underlying drivers of performance. In a portfolio of stocks concentrated towards high quality fundamentals, it is largely the rate of fundamental progression (e.g. free cash flow CAGR for non-financial services companies or book value per share CAGR for financial services companies) of the portfolio constituents that drives performance of the portfolio over the long term.
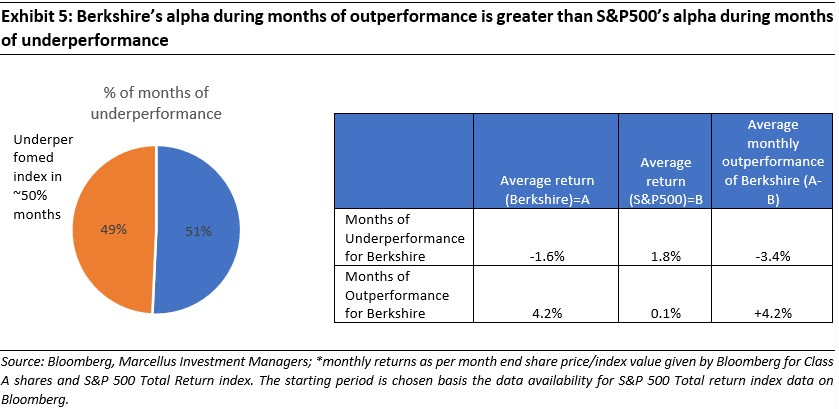
One way to understand the utter futility of short-term investment returns is to understand how Berkshire Hathaway’s share price has performed. Berkshire Hathaway’s one-month-performance has been weaker than the S&P500 in 49% of the months, despite the stock outperforming the index consistently over several decades!!
The track record of Berkshire Hathaway under the leadership of Warren Buffet and Charlie Munger is legendary. A Berkshire shareholder would’ve generated annualized returns of 20.1% over 1965-2021 vs. 10.5% for S&P500 index. This translates into an overall gain of 36,41,613% for Berkshire shareholders vs. 30,209% for the index- more than 100x difference in total returns! [as per the Berkshire Shareholder Letter, 2021]
As has been well documented in the media, Berkshire’s approach has primarily hinged on investing in strong businesses with sustainable moats that can compound their free cashflows at a healthy rate, without any importance given to what the ‘stock market’ is doing. In other words, the approach has focused on generating healthy absolute returns over long term rather than beating the benchmark index month in, month out.
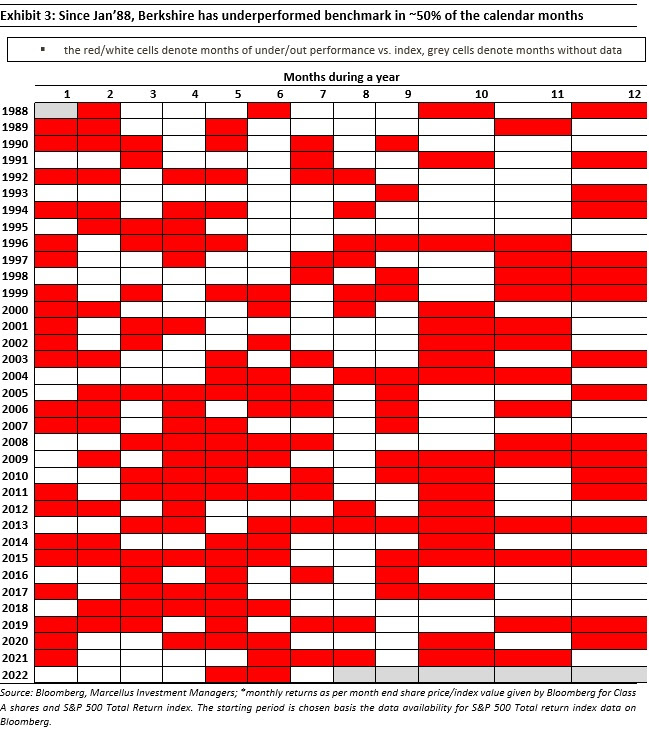
Astonishingly, Berkshire Hathaway has underperformed the benchmark S&P500 Total Return Index in 49% of the 414 months over the Jan 1988 – July 2022 period (the period is chosen basis the monthly data availability for Berkshire Class A shares and S&P 500 Total Return index; returns calculated basis end of month values for each).
In fact, in the exhibit below, one can see many periods of sustained monthly underperformance (for example 9 months over Jun’13-Feb’14).
This disconnect between frequent short term under-performance and frequent long-term outperformance of Berkshire Hathaway (BH) vs S&P500 is due to a combination of the following three factors:
- Short term performance is more driven by noise than by fundamentals;
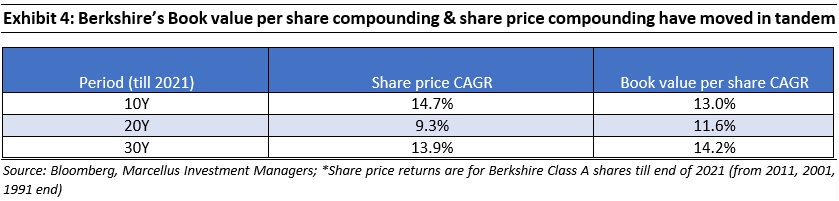
- Fundamentals of Berkshire Hathaway’s investee companies compounded at a rate much faster than the fundamentals of S&P500 over the longer term. In fact, the firm’s book value per share compounding and share price compounding has moved in-line with each other.
- The average quantum by which Berkshire outperformed the S&P500 during the 51% of monthly instances was ~4.2%, higher than the average quantum of underperformance during the 49% of monthly instances (~3.4%) (see exhibit 5 below).
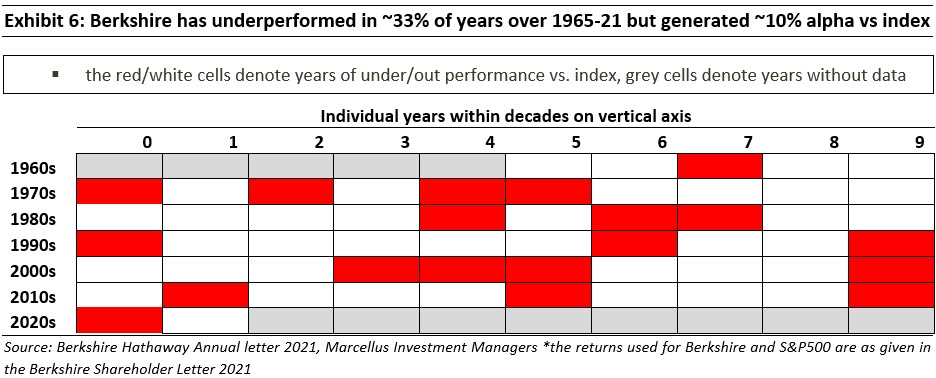
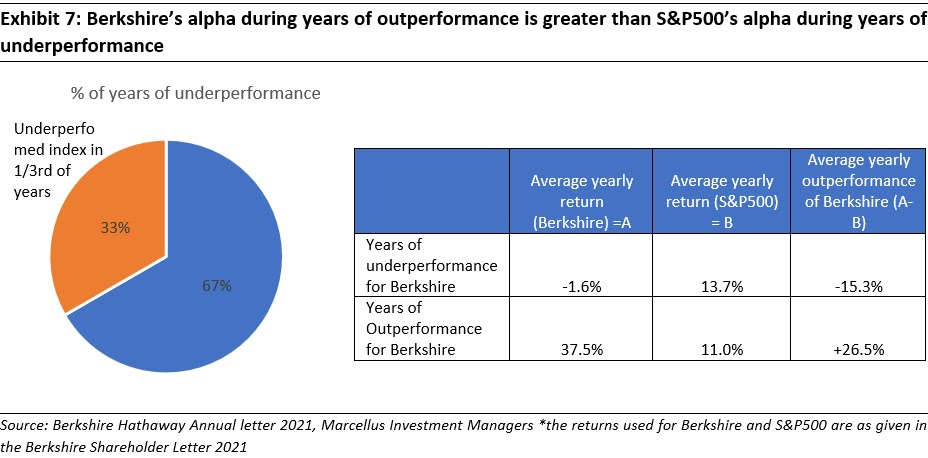
When we increase the duration over which returns are computed from a month to a year, the picture changes positively. For instance, using the annual returns reported in the 2021 Berkshire letter, the heatmap below showcases how the percentage of instances of relative underperformance comes down to ~33% (19 out of 57 years) versus 49% when using monthly returns (as discussed earlier). Here again, while there have been blocks of relative underperformance, like from 1974-75, 1986-87, 2003-05, a clear focus on generating healthy absolute returns has meant overall returns compounded at 20.1% vs. just 10.5% for the S&P500 index.
Interestingly, such results are not limited to likes of only Berkshire Hathaway. In his enlightening book, ‘Richer, Wiser, Happier: How the World’s Greatest Investors Win in Markets and Life’, William Green discussed how Jean-Marie Eveillard – one of world’s most successful fund managers went through a horrid time in late nineties which even led his fund to be sold off to another entity. We share an excerpt from the book below (see recording of our recent Webinar with Mr. Green):
“The specter of “career risk” helps to explain why many funds “hug” the index, condemning themselves to unexceptional returns but sparing themselves exceptional grief. Eveillard, who has a streak of indomitable obstinacy, did not take the easy option. As a result, he lagged the market by miles for three long years while tech stocks went nuts. In 1998 alone, the Nasdaq gained 39.6 percent and the MSCI World Index gained 24.3 percent, while SoGen International lost 0.3 percent. The following year, SoGen International roared back, returning 19.6 percent. Pretty good, right? Wrong. That year, the Nasdaq shot up 85.6 percent… SoGen lost 70 percent of its shareholders in less than three years, and its assets under management dwindled from more than $6 billion to barely $2 billion.
Now, after three years of dismal underperformance, he was traded to another team like some washed-out athlete. The sale was almost comically mistimed. It was announced in October 1999 and the deal closed in January 2000. Two months later, on March 10, the tech bubble burst. Eveillard’s portfolio of bargain-priced stocks performed superbly as rationality reasserted itself. His flagship investment vehicle, now renamed the First Eagle Global Fund, trounced the Nasdaq by 49 percentage points in 2000, 31 percentage points in 2001, and 42 percentage points in 2002.”
Despite such intermittent periods of painful underperformance vs. benchmark, over his entire fund management tenure (1979-2004), Eveillard’s flagship fund generated annualized returns of 15.8% vs. 11.9% for the Nasdaq composite index (source: Yahoo Finance).
Buffet/Munger’s and Eveillard’s approach highlighted above bring into light the limitations of the ‘relative’ approach followed by the majority of the fund management industry wherein the focus is to beat benchmark every month or quarter via tweaking of stock weights vis-à-vis benchmark index/betting on turnaround stories (even the first line of excerpt above alludes to this!). While it may look like the optimal approach to manage money, the results tell another story altogether.
Divergence between outcomes of relative vs absolute orientation is wider for Indian Equities than for most other countries
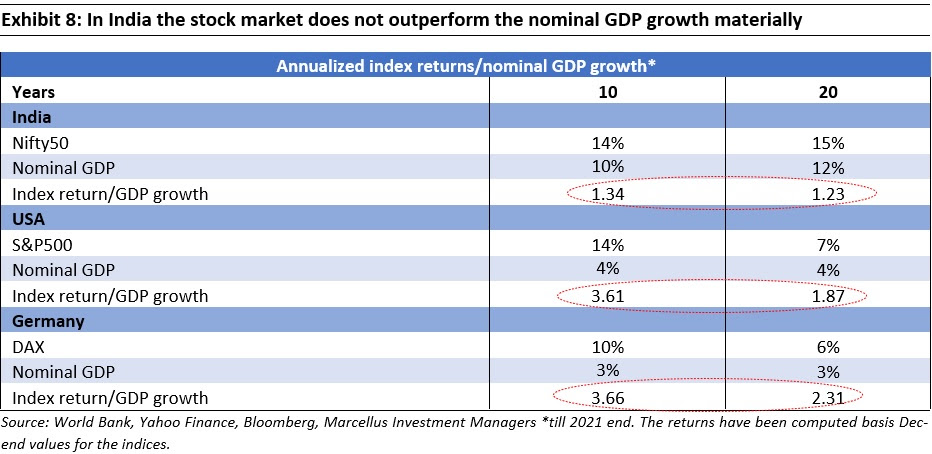
India’s benchmark index Nifty50 has managed to provide (annualized) returns averaging ~1.3x the nominal GDP growth of the country over the last 10 as well as 20 years (until 2021 end) as shown in the table below.
On the other hand, developed countries like the USA and Germany have seen their benchmark indices (S&P500/DAX) produce returns of the order of ~3x (on average) the nominal GDP growth over the same periods.
Whilst the question of why India’s stockmarket benchmark struggles to grow faster than nominal GDP growth (whereas the developed market indices have no such problem), deserves a newsletter by itself, the practical implications of this point are very powerful, namely, a relative investment approach looking to just beat the Nifty by a small margin is thus unlikely to materially exceed India’s nominal GDP growth. Hence, in India only an absolute return approach which focuses on generating returns much higher than nominal GDP growth can lead to material wealth creation for investors over the long term.
Investment Implications
Marcellus’ portfolios aim to invest in deeply moated franchises which can compound their cashflows at 20%+ over several years into the future. Such an endeavor however, is fraught with short term noise wherein our funds may underperform the benchmark over a month/quarter or even a year (we discussed this in detail in our Aug’22 newsletter). This is an absolute return objective driven by the rate at which we expect the fundamentals of our portfolio companies to compound in the longer term (significantly faster than India’s nominal GDP growth). Hence we do not lose sleep about the relative underperformance of our funds over time periods as short as say 12 months, provided there is no moderation either observed or expected in the rate of compounding of their fundamentals (free cash flows for non-financials and book value per share for financials).
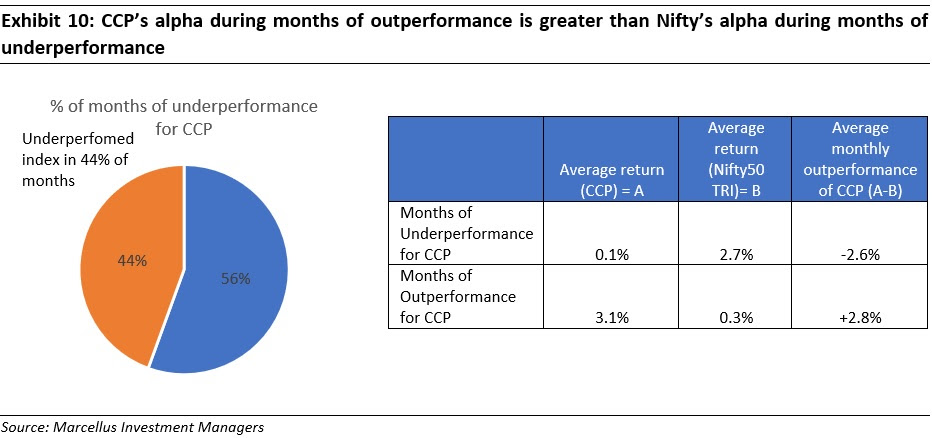
As can be seen in the exhibit below, since inception, the CCP portfolio has underperformed the Nifty 50 Total Return index in almost 44% of the months (Dec’18-Aug’22) – very similar to the figure we saw for Berkshire Hathaway. Despite this, the CCP portfolio has racked up annualized returns (net of fees) of 20.83% vs. 15.41% for the benchmark (till Aug’22). In absolute terms, Rs100 invested in CCP on 1-Dec’18 would’ve compounded to Rs. 203.47 vs. 171.23 for the index, a more than 32% difference in returns.
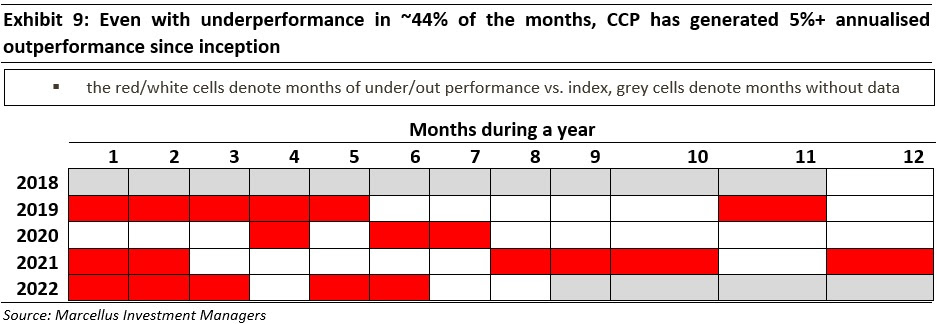
As the duration of return measurement is increased from a month to a year and 3 years, the percentage of relative underperformance vs. benchmark declines significantly (from 44% using monthly returns to 0% using 3-year returns) [i.e. 274 periods of 3-year rolling returns computed using daily net asset value of CCP]. Hence, while CCP has underperformed benchmark in almost half of the months since inception, it has not underperformed benchmark in even a single 3-year period (calculated using daily NAV rolls).

