Revenue growth is an important driver of Free Cashflow (FCF) growth. However, mere top-line growth usually doesn’t bring about non-linear FCF growth (hence the sub-par performance of commodity stocks on a cross-cycle basis). In this month’s newsletter, we deep dive into how the Rising Giants portfolio companies drive healthy FCF compounding through market share gains, improving product mix and efficiency measures (including investment in technology which reduce working capital cycle and/or increase asset turnover).
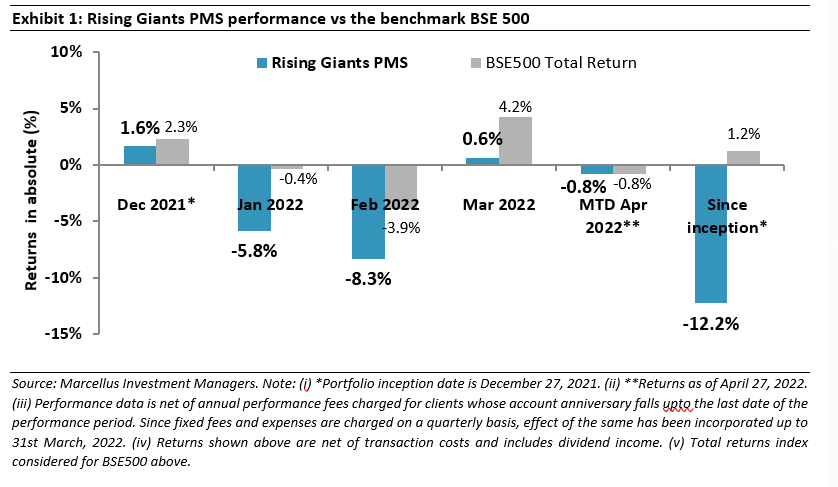
Performance update for the Rising Giants PMS
The Fund intends to invest primarily in high quality mid-sized companies (less than INR75,000 crores market-capitalisation, predominantly in the INR 7,000 crores – INR 75,000 crores range) with: 1) Well moated dominant franchises in niche segments; 2) A track record of prudent capital allocation with high reinvestment in the core business and continuous focus on adjacencies for growth; and 3) Clean accounts and corporate governance. From a universe of ~450 companies in this segment, a portfolio is constructed of 15-20 companies which make it past Marcellus’ proprietary forensic accounting & capital allocation filters as well as our bottom-up stock selection & position sizing framework.
Rising Giants PMS portfolio updates
We have made the following changes to the Rising Giants PMS portfolio in the recent months:
- Exit from Endurance Technologies: The key reasons for exit are structural issues surrounding the European subsidiaries’ margins on account of:
- The shift away from castings supplied to ICE engines towards that for hybrid and electric vehicle castings – a relatively new segment for the Company;
- Higher cost of operations due to significant increase in certain operating costs like power & fuel in Europe (non-Raw Material operating costs are generally not covered in the OEM-vendor pass-through agreements exposing vendors to surge in such costs); and
- While the Company has been winning new orders – such as those from VW Group, Stellantis, etc, it is likely to be catered largely through new capacities/plants (as against existing capacities) increasing the fixed overheads burden and delivering limited operating leverage benefits that would have otherwise come by servicing additional volumes at existing plants.
Consequently, we have downgraded the earnings growth forecast of the Company and thus its intrinsic valuation resulting in Endurance’s exit from the portfolio.
- Addition of V-Mart Retail: The rationale for the addition is: V-Mart Retail is the largest affordable fashion apparel retailer in tier 2, tier 3 and tier 4 cities of the north-eastern Hindi heartland. It commands one of the best RoCEs in Indian retail (pre-tax average RoCE of 28% over FY17-20) and has delivered net earnings CAGR of 22% over FY17-20 (FY21 numbers are expectedly impacted by Covid-19 lockdowns and hence not considered in the above numbers). These robust fundamentals are underpinned by its: (a) efficient supply chain management (automation of warehousing activities, own logistics and cluster-based expansion model); (b) sound merchandise selection & vendor management (investments in auto replenishment systems, vendor consolidation and extending support to vendors during difficult times like Covid-19 lockdowns); and (c) relentless focus on talent retention & training. These initiatives alongside V-Mart’s strong balance sheet provide significant growth and market share gain opportunities for the Company – for instance its recent acquisition of Unlimited brand from Arvind Lifestyle.
- Rebalancing of portfolios in cases of sharp deviations vs the model portfolio allocation*: In our March 2022 Rising Giants PMS newsletter, we had discussed that several of the Rising Giants portfolio companies’ inputs like steel, aluminium, basic chemicals are subject to high price volatility. Furthermore, due to the recent geopolitical events, there has been a significant uptrend in the prices of these raw materials. We also explained how besides some near-term impacts on the operating margins of some RG portfolio companies, we don’t expect any longer term or structural impact on margins of these companies. Hence barring the exit from Endurance described above, we have not made any changes to our RG PMS model portfolio as these near-term headwinds do NOT materially impact the intrinsic value of our investee companies. Having said this, there has been steep price corrections in some of the portfolio stocks. We have used these corrections to rebalance the portfolios in favour of these stocks where the risk reward has turned more favourable.
* Please note that actual portfolio deviation vs model portfolio would defer from client to client depending upon the time of entry
Delving deeper into the Free Cash Flow compounding for Rising Giants
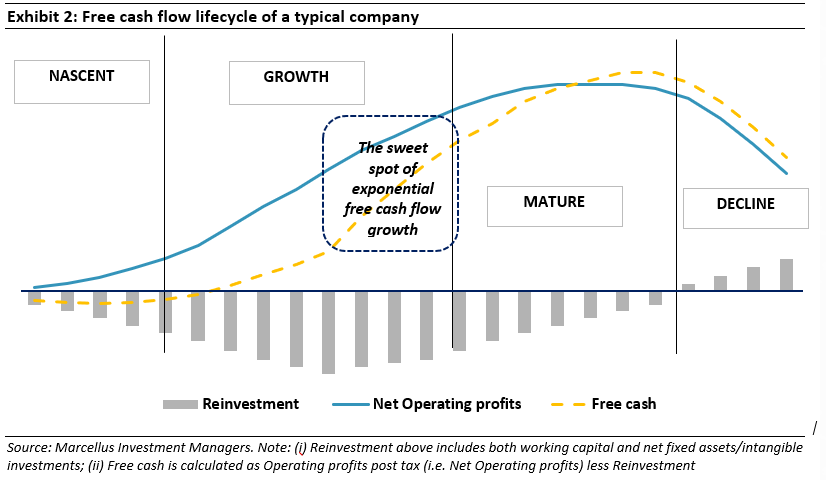
As explained in our February 2022 Rising Giants newsletter, Free cash flow (FCF) is calculated as the difference between operating profits generated by a Company for the year and the amount reinvested back into the business for sustenance & growth. The reinvestments happen mainly through: (a) investments into working capital; and (b) investments in fixed and intangible assets. As can be seen in one of our often-used charts below, whilst FCF is generally non-existent during the nascent phase (due to lack of operating profits alongside heavy reinvestment needs), it starts building up as the operating profits start growing (growth phase). Then, an inflection point arrives when operating profits growth start outpacing the growth in reinvestments (or reinvestment as % of operating profits starts declining) setting the stage for exponential FCF compounding phase.
Rising Giants have witnessed a consistent acceleration in FCF growth in recent years (median FCF growth of the portfolio has improved from 5% over FY13-15 to 25% over FY16-18 and then further to 44% over FY19-21) – please refer to the exhibit below.
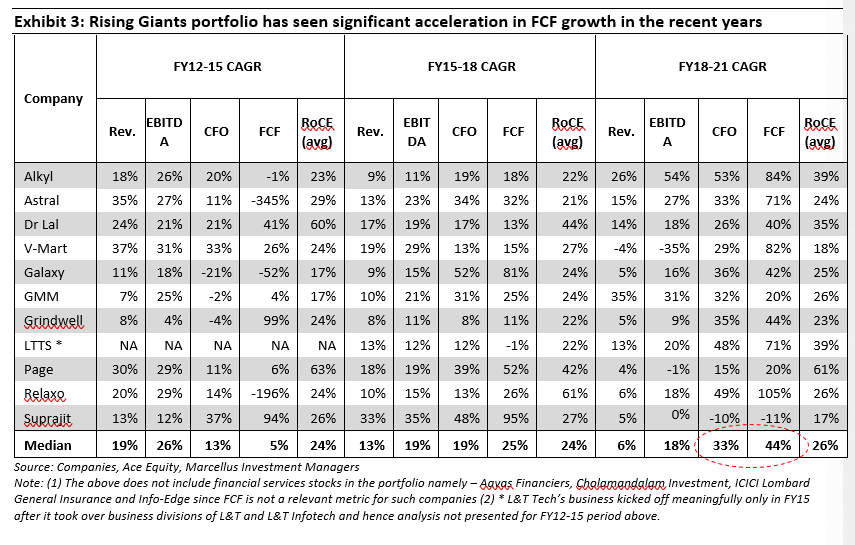
As can be seen in the above exhibit, even as the median revenue growth of the RG portfolio has come down in recent years, the median EBITDA growth for the portfolio has remained more or less constant over the last decade. On the other hand, operating cash (CFO) and FCF have both witnessed significant improvements in recent years. The key reasons for non-linearity in CFO and FCF growth compared to the Revenue/EBITDA growth boils down to the following three factors:
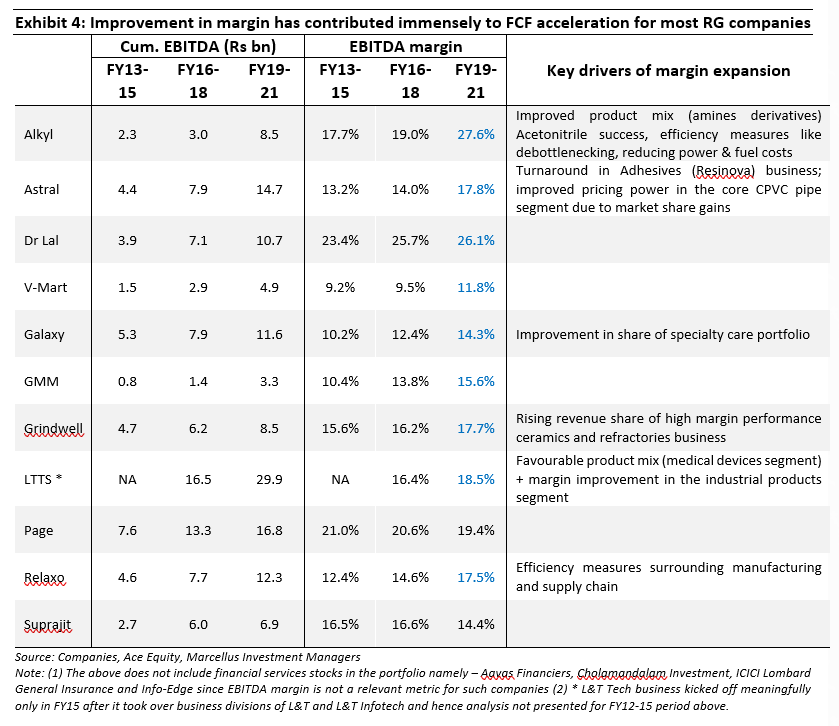
- Margin improvement for most RG companies
Assuming no change in working capital days and fixed assets turnover, margin improvement results in higher cash conversion and thus higher free cash flow for the same level of revenue growth. Out of the 11 non-financial companies in the RG portfolio, nearly 2/3rd (i.e. 7) of the portfolio companies have witnessed significant margin expansion in recent years. Margin improvement has played a key role in FCF acceleration for these portfolio companies.
In general, the key drivers of the margin expansion for most RG companies are: (i) Efficiency measures initiated by companies such as cost reduction initiatives (optimising power & fuel, logistics costs, value engineering etc); (ii) Improvement in the product mix; and (iii) Organic improvement in margin from higher pricing power (courtesy rising market shares, and operating leverage benefits from revenue/volume growth).
More company specific factors are discussed in the below exhibit:
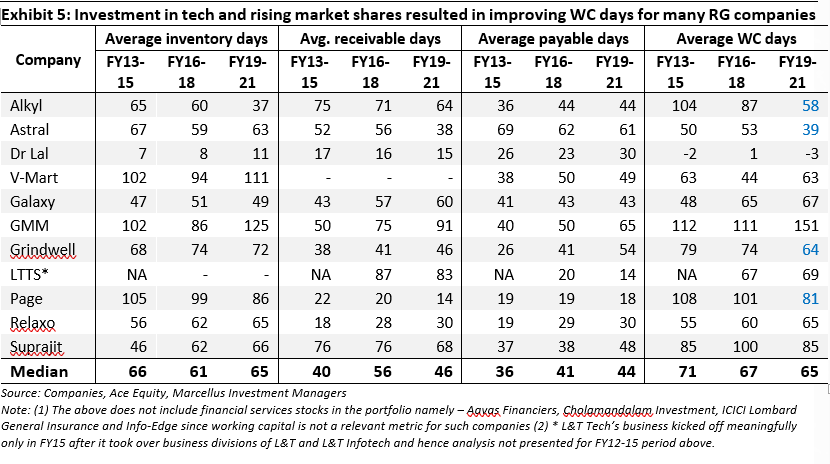
- Working capital reduction
The second most important cause of FCF acceleration for many RG portfolio companies have been reduction in their working capital days as can be seen in the below exhibit. This is despite Covid-19 induced lockdowns towards the end of FY20 and FY21 resulting in: (a) an increase in raw material inventories; and (b) challenges around revenue collection due to Covid.
There are two broad drivers of working capital reduction for the RG portfolio companies:
i) Rising market share which have resulted in better bargaining power vs customers and vendors; and
ii) Significant technology related investments in driving efficiencies at the backend like distributor management systems, supply chain tools, inventory management software, etc.
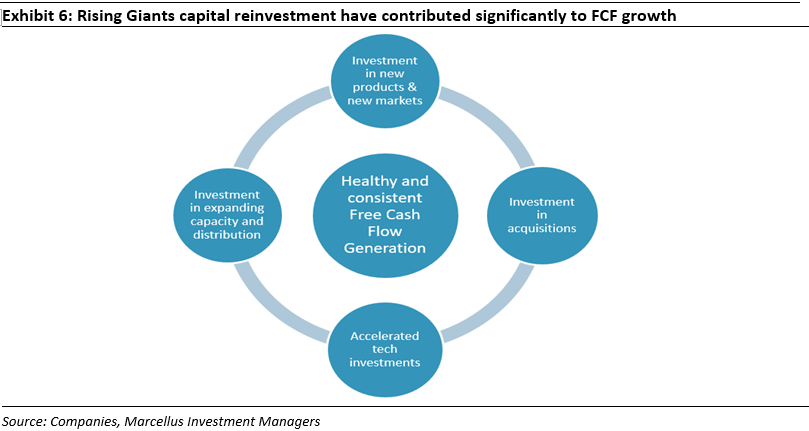
- Continued investments in tangible/intangibles at a healthy clip
While lower capex spends can boost the current FCF, it severely undermines the generation of the future operating profits and thus the future FCF growth. A company bereft of reinvestment opportunities may record significant FCF growth in the near term, but as operating profits stagnate or decline, the FCF curve will eventually trend downward – as can be seen in the exhibit 2 for the companies in the decline phase.
RG companies, on the other hand have been deploying the internal accruals for strengthening their franchises further through investments into products, people, and technology, expanding distribution networks and gaining market share from weaker players creating a loop of free cash generation, reinvestment and free cash acceleration.
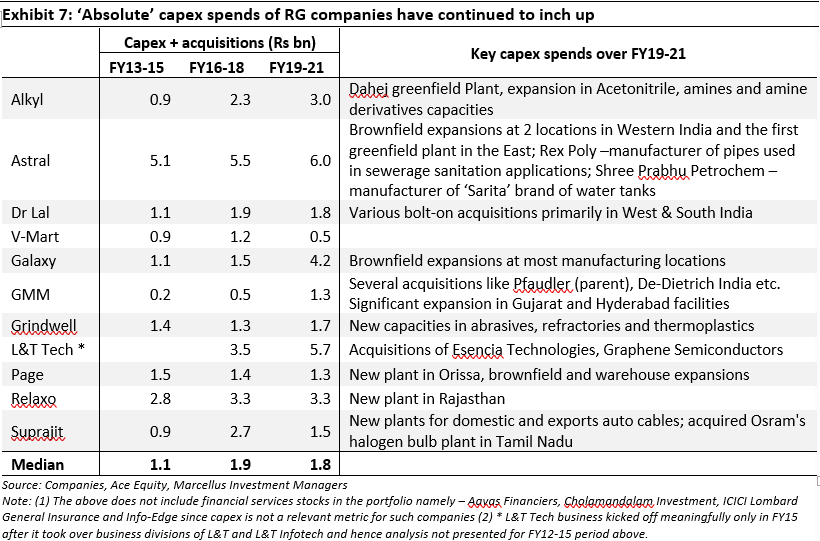
RG companies have also continued to invest in organic & inorganic expansion as shown in the exhibit below. The capex spend has in fact accelerated significantly in the last one year which is not captured in the below exhibit (which is restricted to the period upto FY21). For example, in FY22 we saw V-Mart’s acquisition of Unlimited brand for Rs1.5bn, Suprajit’s acquisition of Kongsberg’s light duty cable business for an enterprise value of US$42mn and Dr Lal Pathlabs’ acquisition of Suburban Diagnostics for Rs10bn. While these acquisitions may impact FCF generation in the near term, successful extraction of synergies and creation of efficiencies in the target companies would most likely boost FCF growth in the coming years.
We discuss below some case studies of RG companies’ path to FCF acceleration:
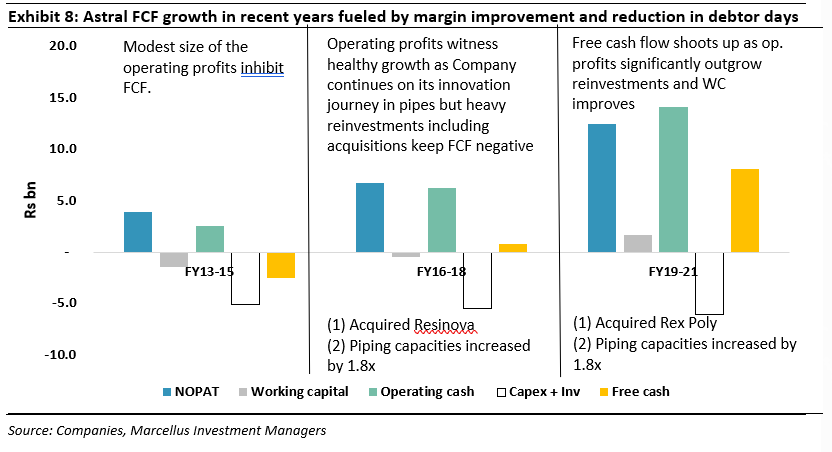
- Astral: Margin and reduction in trade receivables drive strong FCF compounding
While Astral historically recorded strong earnings growth and return on capital, however it was not accompanied by FCF growth until FY17 – for instance FY10-17 CAGRs for revenue, EBITDA and operating cash CAGR were 31%, 29% and 25% respectively. However, the cumulative FCF over FY10-17 was negative Rs1.5bn against NOPAT of Rs12.2bn and operating cash of Rs10.3bn. This was primarily on account of: (i) significant reinvestments into business in expanding the capacities – the pipes capacity increased by 3.4x over FY10-17 ; (ii) acquisition of Resinova adhesive business in FY15 (iii) operating margins over FY10-17 remained largely the same, at about 14-14.5%
However, FCF growth took significantly since FY18 recording a CAGR of 71% over FY18-21 on account of:
a. Margin expansion – over FY18-21, EBITDA margins expanded from 15.3% to 20.3%, driving a 27% CAGR in EBITDA compared to a 15% CAGR in revenues. The margin expansion in turn led to a strong 27% CAGR in operating cash flow over the same period. While some part of the margin expansion can be attributed to gains on inventory in a rising raw material price environment, considering Astral’s pricing power in the pipes business, we believe a large part of these gains will sustain over the longer term also.
b. Scaling up of operations – Over FY10-17, Astral was adding capacities to build a pan-India manufacturing footprint. As a result, it spent on an average, 90% of operating cash flows in adding or expanding capacities in the west, north and south simultaneously. Once these regional capacities were completed, need for incremental capex was largely limited to establishing a plant in the East and for smaller brownfield expansions in existing locations. At the same time, the already established capacities started ramping up production and contributing to profitability. Hence, over FY18-21, capex as a proportion of operating cash flow was just approx. 53% vs 90% from FY10-17.
c. Significant reduction in working capital days from 56 days (closing) in FY18 to 23 days in FY21-end on account of a reduction in receivables as well as inventories. The reduction in receivables was achieved through active measures at improving collection efficiency. These included initiatives on the technology front, of connecting the distribution channel with the company’s IT systems to make inventory movement and collections more seamless. The company also introduced channel financing schemes to realise cash from sales sooner while allowing the channel access to competitive cost funding.
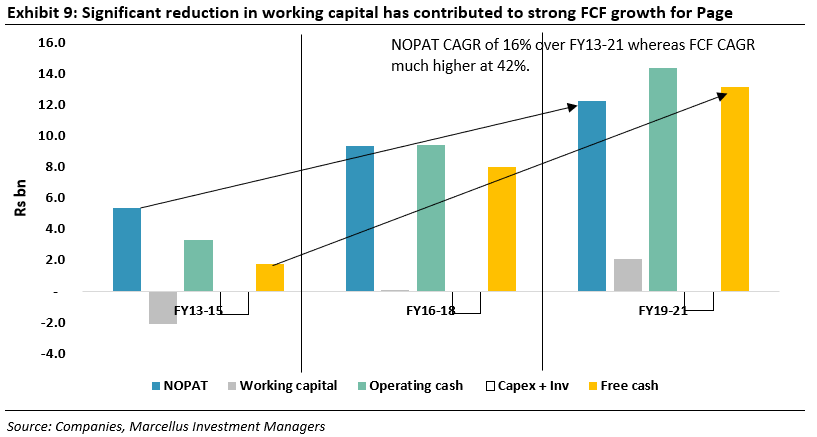
- Page Industries: Inventory reduction drives FCF compounding
The complexity of Page’ supply chain has increased over time due to the launch of new SKUs and increasing focus on adjacencies like women innerwear (which has by itself has a wider range of SKUs vs men innerwear), athleisure/outerwear and more recently kidswear. To overcome this challenge, Page has made significant tech investments around sales force automation to capture granular sales data, data analytics for demand forecasting and supply chain tools like ‘BlueYonder’ for better planning. As a result, despite increasing complexity due to more SKUs, Page’s inventory days have reduced from around ~95 days at FY15-end to ~71 days at FY21-end. Hence, compared to revenue CAGR of 11% over FY15-21, operating cash of Page has witnessed 25% CAGR and FCF 35% CAGR.
On the other hand, there have been some exceptions to strong FCF compounding in recent years within the RG portfolio. For instance, Suprajit’s FCF CAGR has declined by 11% CAGR over FY18-21 due to muted growth (flat over FY18-21) in operating profits brought upon by slowdown in auto industry while the Company continued to reinvest in the business.
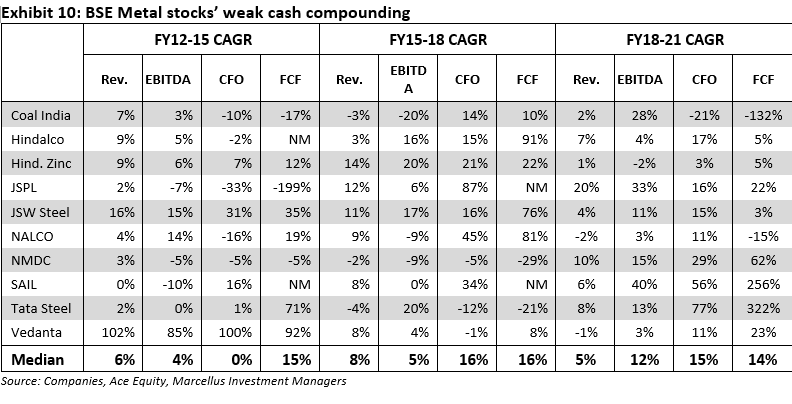
Whilst growth in revenues is an important driver of growth in FCF, mere top-line growth which is unaccompanied by margin improvement, working capital reduction and increase in assets turnover doesn’t bring in the non-linearity in FCF growth. For instance, for the BSE Metal index stocks in the below exhibit, structural issues surrounding low pricing power and high capex intensity have inhibited FCF growth across different cycles. Furthermore, despite enjoying one of the best cycles (in terms of commodity pricing) over FY19-21, nearly half of the BSE Metal index delivered less than 10% FCF CAGR pulling down the median FCF CAGR for BSE Metals index to a muted 14%. On the other hand, most RG portfolio companies thanks to market share improvement, improving product mix and efficiency measures have been able to expand their margins and bring down working capital days thus putting themselves on a strong wicket for healthy long term FCF compounding.