Given that each year 60 companies enter the BSE500, there are indeed strong economic drivers which help well run small firms explode into prominence. From an investors’ viewpoint, in the three-year run-up to entering the BSE500, new entrants outperform the index by a CAGR of 40%, indicating significant return opportunity before these stocks are discovered by institutional investors. However, at the same time, high promoter-dependency, smaller size, a propensity for accounting mischief and relatively shorter operating history necessitates much higher degree of research rigour and diligence from investors. At Marcellus, the key objective of our small cap “Little Champs” Portfolio is to own a portfolio of about 15 sector leading franchises with stellar track records of capital allocation, clean accounts and high growth potential. We expect our robust in-house forensic and capital allocation frameworks together with our team’s experience in forensic accounting and our vast network of primary data sources to help us achieve this objective.
The case for small-cap investing
Successful niche focussed MSMEs have been the biggest wealth creators of the past decade
The best performing stocks on earnings growth as well as share price returns in recent years have been names relatively unknown until a decade ago. For instance, of the top 10% of best performing stocks over FY09-19, ~80% are stocks which ranked below the 500th largest stock in India on market capitalisation as at March 2009-end. This is also evident in the significant churn in BSE500 (average ~12% p.a. over the last ten years) as these high performing small caps replace the incumbent laggards. Given that each year nearly 60 new names enter the BSE500, such a trend points towards underlying economic drivers which help well run small firms explode into prominence.
The three common stories across these champion small caps which have grown from near obscurity to prominence over the last decade have been:
(i) Businesses that were earlier local in nature, became regional and finally gained national presence. The success template here has been to build a pan-India brand, a national distribution network and thereby chipping away market share from the unorganised local players and/or grow the addressable market pie (example – Kajaria Ceramics and La Opala).
(ii) Businesses that were successful in replicating their leadership in one category across multiple categories. This has been driven by profitably deploying the cashflows from the core businesses into adjacencies i.e. a new product segment (examples – Supreme Industries, Astral Poly); and
(iii) Businesses that were able to successfully capture a significant part of the global pie. These not only include export-oriented companies but also players able to substitute high level of imports into India (examples – Vinati Organics, AIA Engineering and Garware Technical Fibres). [Please note that the stocks named here are NOT necessarily part of our Little Champs Portfolio.]
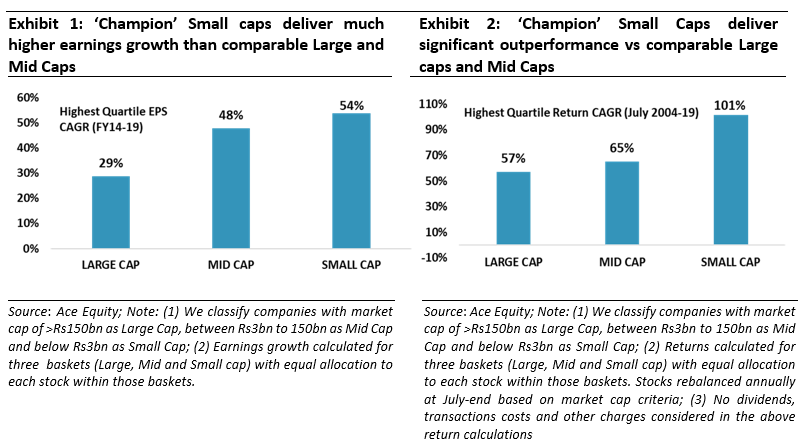
These successful firms have mostly focussed on small niches within a much larger market. They have been able to build market dominance in their niches, command pricing power, expand the niches and resultantly generate healthy earnings growth and returns on capital. The financial performance of these smaller firms has been clearly better than: (a) most mass-market companies; and (b) diversified large corporations.
Disproportionate benefits in owning these companies before their ‘discovery’
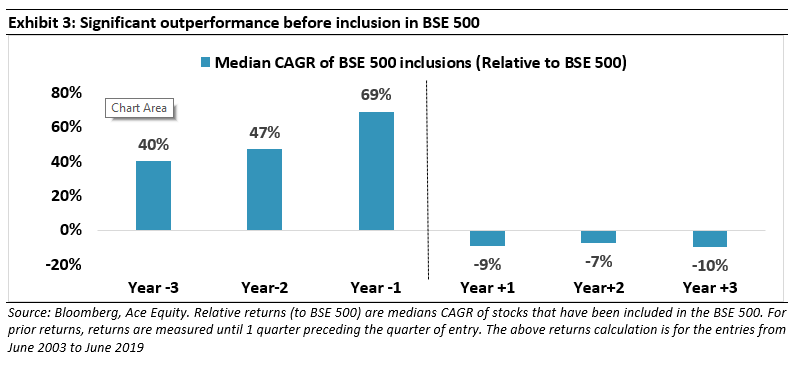
From an investors’ viewpoint, more relevant than the churn in BSE500 is the returns that these entrants into the BSE500 produce as they fly into the index. As shown in the chart below, in the three-year run-up to entering the BSE500, entrants outperform the index by a CAGR of 40%!
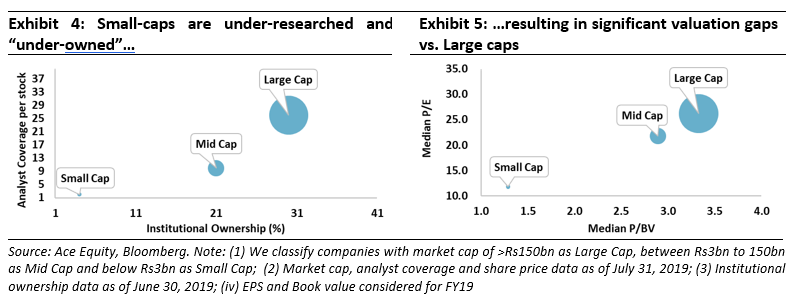
This return performance is not just a function of superior earnings growth delivered by these firms in the run-up, but also a result of their valuations getting re-rerated. When these stocks are small and still inventing the wheels of their business, they are largely unnoticed by the large investors’ and research analysts’ communities. This results in them trading at significant discounts to their larger counterparts. However, once they reach a particular size (say market capitalization above US$0.5 billion), they come under the ambit of more and more research analysts’ coverage and institutional investors’ ownership and thus move up the valuation band.
But beware of the pitfalls
It goes without saying that not every small firm will be successful and the winners will be those who have:
(a) the work ethic to grow the organisation whilst instilling a process oriented culture and orchestrating a devolution of power & responsibilities to build scale;
(b) the capital allocation skills to rationally and patiently invest in building long term competitive advantages; and
(c) the skill and the drive to run efficient manufacturing operations with tight working capital cycles and lean cost structures.
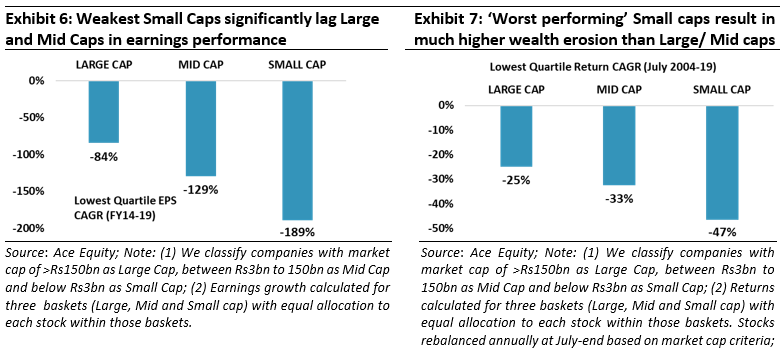
There is only a narrow set of small cap companies that have been able to pass these tests and eventually generate significant shareholders’ wealth. On the other hand, there are more examples of small cap stocks that not only failed but also ended up destroying significant investor wealth.
In particular, the risks/hardships of investing in a small cap are due to the following factors:
- Inordinate bet on the promoter’s acumen and integrity: There is relatively high dependence on promoter(s) as generally the level of institutionalisation is relatively low in the company given the stage of evolution. Hence the business acumen and integrity of the promoter(s) would play a defining role in the success/failure of these smaller companies.
- Low analysts’ coverage necessitates deeper diligence: We highlighted earlier that low level of analysts’ coverage creates a ‘valuation gap’ in small cap stocks and thus creates a non-linear share price return for successful small-caps. At the same time, lack of analysts’ scrutiny necessitates the onus of deep diligence and research on the investors.
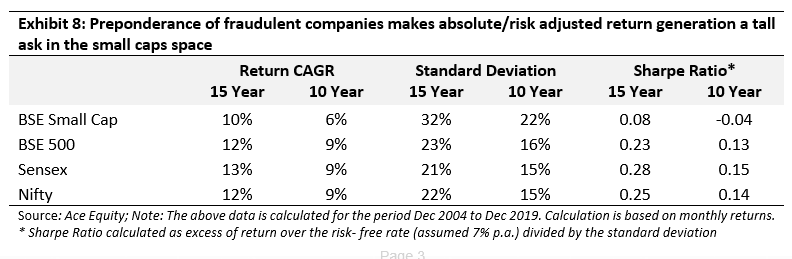
This is also a key reason why the BSE Smallcap index has significantly trailed the Sensex, Nifty and BSE500 indices in generating risk adjusted returns over the last 10- 15 years. We find that this point – that there is no pre-ordained reward for owning small-cap stocks – is not properly appreciated by most investors.
Marcellus Little Champs Investment process to navigate the tricky world of small caps
At Marcellus, the key objective of the “Little Champs” Portfolio is to own a portfolio of about 15 sector leading franchises with a stellar track record of capital allocation, clean accounts & corporate governance and at the same time high growth potential. While we intend to fill our portfolio with winners, we want to be particularly sure of staying away from dubious names where we are not convinced about the cleanliness of the accounts or the integrity of the promoters (even though business potential may sound promising) as the fruits of company’s performance may not get shared with minority shareholders. We intend to keep the portfolio churn low (not more than 25-30%) to reap the benefits of compounding as well as minimise the impact of trading costs.
We use the following process to build the Little Champs portfolio:
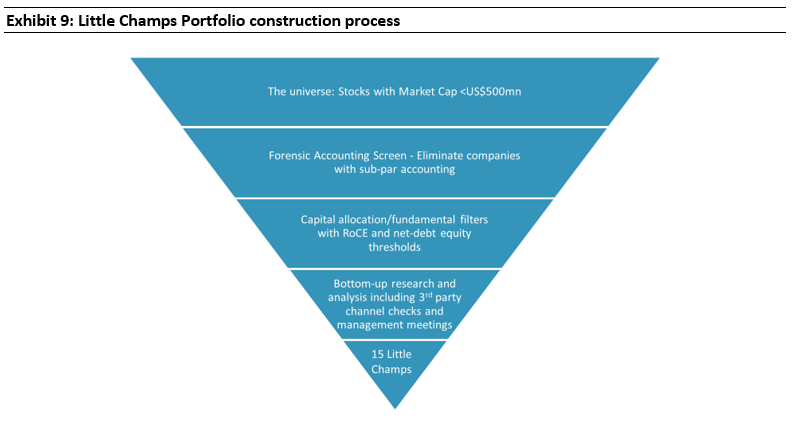
Using our in-house frameworks to shortlist high quality names: We have developed the following rigorous screening frameworks to help shorten the large universe of ~1,200 small cap companies into a researchable universe of 40-50 companies.
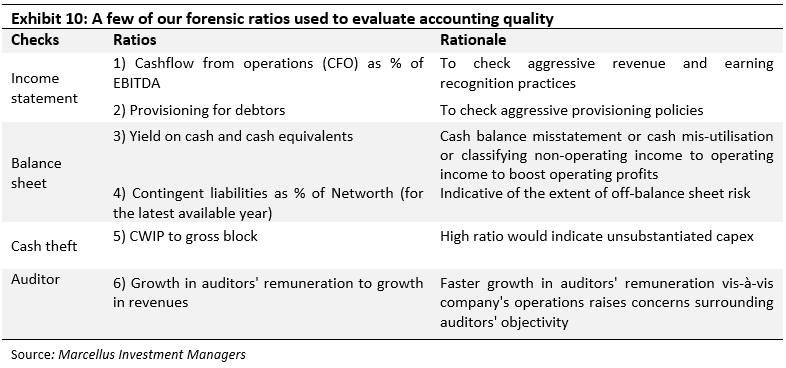
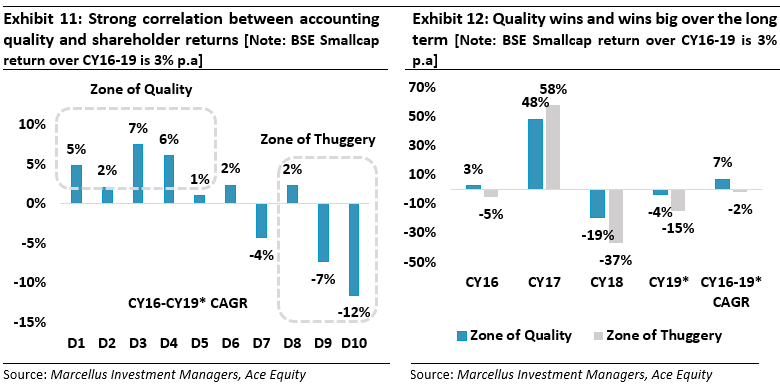
- Our forensic accounting framework: Evaluating the accounting quality of a company needs to be a cornerstone of any investment process in India. We at Marcellus have developed a set of 12 ratios that help to grade companies on their accounting quality. The selection of these ratios has been inspired by Howard M. Schilit’s legendary book on forensic accounting called ‘Financial Shenanigans’. These 12 forensic accounting ratios covers checks around key financial statement categories like income statement (revenue/ earnings manipulation), balance sheet (correct representation of assets/liabilities), cash pilferage and audit quality checks. Some of these key ratios and rationale are shown in the exhibit below. We look at the historical consolidated financial statements for the universe of firms. We first rank stocks on each of the twelve ratios and give a final decile-based pecking order on accounting quality for stocks – with D1 being the best on accounting quality and D10 being the worst. The top 5 deciles i.e. D1 to D5 are generally indicative of a company with good accounting quality/practices – we call D1 to D5 the ‘Zone of Quality’ whereas the bottom 30% i.e. D8 to D10 generally represent companies with questionable accounting practices – we call this the ‘Zone of Thuggery’.
Our forensic accounting framework has proven to be a highly effective predictive tool. Over longer term, there has been a strong correlation between the accounting quality as suggested by our forensic model and the shareholders returns. For instance, the ‘Zone of quality’ has outperformed the ‘Zone of thuggery’ by a whopping 10% p.a. over CY16-19.
For more details on how we assess accounting quality, click here for our December 2019 newsletter
2. Our competitive advantage/capital allocation framework uses financial parameters like revenue growth, improvement in margin, working capital & fixed assets turnover with certain thresholds on RoCE and net debt to rank the companies. Essentially, this framework helps us to identify companies which demonstrate ability to grow efficiently, generate cash and redeploy them to further grow – in essence, a self-sustaining cash machine.
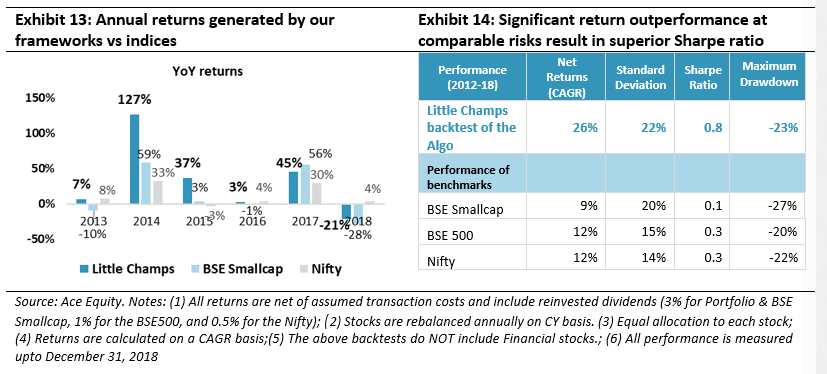
We have backtested the above frameworks for several years and the results have shown that the portfolio generated by the algorithm alone (i.e. without any human intervention) has not only expectedly outperformed the BSE Sensex (the benchmark) during periods of market downturn but also generally outperformed or matched the benchmark performance during market upturns. Given, the logical rule of compounding – i.e. if you fall less and rise equally – you reach higher – the framework has generated significant outperformance over December 2012-December 2018.
- In-depth research and diligence from a seasoned team of analysts: The stocks shortlisted by our screening frameworks are then taken up for deep dive research and diligence by the seven analysts in our team. Besides analysis of the published financials and other secondary data, we aim to build insights into the companies through interacting with a host of primary data network sources. Here, we draw upon our following strengths:
- Forensic accounting skills– We have a deep pool of accounting talent in our team with every single one of our seven analysts being qualified Chartered Accountants and/or Chartered Financial Analysts who have cumulatively done more than 1,000 bespoke accounting projects over the last ten years.
- Access to primary data and insights– The team has built a pan-India network of primary data sources which include dealers, distributors, promoters, ex-employees, customers, vendors etc.
Besides getting comfort on the management’s integrity and corporate culture, our diligence is also focussed towards finding the sources of the competitive advantages of these companies, their track record of dealing with technological or competitive disruptions and the wisdom of their capital allocation decisions. Here, the lessons from Hermann Simon’s celebrated ‘Hidden Champions’ framework form an important part of our checklist for such qualitative assessment of stocks. This is particularly with regards to sources and sustainability of the competitive advantages (quality of market leadership, innovation, customer-orientation, work culture), management capability/continuity (organisational leadership, work culture) and capital allocation (focus, self-financing, soft diversification).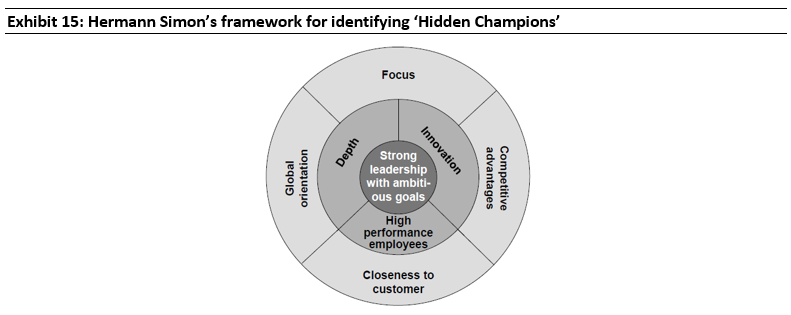
For more details on Simon’s Hidden Champions framework, refer our November 2019 newsletter (Click here).
At this stage we bring down the 40-50 names shortlisted by our frameworks to around 15-20 names which we usually end up investing in.
- Continuous monitoring and evaluation: The portfolio names are subject to continuous monitoring (keeping a tab on results, continuing to meet customers, competitors and suppliers of these companies whilst maintaining regular contact with management) of major developments. We do not put much weightage on short-term factors like weak quarterly earnings. However, we would not desist from reacting in case of any structural changes in the company like key management changes (where we think the new management is not of the same pedigree as the earlier one), any capital allocation decisions that seems out of order or any corporate governance steps that does not seem to be in the best interests of the minority shareholders.
Marcellus Little Champs portfolio characteristics and comparative analysis
As of today, we have a total of 14 stocks in our Little Champs portfolio with equity allocation of close to 88%. While our stock selection is purely bottom-focussed, no single sector constitutes >20% of invested corpus.
Backtesting results show that over the last 5 years (FY14-19) in a seemingly tough period for macro-economic environment and corporate earnings, the Little Champs portfolio has, on a median basis, delivered a net earnings CAGR of 22%. This earnings growth has been combined with a reasonably healthy average RoCE (pre-tax) of 20%. The exhibit below gives the key statistics for the Little Champs at the overall portfolio level.
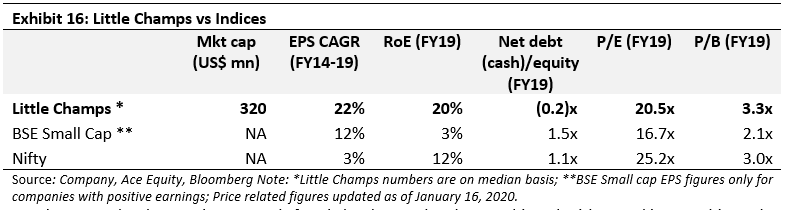
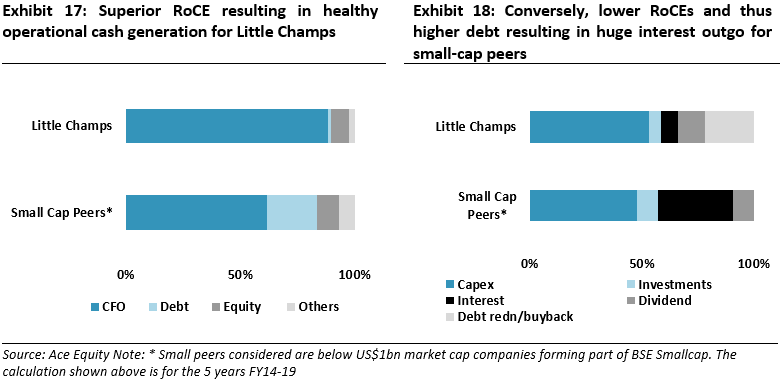
Most importantly, the earnings growth for Little Champs has been achieved without taking any big undue capital allocation bets. On an average, over the last five years, Little Champs have re-invested close to 60% of their cash back into business primarily through capex and, to a smaller extent, by acquiring other companies. This reinvestment rate is more or less similar to their small cap peers.
However, the stark difference comes out when one compares the ‘source’ of cash. For Little Champs, superior RoCEs resulted in healthy operational cash flow which in turn has been utilized towards not only reinvesting in the business but bring down the debt levels to almost NIL. On the other hand, for the small cap peers, lower RoCE and consequent lower operational cash generation (60% of total cash raised), resulted in significant reliance on debt (>20%). Besides the weak macros, meeting the debt servicing requirements has also been one of the key reasons for weak earnings growth of small cap companies over the last few years.
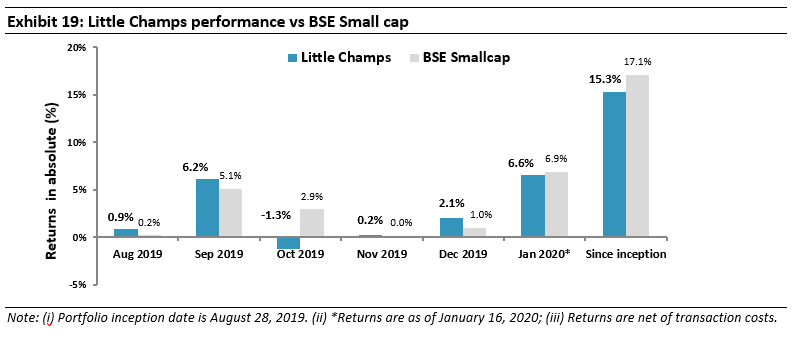
Performance update of the live Little Champs Portfolio
The Little Champs Portfolio went live on August 28, 2019. The performance so far is shown in the below table.
Regards
Team Marcellus
If you want to read our other published material, please visit https://marcellus.in/blog/

