45% of the stocks which were in the BSE500 ten years ago have exited the index since. The primary driver of these exits is shoddy corporate governance and poor capital allocation (the two are linked). In contrast, the number of companies which have significantly enriched their shareholders are a handful. Inspired by Howard Schilit’s legendary book on forensic accounting ‘Financial Shenanigans’ (fourth edition, 2018), we at Marcellus use 12 powerful forensic ratios to evaluate the accounting qualities of Indian companies. This framework has proved to be an effective predictive tool with strong correlation between its accounting quality results and investment returns. Besides these ratios, we also employ an exhaustive checklist for qualitative due diligence on accounts and corporate governance. In this newsletter, we also highlight a case study of how investors would could have avoided Amtek Auto using cues from its financial statements.
“It has been far safer to steal large sums with a pen than small sums with a gun” – Warren Buffet
Avoiding dubious companies is as important as identifying great companies
In our October 2019 newsletter on Little Champs, we highlighted that churn in the BSE500 is as high as 12% p.a. This high churn ratio signifies that most existing incumbents are unable to sustain their place in the index and, over the course of a decade, make way for more deserving candidates. A closer analysis of the stocks exiting the BSE500 over the last 5 to 10 years indicate that most exits had little to do with business downturns but were mainly due to corporate governance/accounting lapses and capital misallocations at these firms.
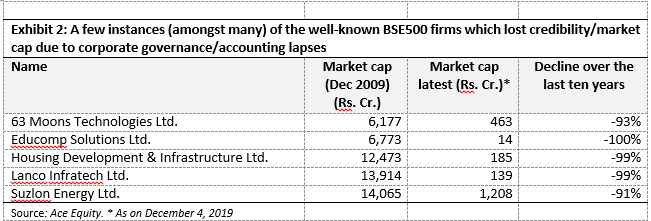
If one were to look at BSE500 as it stood in December 2009, out of the total 500 member stocks then, only 274 stocks continue to remain in the index. In other words, nearly 45% of the stocks have exited the index over the last ten years. On their way out, most of these stocks saw significant erosion in their shareholders’ wealth (on an average, the companies which exited the index have lost 40% of their December 2009 market cap). Hence, for every Bajaj Finance and Eicher Motors which significantly enriched their investors, there has been an Educomp and Lanco Infratech which left their minority shareholders high and dry.
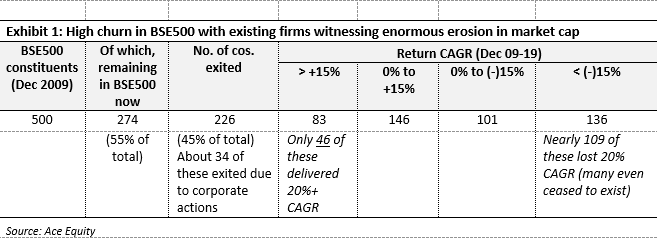
While the number of companies which have generated enormous wealth for their shareholders are bound to be a handful, the number of companies which have destroyed shareholders’ wealth would be much more. Hence, the ability to stay away from dubious names is equally if not more important than the ability to discover a great company.
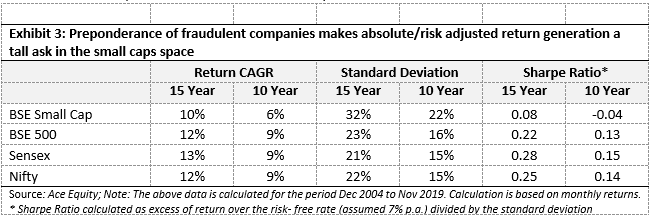
Evaluating accounting quality becomes all the more important for small caps
While the reward is enormous for picking the right small cap stocks, the associated risks and rigour required are manifold compared to that in the large cap and even mid cap space for that matter. In particular, the risks/hardships of investing in a small cap are due to the following factors:
- Inordinate bet on the promoter’s integrity: There is relatively high dependence on promoter(s) as generally the level of institutionalisation is relatively low in the company given the stage of evolution. Hence the business acumen and integrity of the promoter(s) would play a defining role in the success/failure of these smaller companies.
- Inadequate coverage by brokerage analysts necessitates deeper diligence: We highlighted in our October 2019 note that low level of analysts’ coverage creates a ‘valuation gap’ in small cap stocks and thus creates an opportunity for non-linear share price returns from successful small-caps. At the same time, lack of analysts’ scrutiny puts the onus of deep due diligence and research on the investors.
In Exhibit 1, we highlighted the significant level of underperformers in the BSE500. This number would be even higher for a small cap index like BSE Smallcap. This is also a key reason why the BSE Smallcap index has significantly trailed the Sensex, the Nifty and the BSE500 in generating risk adjusted returns and for that matter even absolute share price returns over the last 10/15 years.
Quality may take a backseat momentarily but always makes a comeback
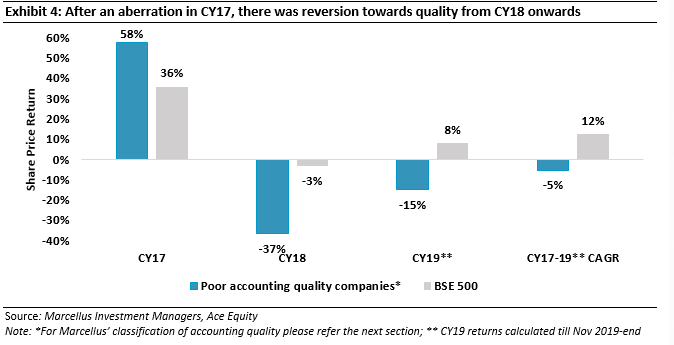
In the long run, high accounting quality and efficient capital allocation define investment success. A look at longer-term stock returns suggests a direct relationship between better accounting quality and superior stock performance. In the shorter run, however, markets do have a tendency to test investors’ patience even if the investor is using the most time tested and rational investment methods. Hence during this period of irrational exuberance and abundant liquidity, where there is a pressure to chase near terms returns, quality does take a backseat. Take the instance of the bull market of CY17 which saw speculative excesses being created in lower quality stocks.
However, things changed with the onset of CY18. As the cost of capital rose, liquidity started drying up and equity markets turned volatile. This, in turn, made investors more selective. Recurring news flow on auditor resignations further spooked investors through CY18. All of this, in turn, brought the focus back on accounting quality. This has resulted in good quality companies outperforming their poor-quality counterparts by a considerable margin in CY18 and continuing to do so in CY19.
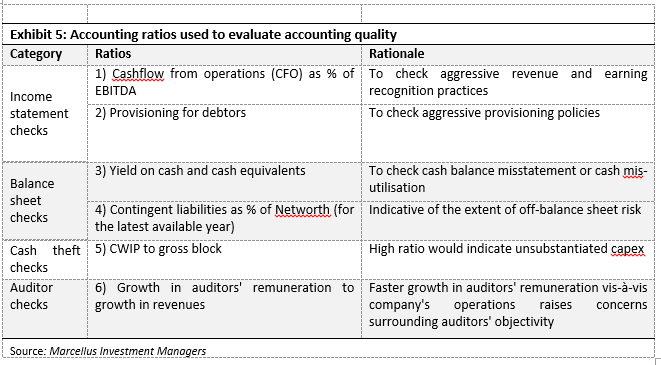
Marcellus’ forensic framework to evaluate accounting quality
These 12 forensic accounting ratios covers checks around key financial statement categories like income statement (revenue/ earnings manipulation), balance sheet (correct representation of assets/liabilities), cash pilferage and audit quality checks. Some of these key ratios and rationale are shown in the below exhibit. We look at the historical consolidated financial statements for the universe of firms. We first rank stocks on each of the twelve ratios and give a final decile-based pecking order on accounting quality for stocks – with D1 being the best on accounting quality and D10 being the worst. The top 5 deciles i.e. D1 to D5 are generally indicative of a company with good accounting quality/practices – we call D1 to D5 the ‘Zone of Quality’ whereas the bottom 30% i.e. D8 to D10 generally represent companies with questionable accounting practices – we call this the ‘Zone of Thuggery’.
Our forensic framework has proven to be an effective predictive tool
Over the longer term, there has been a strong correlation between the accounting quality as suggested by our forensic model and the shareholders returns. For instance, the ‘Zone of quality’ has outperformed the ‘Zone of thuggery’ by a whopping 9% p.a. over CY16-19.
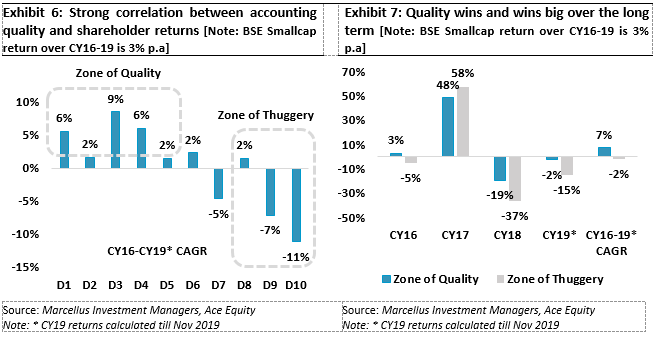
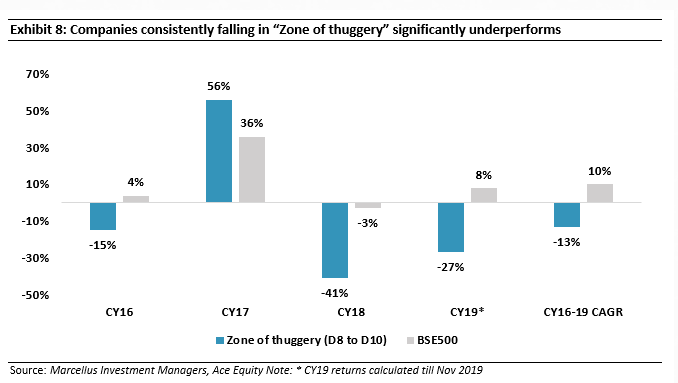
There is another way to understand the effectiveness of this forensic model – there are around ~53 companies (out of the BSE 500) which constantly featured in D8 to D10 rankings in our accounting model for the years FY2015-18. Over CY16-19, these companies have on an average delivered negative CAGR of 13% compared to benchmark BSE 500’s 10% i.e. an underperformance of nearly 23% p.a.
Beyond the forensic screens
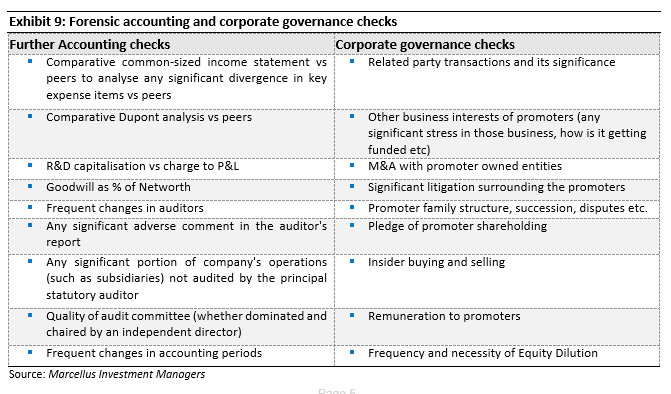
Our forensic framework helps us to weed out companies with dubious accounting quality. It also helps us identity the key accounting red flags for a company. However, our quest for accounting quality does not end there. There are several qualitative aspects of accounting and corporate governance which our forensic model may not be able to pick up due to lack of data uniformity across companies or where there are subjective judgements involved. Such areas can only be evaluated through a deep dive into historical financial statements and primary data checks around management integrity.
We have developed the following checklist for further accounting and corporate governance checks beyond the forensic model. This checklist forms an essential part of the qualitative assessment of stocks
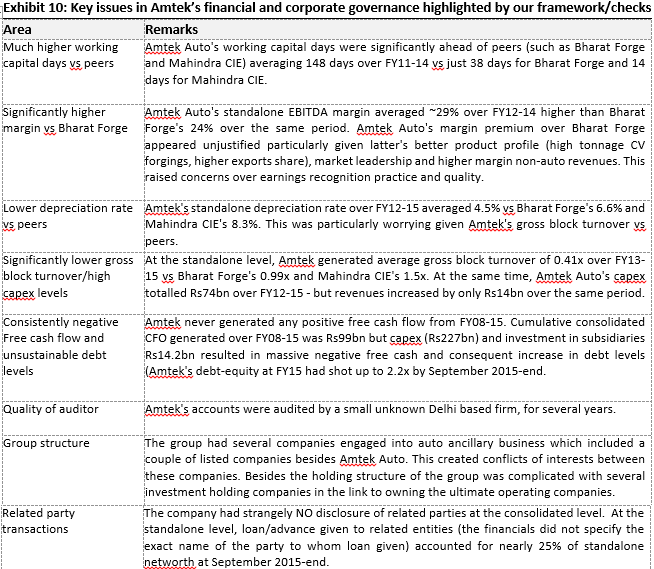
Case study – Amtek Auto
We produce below our first-hand experience of analysing Amtek Auto’s financial statements a few years ago. The stock looked extremely cheap on valuation multiples with very high margin profile but a very weak balance sheet. Our analysis pointed towards multiple glaring issues in its financials. We went on to be proved right on most of these things.
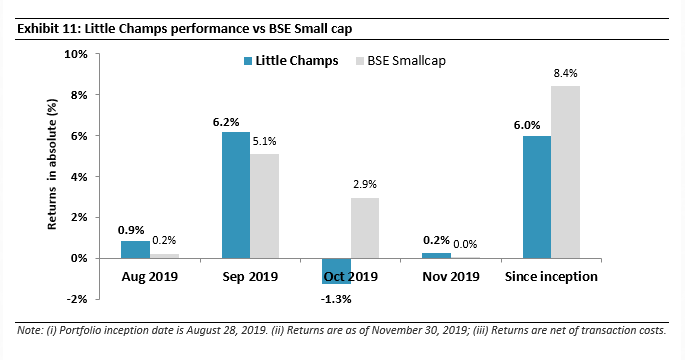
Little Champs Performance update
Regards
Team Marcellus
If you want to read our other published material, please visit https://marcellus.in/blog/
Note: the above material is neither investment research, nor investment advice. Marcellus does not seek payment for or business from this email in any shape or form. Marcellus Investment Managers is regulated by the Securities and Exchange Board of India as a provider of Portfolio Management Services and as an Investment Advisor.

