An investor looking to buy and hold stocks over a long time period, needs to be able to differentiate between businesses which can deliver longevity of consistently healthy free cashflows and those that run a high degree of uncertainty in their fundamental prospects. This differentiation is essential, both, in order to avoid premature exits from investments in great quality franchises due to concerns around expensive valuations (e.g. P/E multiples higher than 30x), and to avoid being tempted into investing in inferior quality franchises just because they are trading at apparently cheap valuations (a 10x P/E multiple might actually be super-expensive). Following on from our analysis published in the 2nd July 2019 newsletter (click here), this newsletter quantifies the impact of longevity on valuations of a franchise compared to conventional valuation methodologies.
Performance update – as on 31st December 2019
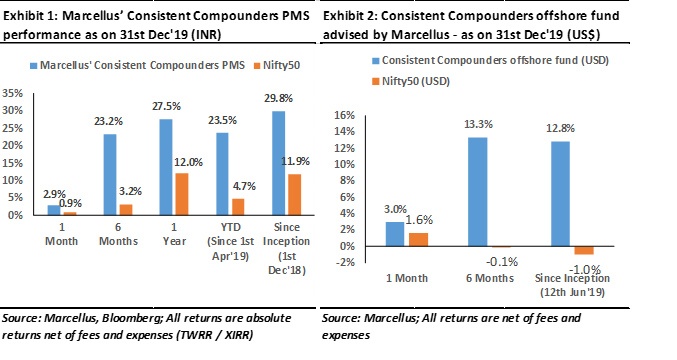
We have a coverage universe of around 25 stocks, which have historically delivered a high degree of consistency in ROCE and revenue growth rates. Our research team of five analysts focuses on understanding the reasons why companies in our coverage universe have consistently delivered superior financial performance. Based on this understanding, we construct a concentrated portfolio of companies with an intended average holding period of stocks of 8-10 years or longer. The latest performance of our PMS and offshore fund (USD denominated) portfolios is shown in the charts below.
Challenges with using the conventional DCF approach for valuing companies in India
Let’s start with a simple analogy. The table below provides a comparison of annual premium payable for a term-life insurance cover of 40 years duration based on the age of the insured at the start of the period (all other details of the cover being the same).
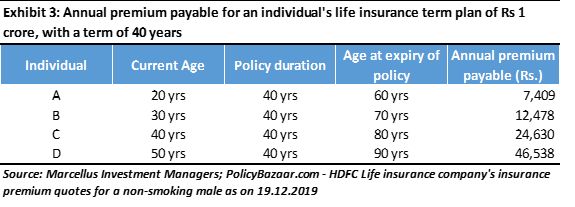
The reasons behind the differential in premiums shown in the table above are obvious – Individual A (aged 20 years today) runs a lower risk of mortality over the next 40 years (i.e. before he turns 60 years old), compared to Individual D (aged 50 years today and hence turning 90 years old at the end of the term insurance period). This valuation approach (and hence annual insurance premium payment) is easy to estimate because of the tangible evidence available regarding the human body’s longevity and hence mortality risk, based on the current age of an individual. As a result, the mortality risk of Individual D is valued with 6x annual premium payment compared to that of Individual A.
However, when it comes to drawing parallels with a business, its longevity and the corresponding impact on valuations, the conventional approach to DCF (and hence P/E multiples) fails to adopt this differentiation. A typical three stage DCF (i.e. the conventional approach to value a business) includes the following three stages of business in future:
-
Stage 1 – Steady business prospects:
Most investors forecast steady financials (and hence cash flows) of a company over the next 3-5 years, based on their current understanding of the business. It is rare to see an analyst or an investor to expect the Stage 1 of the DCF to last for either 1 year (“I don’t think the world will come to an end for the said company within a year!”), or for as long as 10-15 years (“I don’t have a crystal ball; who knows what the world will look like after 5-7 years!”).
-
Stage 2 – Fade from steady growth to terminal growth:
Given the uncertainties that a business faces over the longer term, analysts or investors fade out the financials growth rates of a company over a 8-10 year period (which starts after the completion of Stage 1).
-
Stage 3 – Terminal value:
Assuming the business remains a going concern, but grows only in line with the broader macro, Stage 3 of a DCF involves forecasting cash flows to grow at a certain rate (4-5% CAGR typically) until perpetuity.
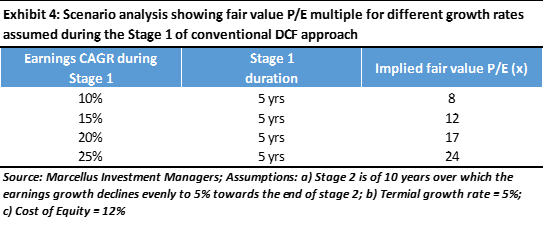
Using this construct, as shown in the table below, the outcome of the valuation exercise on a company results in a tight band of P/E multiples regardless of the quality of the franchise that the firm possesses. A firm which is expected to deliver 10% earnings CAGR (and cashflows CAGR) over a five-year period of Stage 1 has an implied fair value P/E multiple of 8x. And another firm which is expected to deliver 25% earnings CAGR in Stage 1 has an implied fair value P/E multiple of 24x. Since typically a quick look at most companies (basis a meeting with the management team or some other short-cut towards understanding the company’s financials) points towards earnings growth at a rate somewhere between 10% CAGR and 25% CAGR, the band of P/E multiples which becomes psychologically acceptable for the fair value of a firm is 8x-24x typically. Firms trading at valuations lower than this band appear to be cheap and those trading at valuations above this band appear to be expensive.
However, the biggest challenge with the DCF approach explained above, is the rigidity of duration of Stage 1. This rigidity works both towards massive over-valuation as well as towards under-valuation, as explained below:
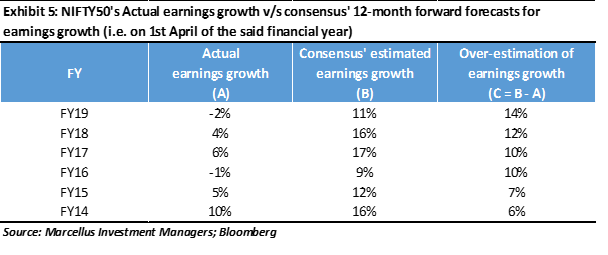
- Over-valuation through Stage 1 of the DCF: As shown in the table below, over the past six years, Bloomberg consensus forecasts (average of forecasts published by various brokerages) have consistently over-estimated the 12-month forward earnings growth of Nifty50 Index by an average of 10%.
Moreover, amongst the index constituents, there have been several firms (e.g. some banks, NBFCs, telecom companies etc) whose Stage 1 of the DCF should not have been longer than 2-3 years given the amount of business risk that they were exposed to (many of these businesses are struggling to survive now). This over-estimation is because the conventional approach towards conducting research on a firm (management meeting, reading a couple of years of annual reports, reading a few broker notes, press articles and doing some ground level channel checks) isn’t enough to forecast a bleak outlook over the short term for any business.
-
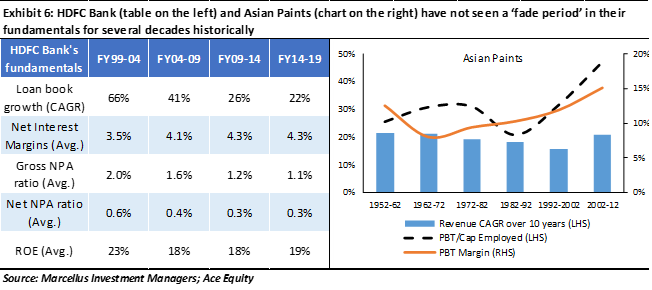
- Under-valuation through Stage 1 of the DCF: There have been some businesses historically which have not seen a ‘fade period’ (i.e. no end to the Stage 1 of the DCF) in their business growth prospects for several decades on end. In effect, they have delivered the ‘Stage 1 of the DCF’ for time periods lasting several decades in a highly consistent manner. Two of the best examples of such longevity have been Asian Paints and HDFC Bank – see exhibits below. The conventional valuation approach of assuming 3-5 years’ time period in Stage 1 of the DCF, throughout their history, would have significantly under-estimated the longevity of earnings growth and cash flows of these consistent compounders.
Quantifying the valuation impact of changes to longevity assumptions of a business
We believe it is impossible to accurately forecast the future of any business. Hence, it would have been impossible for an investor in Asian Paints, 40 years ago, to accurately forecast the longevity of the franchise four decades into the future (and ongoing). Similarly, it would have been highly speculative for an investor to forecast longevity of HDFC Bank in 1995 or of Bajaj Finance in 2008 given the state of their businesses at that time (HDFC Bank was a startup in 1995 and Bajaj Finance was a struggling NBFC in 2008).
However, here are some of the tools that can be used to add at least 8-10 years or reduce 2-3 years from the conventional 5-years’ time period of Stage 1 of the firm’s DCF by using a deep-dive research approach:
-
Evidence of accounting fraud–
which should lead to a substantial reduction in expected longevity of the franchise given the unsustainable nature of its operations. For such a business, even a 10x P/E multiple is over-valued. There was, for instance, 5 years ago abundant evidence of naughty accounting tactics used by several large listed Indian lenders. Investors who ignored this evidence paid a heavy price. To understand how we assess accounting quality, click here for a recent newsletter we published for our Little Champs PMS (click here).
-
Understanding of the DNA of the organization (predominantly based on historical evidence around the softer aspects of the business)–
which reduces the probability of the business to self-destruct. For instance, a firm which has repeatedly demonstrated institutionalization of operations through systems and processes, empowerment of professional with a strong employee culture, succession of promoters / management team, prudent capital allocation decisions etc – deserves greater longevity assumptions than what is commonly assumed in conventional valuation methodologies. In contrast, promoters who centralize power and decision-making, severely reduce the longevity of the Stage 1 period.
-
Deep understanding of ‘sustainability’ of the moats of an organization–
which reduces the probability of external disruptions that could de-rail the longevity of a franchise. Admittedly, this is hard to do. Even with our first rate research team and even with the many decades of experience that we have of doing this and the access that we enjoy to an array of top experts in India, we have to work very hard to assess the “sustainability” of the moats around a business. You will find in “The Unusual Billionaires” (2016) many of the tools we bring to bear to assess the sustainability of moats.
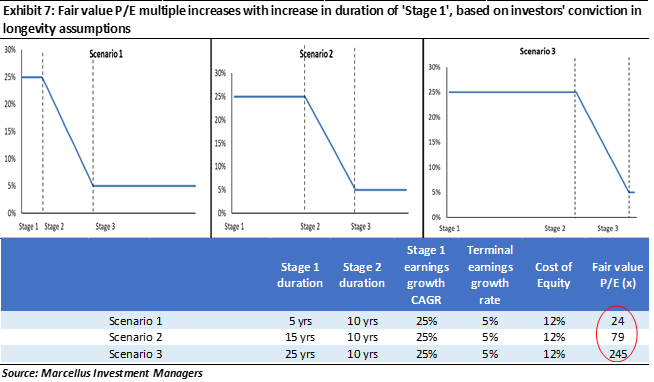
These tools (and more) might not be able to accurately forecast longevity of the business, but they can certainly be used to add a decade (or two) to an investor’s conviction on longevity assumptions of a consistent compounder. The charts below illustrate that for a firm compounding earnings at 25% annually, an addition of 10 years to Stage 1 of the DCF (all else being unchanged) increases the fair value P/E multiple of a firm from 24x to ~80x. Similarly, addition of 20 years to the Stage 1 of the DCF increases the fair value P/E multiple 24x to 250x.
This is similar to the life-insurance term-plan analogy used in exhibit 3 above where the reduction in mortality risk of the insured led to a substantial reduction in annual premium payable. This is also similar to the analysis provided in our 2nd July 2019 newsletter (click here) where exhibit 3 shows how fair value P/E multiple (vertical axis) rises with an increase in ROCE and reinvestment rate (and hence earnings growth) if one factors in the longevity of 20 years for a business.
Investment implications
For an investor looking to buy and hold stocks over a long time period, a research process which doesn’t lead to substantial differentiation in longevity assumptions of a franchise will not be able to deliver healthy investment performance. This is because such an investor might make a premature exit from their investment in a great quality franchise due to concerns around expensive valuations, and the investor might also get attracted towards inferior quality franchises just because they are trading at apparently cheap valuations (when a 10x P/E multiple could also be super-expensive).
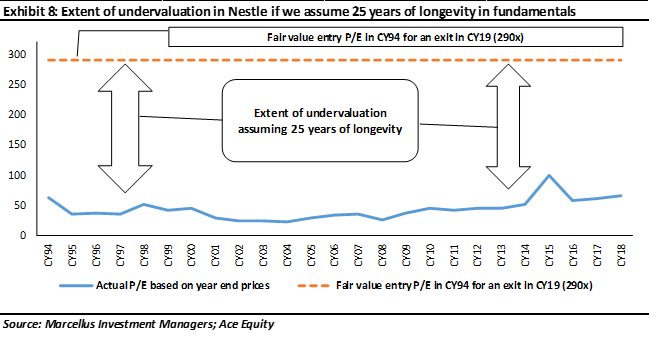
As highlighted in our 2nd July 2019 newsletter (click here), investment in Nestle India at 290x P/E multiple in 1994 and exit at today’s price, would have delivered shareholder returns in line with Sensex. Hence, in 1994 Nestle’s fair valuation P/E multiple was 290x! In the interim though (i.e. during 1994-2019), Nestle India’s traded P/E multiple oscillated between 65x in FY1995 (and 67x in FY2019) and 22x in FY2005 – see exhibit below. An investor who factored in the longevity of a decade or longer for Nestle India’s financials, would have found its share price undervalued at both 22x P/E multiple as well as at 65x P/E multiple.
 Marcellus’ Consistent Compounders Portfolio (CCP) consists of companies which we believe possess a DNA which helps sustain and evolve these firms’ competitive advantages in a manner which is likely to deliver healthy and consistent earnings and cash flows over the longer term in future. The weighted average FY20 P/E multiple of our portfolio is 50x currently (~4% lower than FY19 P/E for the same portfolio, using 31st March 2019 share prices). Although this P/E multiple appears punchy based on the conventional DCF methodology illustrated in exhibit 7 above, we believe that this P/E multiple understates the value of expected longevity of healthy earnings (and cash flows) compounding of our portfolio companies.
Regards
Team Marcellus
If you want to read our other published material, please visit https://marcellus.in/
Note: the above material is neither investment research, nor investment advice. Marcellus does not seek payment for or business from this email in any shape or form. Marcellus Investment Managers is regulated by the Securities and Exchange Board of India as a provider of Portfolio Management Services and as an Investment Advisor.
Copyright © 2019 Marcellus Investment Managers Pvt Ltd, All rights reserved.
This communication is confidential and privileged and is directed to and for the use of the addressee only. The recipient if not the addressee should not use this message if erroneously received, and access and use of this e-mail in any manner by anyone other than the addressee is unauthorized. If you are not the intended recipient, please notify the sender by return email and immediately destroy all copies of this message and any attachments and delete it from your computer system, permanently. Any opinions or advice contained in this email are subject to the terms and conditions expressed in a duly executed contract or written agreement between Marcellus Investment Managers Private Limited and the intended recipient. No liability whatsoever is assumed by the sender as a result of the recipient or any other person relying upon the opinion unless otherwise agreed in writing. The recipient acknowledges that Marcellus Investment Managers Private Limited may be unable to exercise control or ensure or guarantee the integrity of the text of the email message and the text is not warranted as to its completeness and accuracy.

