A stock trading at a P/E multiple of 50x could be cheaper than one trading at 15x P/E multiple, even if both stocks deliver the same profit growth. This is possible due to factors such as superior capital efficiency (measured by Return on Capital Employed) and greater longevity of free cashflow compounding. Moreover, a focus on improving capital efficiencies incrementally over time justifies a higher P/E multiple for a company compared to its own historical P/E. Almost all companies in Marcellus’ CCP portfolio exhibit such characteristics. Discounted Cashflows (rather than P/E multiples) clearly capture these characteristics in the valuation of Consistent Compounders.
Performance update – as on 30th September 2022
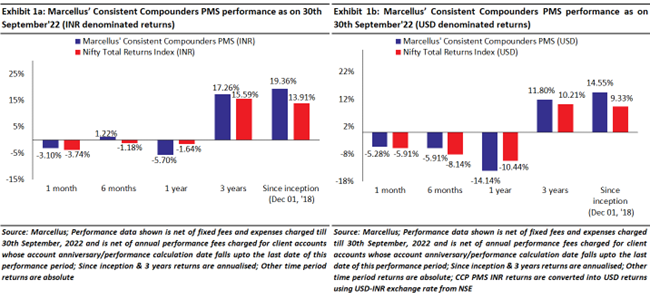
We have a coverage universe of around 25 stocks, which have historically delivered a high degree of consistency in ROCE and revenue growth rates. Our research team focuses on understanding the reasons why these companies have delivered healthy and consistent historical track record and which of these companies are likely to sustain their superior financial performance in future. Based on this understanding, we construct a concentrated portfolio of companies with an intended average holding period of stocks of 8-10 years or longer. The latest performance of our PMS portfolio is shown in the charts below.
Two commonly found delusions surrounding P/E multiples-based valuation
Delusion #1: P/E multiple comparison for the same rate of profit growth
Let’s take two stocks – A and B.
- Stock A trades at a P/E multiple of 15x while Stock B trades at a P/E multiple of 50x.
- Underlying businesses for both these stocks are expected to grow their earnings (profits) at 8% CAGR.
With this information, an investor might hastily conclude that given the same earnings growth rate of both these businesses, Stock B is trading at expensive valuations vis-à-vis Stock A, and hence Stock A is a better investment. This is not necessarily a correct conclusion.
What the metrics above fail to consider is the ‘capital efficiency’ of the underlying business. The intrinsic value of any stock is derived from the present value of its expected free cash flows. Such free cash flows, in turn, are dependent not just on the actual earnings growth of the business but also on how efficiently the company uses its capital to generate such growth.
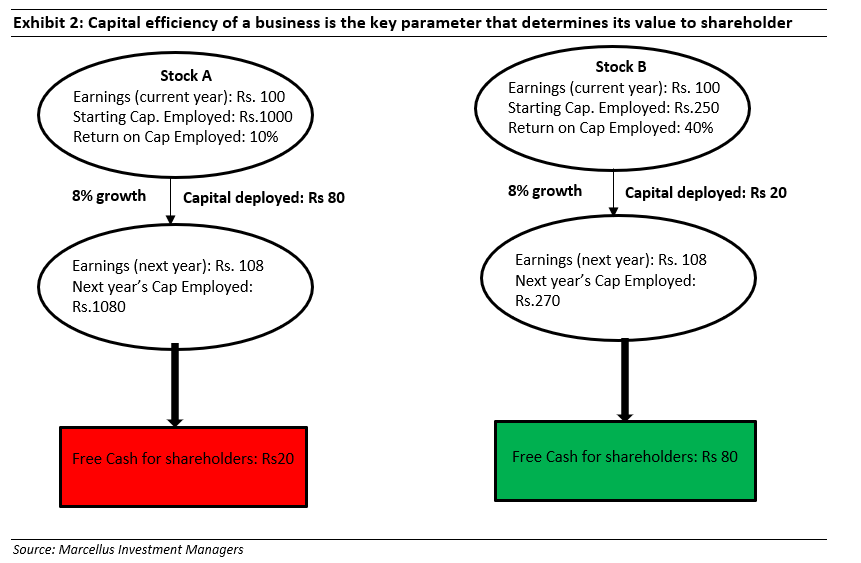
In the example above, let’s say the Return on Capital Employed (RoCE) for Stock A is 10% and for Stock B is 40%. If the value of profits for both the stocks today is the same at Rs 100, then the capital employed for Stock A thus would be Rs 1000 (Rs 100 / 10%) and for Stock B would be Rs 250 (Rs 100 / 40%).
To generate 8% earnings growth next year (i.e. growth of Rs.8), Stock A would need to reinvest incremental capital of Rs 80 (Rs 8 / 10%) i.e. 80% of the profit for the current year will be reinvested to fund 8% growth in earnings next year. For Stock B, the incremental capital reinvestment would be Rs.20 (Rs 8 / 40%) i.e. only 20% of the profit for the current year will need to be reinvested to fund 8% growth in earnings next year. Hence, Stock A will generate Rs.20 free cash flows (FCF) with 8% growth in profits. On the other hand, Stock B will generate Rs. 80 worth of free cash flows with 8% growth in profits i.e. 4x that of Stock A. At 8% earnings CAGR expected for both the stocks, due to the difference in the capital efficiency of the two companies, Stock B will generate 4x the FCF of Stock A each year on an ongoing basis.
Given that Stock B is 4x more capital efficient that Stock A (i.e. it needs 1/4th the capital to generate same growth), all other things equal, the fair value P/E multiple of Stock B should be 4x that of Stock A. Why? Note that the denominator of the P/E multiple for both the companies is the same value of profits in rupees. However, on the basis of those profits, Stock A delivers 1/4th the free cashflows as Stock B delivers, and hence the fair value of Stock B (present value of all future expected cash flows) should also be 4x the fair value of Stock A. Therefore, if the fair value P/E of Stock A is 15x, that of Stock B should be 60x (implying that at its currently prevalent P/E of 50x, Stock B is undervalued). In other words, Stock B trading at 50x P/E is actually ‘cheap’ compared to Stock A trading at 15x P/E.
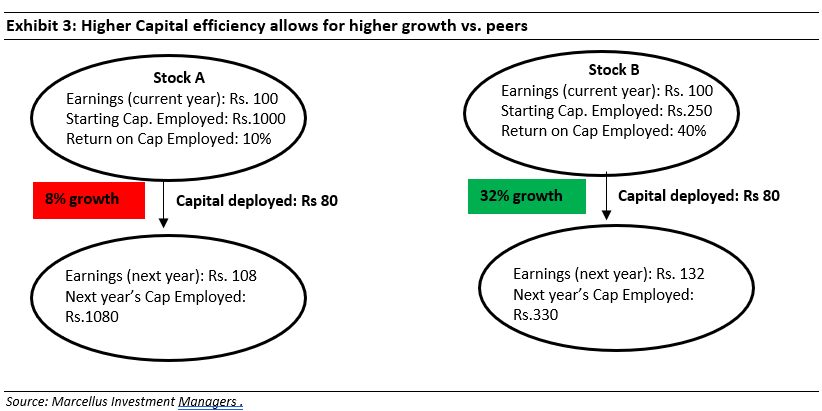
Alternatively, if Stock B also reinvests same absolute amount of FCF as stock A i.e. Rs 80, it can generate 4x the growth (and generate even higher FCF in future) while Stock A is left with hardly any resources to generate same growth as Stock B (unless it decides to borrow and leverage its balance sheet). Hence, Stock B deserves a significantly higher P/E multiple than Stock A.
In fact, if Stock B can keep generating healthy FCF due to its high capital efficiency and keep reinvesting such FCF in new growth opportunities year after year, the fair value P/E multiple of Stock B will be even higher than 4x that of Stock A. This is because the faster growth in free cashflows will eventually lead to greater quantum of free cashflows generated by Stock B in future years.
Delusion #2: Mean reversion of P/E multiple for companies that keep improving capital efficiency
The idea of capital efficiency doesn’t just apply across different companies but also for a given company over time. If a company becomes more capital efficient via higher asset turnover (reducing incremental capex needed to generate growth) and/or reducing working capital through the use of technology in its supply chain and/or by increasing bargaining power with suppliers and customers, even its own historical P/E or P/B ratios are NOT comparable to the current prevalent price multiples.
In our Nov’21 newsletter we highlighted that it is important for investors to determine the primary driver of free cashflows of any business to ascertain which valuation metric to use for relative comparison purposes – “What if a business significantly reduces its working capital cycle and increases its asset turnover through a variety of initiatives, consistently over the next 20 years? Let’s assume that such a business also sustains high pricing power (and hence profitability on the income statement) and a healthy rate of capital reinvestment. In such a case, the rate of growth in free cashflow will far exceed, both, the rate of growth in its profits, as well as the rate increase in its net assets, due to the reduction in working capital cycles and increase in asset turnover. Investing in such a business requires focus on free cashflows (rather than just growth in net assets or growth in profits).
If the rate of growth in free cashflows of such a business remains higher than the rate of growth in earnings, then comparison of this business with a Type 2 competitor (as described above) on P/E multiple is flawed. In other words, the P/E of such a business will keep rising as long as the free cashflow growth of the business remains above earnings growth
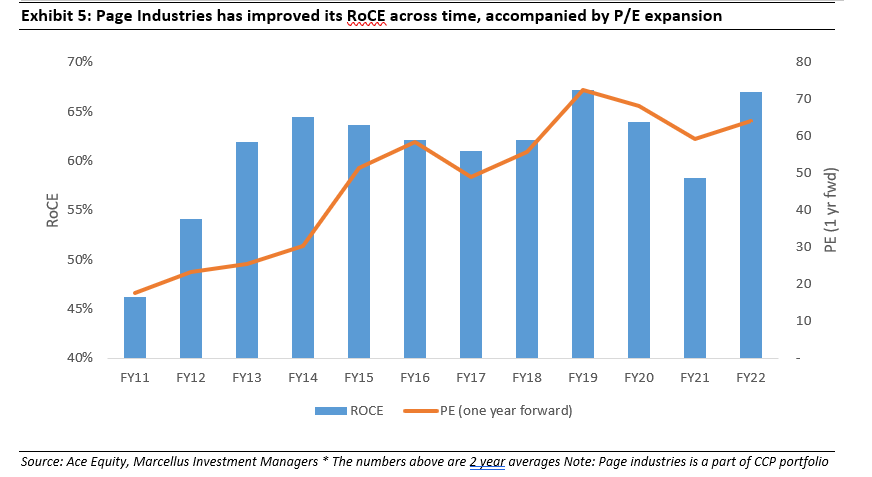
Such a scenario can be exemplified by looking at a company like Page Industries. Market participants have been voicing their concerns around the P/E valuations of Page Industries over the past decade even as the stock has compounded at 30%+ annually (see exhibit below).
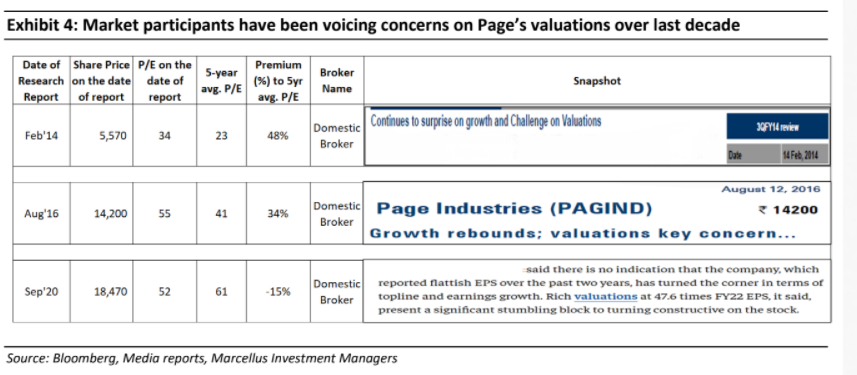
An inherent assumption behind such concerns is that as the P/E multiples exceed the past averages ‘mean reversion’ is bound to happen. However, if the company has been improving its capital efficiency (measured by Return on Capital Employed (RoCE)), it would grow its free cash flows much faster than its earnings thus rendering P/E multiples redundant & making it invalid to compare the firm’s current P/E with its historical P/E.
Page has consistently improved its capital efficiency (fixed asset turns as well as working capital turns) via:
- Sweating of fixed assets: Page has been able to improve its asset turns from ~3.6x to ~5.9x over FY11-22 due to reasons such as: (a) better labour management practices which has ensured employment of a higher proportion of skilled workforce and high quality of its end products; (b) use of automation in manufacturing processes like fabric cutting to improve productivity; and (c) use of technology to monitor labour efficiency (e.g. use of RFID/proximity cards to capture real time data).
- Improvement in inventory planning: In order to manage large number of SKUs, Page has made significant tech investments around sales force automation to capture granular sales data, data analytics for demand forecasting and supply chain tools like ‘BlueYonder’ for better inventory planning. As a result, Page’s inventory days have improved from average of ~94 days (over FY09-11) to ~84 days (over FY20-22).
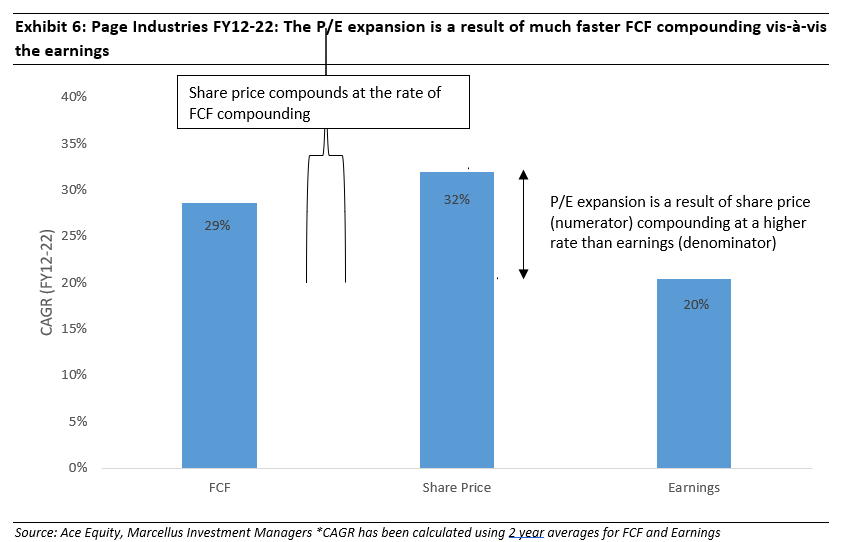
As a result of these initiatives, Page’ free cashflows compounded at almost 30% over FY12-22 v/s 20% compounding of earnings over the same period (see exhibit below). The differential of almost 10% has in turn meant that the numerator in P/E ratio has compounded at a much higher rate than the denominator (as share price compounds in tandem with free cash flow compounding) leading to an increase in the overall value.
Investment Implications
Valuations of businesses with deep moats, prudent capital allocation and a consistent focus on deriving incremental operating efficiencies should NOT be carried out using P/E multiples. Such businesses will always deserve to trade at higher P/E multiples – both compared to the P/E multiples of other lower quality businesses, as well as compared to their own historical P/E multiples.
CCP companies have focused on increasing their free cashflows on an ongoing basis, both through incremental operational efficiencies, as well as by aggressively reinvesting surplus capital to capitalize on growth opportunities. As highlighted in our Jul’22 newsletter, CCPs have consistently grown free cashflows at a rate which is 6-7% higher than the rate of their earnings growth on an annualised basis.
In addition to the drivers of higher P/E multiples discussed in this newsletter (superior capital efficiency, incremental operating efficiencies, higher rate of growth in free cashflows), there are other factors such as greater longevity of growth in future, which elevate the fair value P/E multiples of high-quality businesses. At Marcellus, we use a DCF (Discounted Cash Flow) approach towards valuing companies since the DCF clearly incorporates all such factors which drive the intrinsic value of a business.

