An investor looking to compound her wealth through equity investments faces two key risks: (a) the risk from short term fluctuations in stock prices (i.e. noise); and (b) the risk of long-term capital erosion/weak returns due to investments in sub-standard companies. To mitigate these risks, the investor can utilize two tools. Tool#1 is to increase the investment horizon from 1 year to 3 years as the longer the investment horizon, the lower the noise. Tool#2 is to increase the average rate of compounding by focusing on high quality companies. Over short time periods, the risk of noise in CCP portfolio companies has been similar to an average stock in the broader index, albeit with higher upside risk than a common stock. However, using Tool#1 and Tool#2 i.e. over longer periods of time, CCP stocks have given materially higher returns with less noise (than common stocks).
Performance update – as on 31st July’2022
We have a coverage universe of around 25 stocks, which have historically delivered a high degree of consistency in ROCE and revenue growth rates. Our research team focuses on understanding the reasons why these companies have delivered healthy and consistent historical track record and which of these companies are likely to sustain their superior financial performance in future. Based on this understanding, we construct a concentrated portfolio of companies with an intended average holding period of stocks of 8-10 years or longer. The latest performance of our PMS portfolio is shown in the charts below.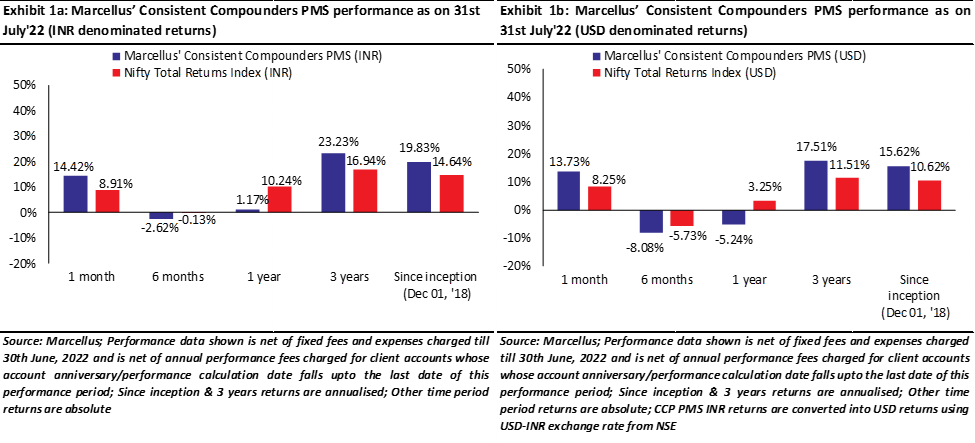
How to increase the ‘signal’ (i.e. returns) and reduce the ‘noise’ (i.e. volatility)
Most investors who are seeking to compound their wealth through equity investments are effectively trying to mitigate two broad risks: (1) The risk of noise around the mean; and (2) The risk of weak returns in the wake of capital erosion.
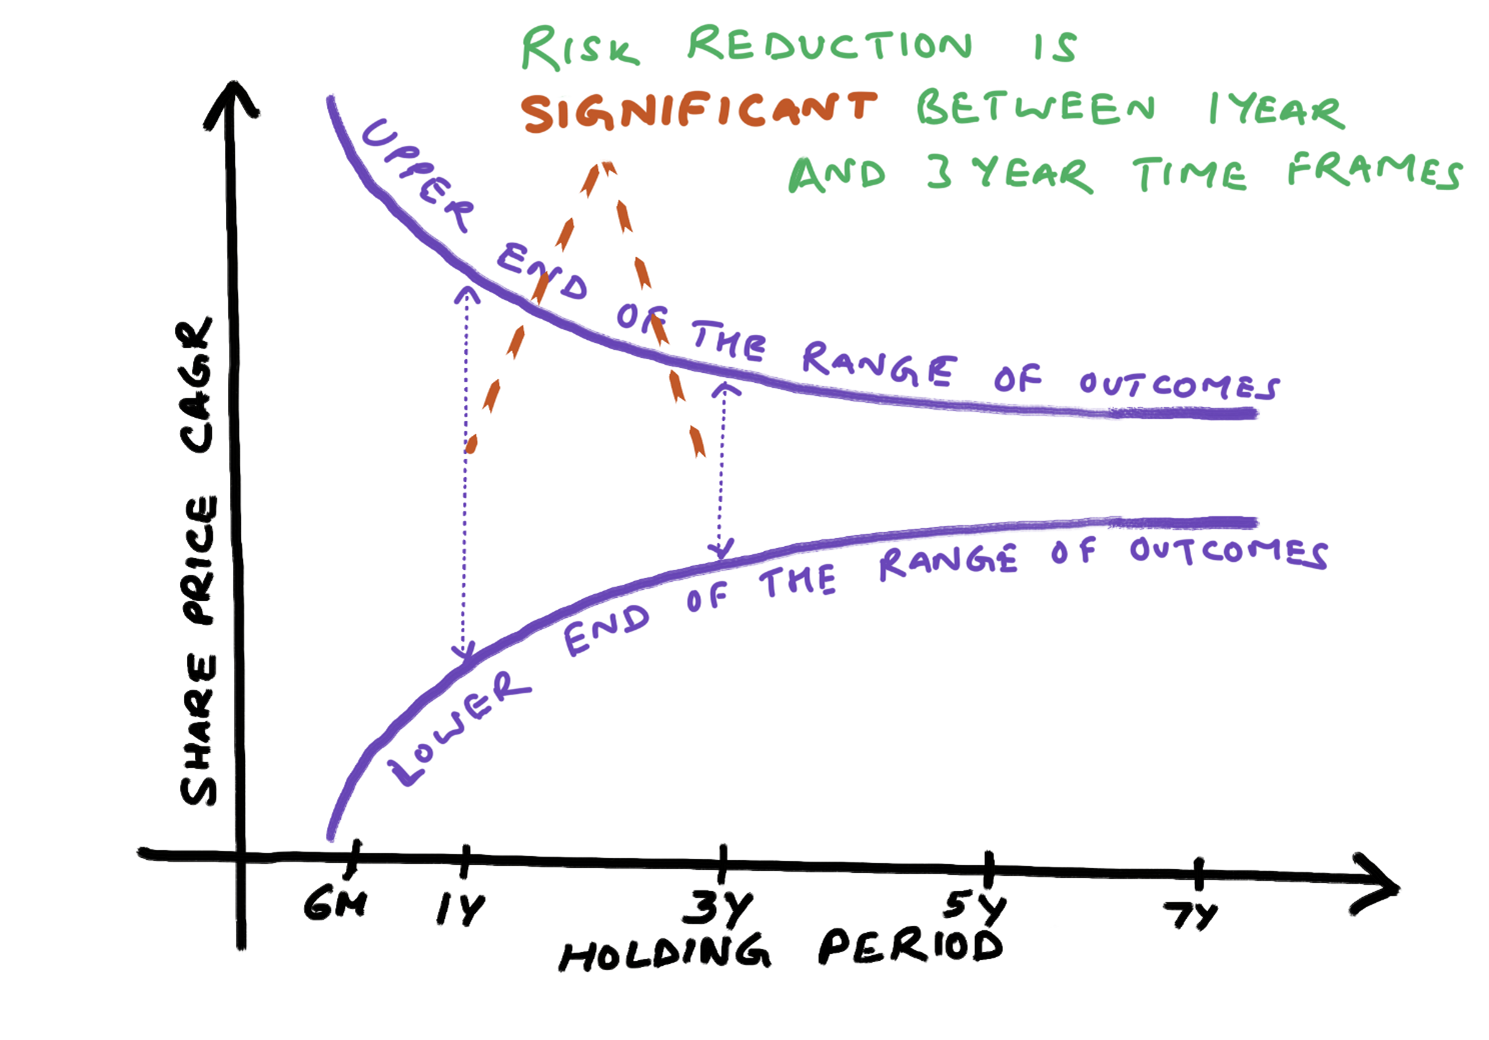
In Exhibit 2, the x-axis represents the holding horizon of an investor and the y-axis represents the range of investment returns likely to be observed for a given holding period. The shorter the holding horizon, the wider is the possible range of return outcomes thus increasing the risk of noise. As the horizon increases – especially from 1 year to 3 years – such risk reduces materially.
Exhibit 2: Range of return outcomes narrows as the investment time horizon increases
Source: Marcellus Investment Managers
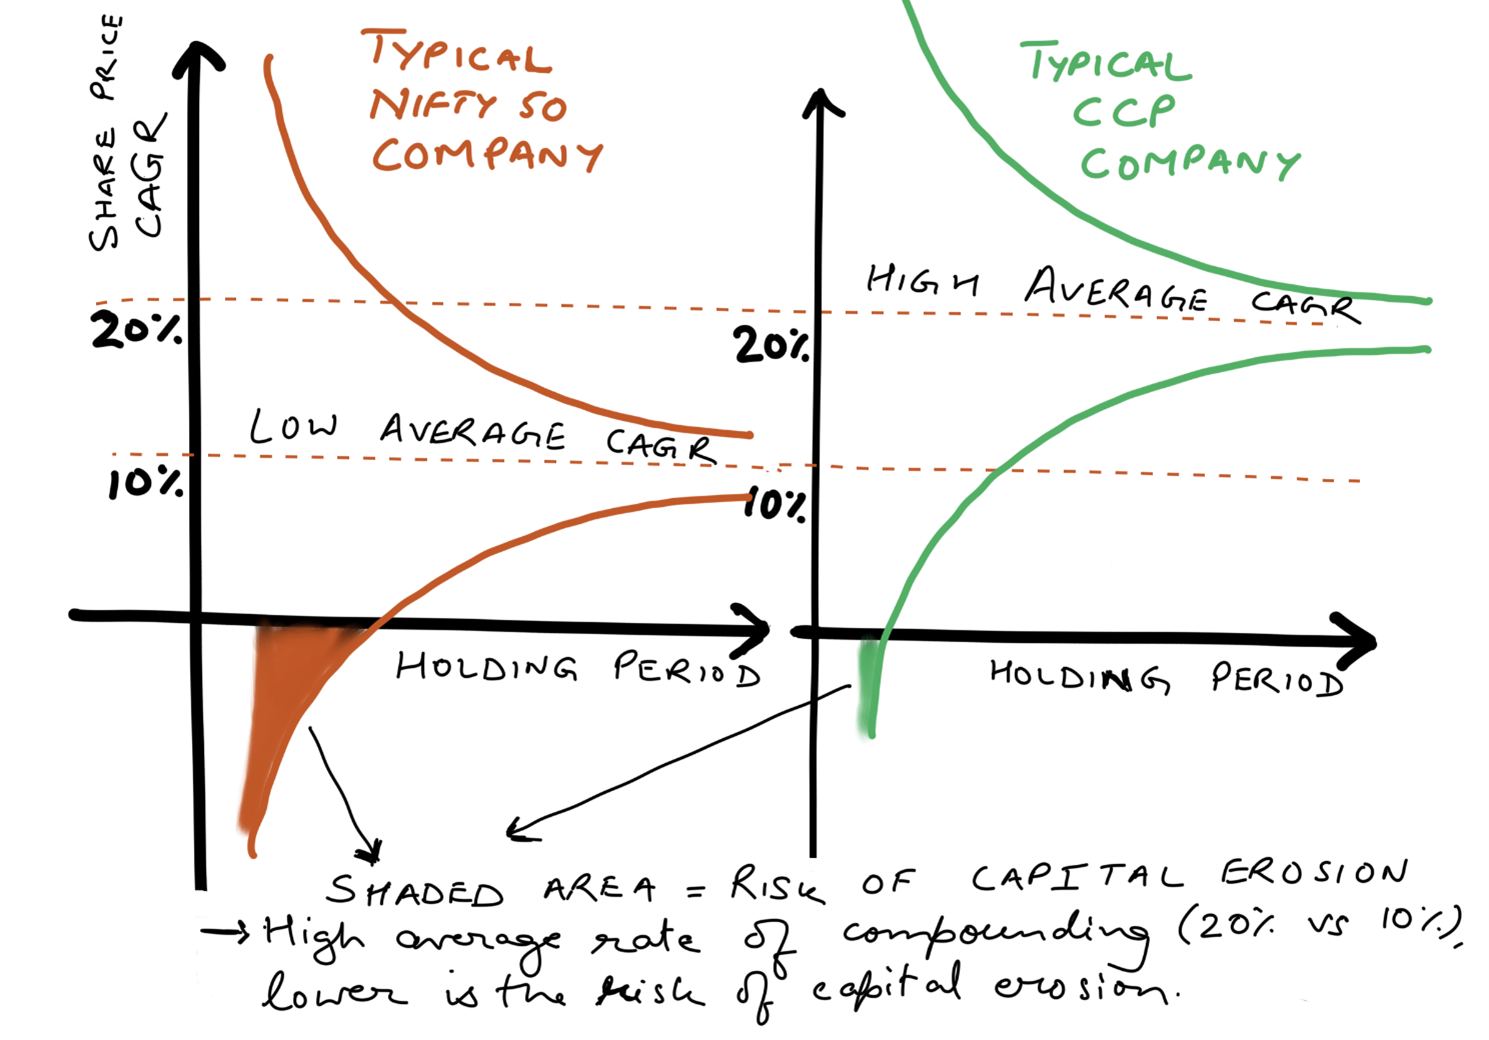
Exhibit 3 shows the importance of a high rate of (average) return. A CCP company significantly reduces the risk of capital erosion by dragging the distribution of returns upward (see the right hand chart in Exhibit 3 and compare that with the left hand chart which is represents a typical Nifty50 company). While two companies may have similar variability in returns across holding horizons, a higher average return results in fewer instances of negative returns (or capital loss) as the overall distribution of returns shifts upwards vis-a -vis a company with a lower average rate of return.
Exhibit 3: Higher is the average rate of compounding, the lower is the risk of capital erosion
Source: Marcellus Investment Managers
Risk of Noise around the Mean – Mitigated most significantly by increasing the time horizon from 1 year to 3 years
“In the short term you may experience good or bad luck [and that can overwhelm skill], but in the long term luck tends to even out and skill determines results.” – Michael Mauboussin talking about his book ‘The Success Equation: Untangling Skill and Luck in Business, Sports, and Investing’ with the Wall Street Journal in November 2012.
Narratives and expectations are the sources of risk that lead to short term fluctuations in share prices. These risks are NOT related to the long term fundamentals of a business. This is so because price movements in the short term are mostly a function of the market’s perceptions of the business in question. Such perceptions also reflect the market’s tendency to extrapolate short term performance (good or bad) many years into the future. Over the past decade there have been many such concerns which have been associated with our portfolio companies. For example:
-
Inflation:
During the 18-month period from Jul’10 to Dec’11, Asian Paints delivered zero absolute return with 6 month rolling returns varying between 80% at the upper end to less than -20% at the lower end. The newsflow during this period was dominated by concerns around the impact of massive input cost inflation on profit margins and the shortage of TiO2 (a key raw material for paint companies). However, over 2011 & 2012, Asian Paints’ business continued to progress well with expansion of the dealer network and investments in automation technology. Over the 12-month period post Dec’11 the stock delivered absolute returns of 70%.
-
Competition
From Oct’16 to Jul’19, Dr. Lal Pathlabs saw its 6 month rolling returns fluctuate from more than 60% at the upper end to -40% at the lower end. The major concern during this period was about the competitive intensity being generated by its competitor Thyrocare and the ensuing price war over 2016-17. Thankfully, Dr. Lal was able to defend its market share and profitability successfully due to the moats created by the company around convenience to the customer (Turnaround Time – or TAT – from sample collection to report generation, doctor-trust and affordability). Over the subsequent two years, from Aug’19 to Aug’21, Dr. Lal Pathlabs delivered a share price CAGR (i.e., annualized return) of ~80%.
Interest rates:
- With the global central banks looking to increase interest rates in the wake of inflation risks, there are concerns around correction in ‘expensive’ stocks as the discount rates rise. Historically, RBI repo rates increased from lows of 4.75% in Apr’09 to 8% in Jan’14. During this period while many of our portfolio stocks saw wild swings in 6 month returns, the median annualized return of the portfolio stocks (for the ones listed at the time) over the entire period (Apr’09-Jan’14) was almost 44%!
Using a simple measure like volatility or Standard Deviation of stocks we analyse how even for high quality large cap stocks the Risk of Noise is elevated in the short term.
For the exercise below, for each year since FY2000, we took the top 100 stocks by market cap that clear the RoCE (RoE for financials) filter of 15% in each of preceding 10 years (eg. the 10 years from FY91-00 when the exercise is done for FY2000) and have generated more that 10% revenue growth in at least 7 of preceding 10 years. The return volatility metrics were observed for 6 month, 1 year, 3 year, 5 year and 7 year periods for each stock over the succeeding 10 year period (weekly rolls). A median Standard Deviation number was calculated for each time horizon using these return numbers. For e.g. for the list of stocks that clear the filter in FY2000, we observe returns from 1st Apr’00 to 31st Mar’10 and obtain a median standard deviation figure for each time period mentioned above (i.e. 6 month, 1 year, 3 year, 5 year and 7 year periods) . We performed these iterations across 21 years until FY2020.
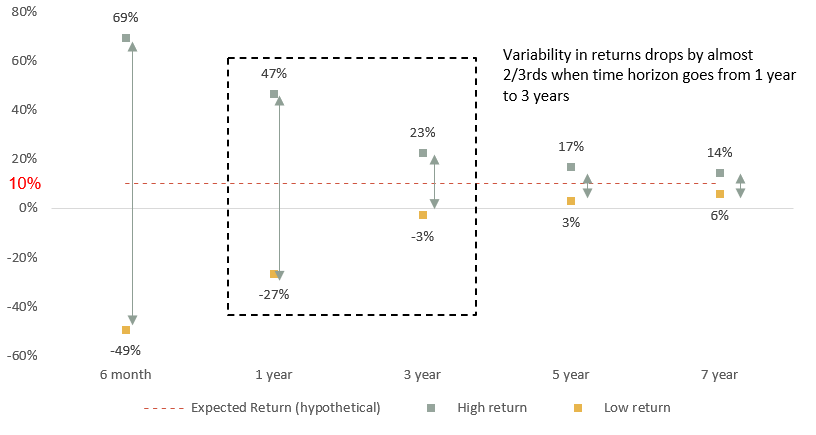
As per the results obtained, an investor who is hypothetically expecting an annualized return of 10% across various time periods would face wide variation in observed returns in the short term. Over a 6 month period such an investor can potentially get returns as high as 69% and as low as -49% (annualized). Over a 1 year horizon the returns can vary between 47% and -27%.
However, such variability reduces steeply as the investor’s horizon increases from 1-year to 3-years (see exhibit below) – the range of outcomes for a 3-year time horizon is roughly one-third as broad as compared to the range of outcomes for a 1-year time horizon!
Exhibit 4: Volatility of returns is extremely high in the short term and decreases rapidly in the long term
Source: Marcellus Investment Managers, Bloomberg Note: The returns used in the exercise above have been computed on a weekly rolling basis for stocks that clear revenue growth filter of 10% in at least 7 out of last 10 years and RoCE (RoE for banks) filter of 15% in each of last 10 years for iterations running from FY2000 to FY2020. The return period considered was succeeding 10 year period (or lesser wherever applicable) for each iteration. The universe used was top100 stocks by market cap in each year. The risk metrics were calculated using the median numbers for each holding horizon.
The risk characteristics outlined above are similar for our portfolio stocks as well. Exhibit 5 below highlights that in the short term, there can be wide variations in returns of CCP portfolio companies as well, when share prices remain detached from their underlying business fundamentals (the chart below shows variability of returns across 14 CCP stocks for different time periods using returns calculated through weekly rolls starting Apr’00). To put it in another way, short term risk to stock prices can only be reduced by extending your time horizon, not by selecting the highest quality stocks, from amongst a pool of high quality stocks. However, long term risk associated with business fundamentals can be (as we discuss more in next section).
Exhibit 5: Short term risk to returns cannot be reduced by selecting quality stocks; long term risk can be
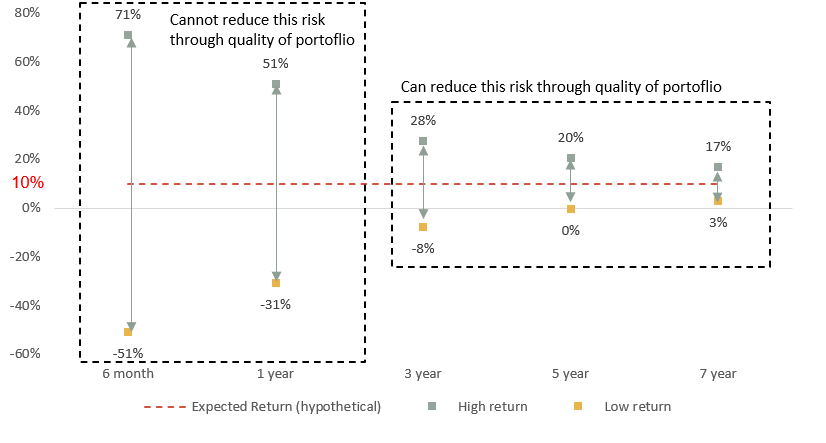
Source: Marcellus Investment Managers, Bloomberg Note: The returns used in the exercise above have been computed using the current CCP portfolio stocks on weekly rolling basis. The risk metrics were calculated using the median numbers for each holding horizon. Returns for stocks like Divis, Page, TCS, Dr. Lal, ICICI Lombard and HDFC Life have been computed since their listing date
Risk of capital erosion mitigated by focusing on companies with the highest quality fundamentals
The higher the expected rate of long term compounding of share prices, the lower will be the potential drawdown even if the investors are extremely unlucky with timing their entry and exits.
As highlighted in the previous section, the volatility in share prices of CCP stocks over the short term is similar to the broader market. However, the absolute returns offered by CCPs differ materially from the broader market.
The table below shows how the median returns of CCP portfolio companies has been upwards of 25% across various time periods. The same number for an average quality portfolio constructed basis simple RoCE and revenue growth filters is around 10-12% (i.e. broadly in the same ballpark as the Nifty 50 index). As a result of a high median (or expected) return, the absolute returns for CCP stocks are likely to have a lower downside and higher upside vis-à-vis an average ‘high quality’ portfolio (constructed basis RoCE>15% and Revenue growth>10%) as well as the Nifty 50 index. The difference in the magnitude of returns becomes especially apparent over a longer holding period (of 3 years or longer) when business fundamentals start determining returns rather than noise / narratives. To use a cricketing analogy, if an ordinary gali cricketer plays one delivery from Jasprit Bumrah, there is a reasonable change that he could snick it for a boundary (this is ‘noise’). If, on the other hand, the gali cricketer plays five overs from Jasprit Bumrah then it is almost inevitable that he will be clean bowled (this is the ‘signal’). The more deliveries played – or in investing, the longer the time period considered – the more likely that the ‘signal’ will overshadow the ‘noise’.
Exhibit 6: CCP stocks have much better absolute return profile than the average quality stock and better than the Nifty50
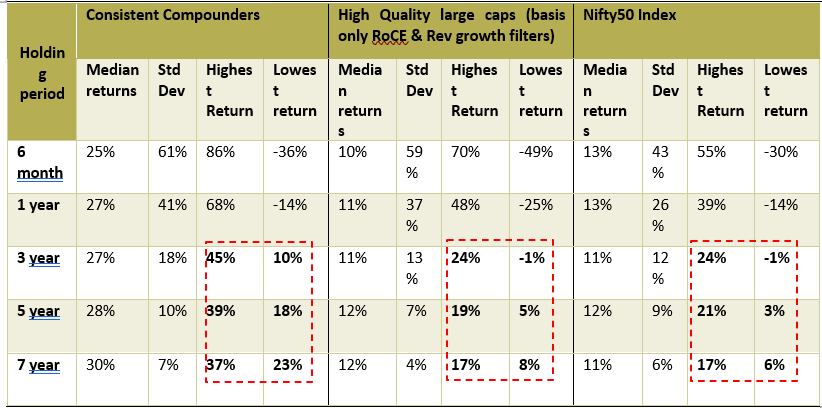
Source: Marcellus Investment Managers, Bloomberg Note: The returns for ‘High Quality large caps’ used in the exercise above have been computed on a weekly rolling basis for stocks that clear a revenue growth filter of 10% in at least 7 out of the last 10 years and a RoCE (RoE for banks) filter of 15% in each of last 10 years for iterations running from FY2000 to FY2020. The return period considered was the subsequent 10 year period (or lesser wherever applicable) for each iteration. The universe used was the top 100 stocks by market cap in each year. The risk metrics were calculated using the median numbers for each holding horizon. The returns used for ‘Consistent Compounders’ in the exercise above have been computed using the current CCP portfolio stocks on weekly rolling basis. The risk metrics were calculated using the median numbers for each holding horizon. Returns for stocks like Divis, Page, TCS, Dr. Lal, ICICI Lombard and HDFC Life have been computed since their listing date. For Nifty50 index, the returns are computed on a weekly rolling basis for various time periods.
Investment Implications
Exhibit 7: 2×2 Matrix encapsulating the risks and rewards of investing in various types of stocks
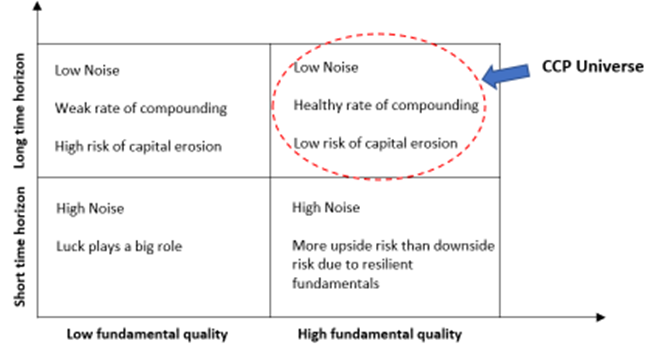
Source: Marcellus Investment Managers
Short term variations in stock prices can result from multiple (uncontrollable) factors which do not have a bearing on the underlying value of the franchise (and hence do not impact long term shareholder returns). For an investor, it is therefore important to focus on the factors which affect the long term compounding of her capital and allocate monies to the companies that can consistently deploy capital in high RoCE opportunities. Whenever the share prices progression of our portfolio companies in the short term dislocates from the evolution of their fundamentals, we try to use our post-facto rebalancing approach to benefit from such situations – see our Oct’21 newsletter for how we augment our clients’ returns using this approach.
As discussed in our Jun’22 newsletter, the CCP companies have been able to compound their free cashflows and their stock prices on the back of proactive steps taken to constantly strengthen their competitive moats. The same trend was visible in FY22 as well when amidst all the noise around Covid -19, the Russia-Ukraine War, inflation, rising competitive intensity, rising interest rates, etc, our portfolio companies deployed very significant amounts of cash towards capex (acquisitions and tech investments) and working capital decisions to further extend their lead vs. their competitors.
While we don’t know what the world (and stock prices) will look like a couple of months or even a couple of quarters hence, historical evidence shows that share price returns ultimately converge with the performance of the underlying business. To that end, the consistent steps taken by the CCP companies towards growing their franchises at healthy rate (while sustaining their competitive moats) tells us that our clients will prosper from holding shares in these outstanding franchises.

