OVERVIEW
POPULAR ARTICLES

In our national bestseller, Breakpoint, we explain that three forces are squeezing India’s middle class: quality jobs have become scarce, wages are rising at a slower pace than cost of living, and Indian households have become amongst the world’s most indebted. With Indian entering Sankat Kaal net foreign direct investment has all but disappeared as Indian promoters invest record sums abroad. In a world where America owns AI and China owns clean tech & mobility, India is left as a price-taker on both. As profits & capital drain away from India, we believe every middle-class household should act on three cardinal principles: 1) Reduce your non-mortgage debt, 2) Buy adequate term life & health cover, and 3) Invest a significant portion of your savings in US$. We can help you prepare for Sankat Kaal if you respond to this email or reach out to us via plan.marcellus.in.
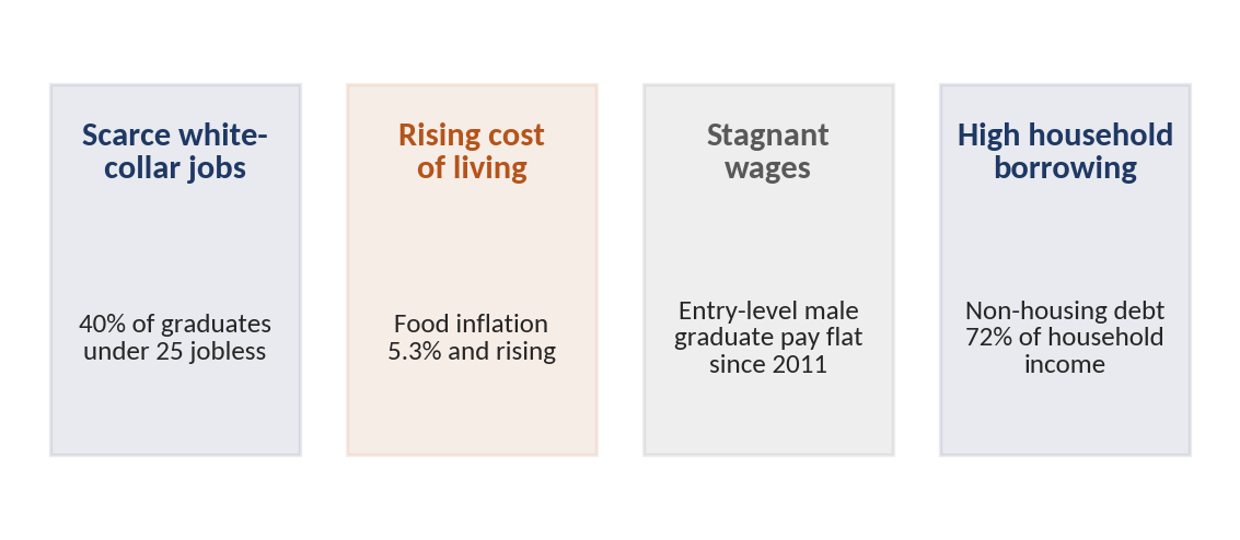
Exhibit 1: The four pressures Breakpoint identified — and where each one stands today
Source: Marcellus Investment Managers; Breakpoint (Juggernaut Books / Marcellus, March 2026); Azim Premji University, State of Working India 2026; MoSPI CPI release for June 2026; Marcellus, ‘The Most Indebted People in the World’.
What Breakpoint said
When we published Breakpoint: The Crisis of the Middle Class & The Future of Work in March 2026, our central claim was that India’s roughly 40 million income-tax-paying households — the group that does most of the country’s discretionary spending and employs much of the population below it — had run into four pressures at the same time – see Exhibit 1.
Individually, each was manageable. Arriving together, these pressures are pulverising the arithmetic of middle-class life. Scarce white-collar jobs mean fewer people entering the middle class and less bargaining power for those already in it. Rapidly rising cost of public services like education and healthcare eat into what is left. With income no longer enough to fund the lifestyle shown on social media, households are borrowed — not to buy assets, but to fund daily consumption.
From Breakpoint to Sankat Kaal
Since we published Breakpoint, three other sets of dynamics have come to the fore and their combined impact has put India firmly in Sankat Kaal.
- The graduate jobs pipeline is not blocked temporarily. It has been blocked for decades.
Azim Premji University’s State of Working India 2026, published in March 2026, is the most careful piece of work yet on how young Indians move from education to employment. Its findings include:
- Unemployment among graduates aged 15–25 is close to 40%, and around 20% for those aged 25–29. Crucially, the report shows graduate unemployment has sat in the 35–40% band for decadese. this is structural, not a downturn.
- Of the 6.3 crore graduates aged 20–29, roughly 1.1 crore are unemployed.
- Even among young male graduates who do find work within a year, fewer than 7% land a permanent salaried job and only 3.7% get a white-collar one.
- Entry-level earnings for young male graduates have grown more slowly since 2011 — the stagnant-wages leg of our thesis, confirmed by an independent dataset.
- The share of young men in education fell from 38% in 2017 to 34% in late 2024, with many citing the need to support household income.
Exhibit 2: Graduate unemployment is entrenched — and the jobs that do arrive are rarely careers
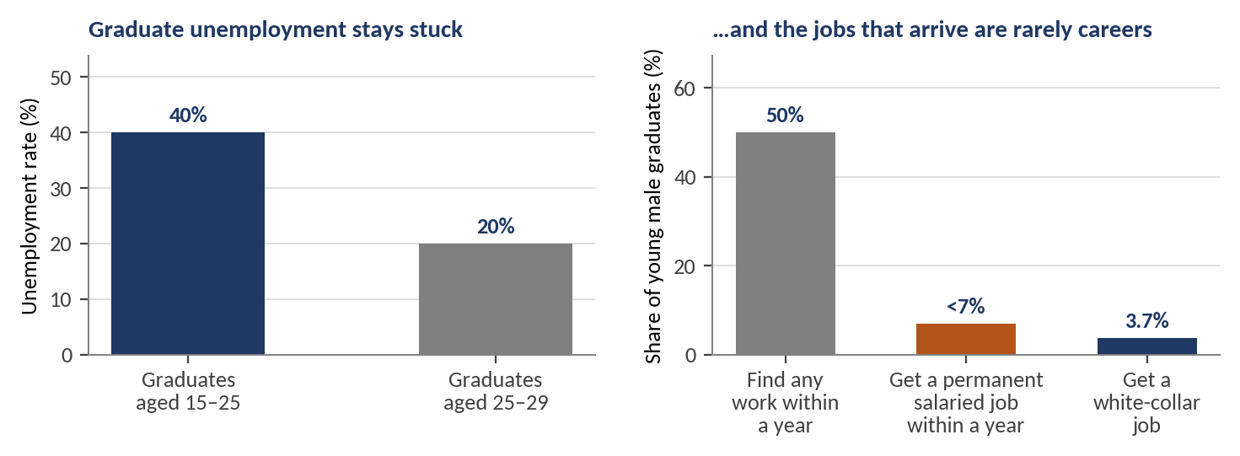
Source: Marcellus Investment Managers; Azim Premji University, State of Working India 2026 (released 17 March 2026). Unemployment rates pertain to graduates; the right-hand panel pertains to young male graduates who report finding work within one year of being unemployed.
The same report notes that India’s working-age population share begins declining after 2030. The window in which a jobs boom could still convert the demographic dividend into an economic one is closing, and the education-to-employment machinery is not ready.
- Neither foreigners nor Indian promoters want to put fresh money to work in India
The headline FDI number India cites is gross inward investment, and on that measure FY26 was a record — roughly US$94.5bn. But gross inflows tell you how much money arrived, not how much stayed. Net FDI — what is left after foreign investors repatriate capital and Indian companies invest abroad — tells a very different story.
- Net FDI has fallen from US$44bn in FY21 to US$38.6bn (FY22), US$28bn (FY23), US$10.1bn (FY24), around US$1bn (FY25) and US$7.7bn (FY26). Over five years, the amount of foreign capital genuinely committed to India has fallen by more than 80%.
- Repatriation by foreign investors reached US$53.6bn in FY26, up from US$29.3bn in FY23. Money now leaves almost as fast as it arrives.
- More telling still: outward FDI by Indian companies rose to a record US$33.3bn in FY26 from US$14bn in FY23. Indian promoters are voting with their capital, and they are voting for Singapore, the UAE, the Netherlands and the US.
Exhibit 3: Net FDI has collapsed — because both foreigners and promoters are taking money out
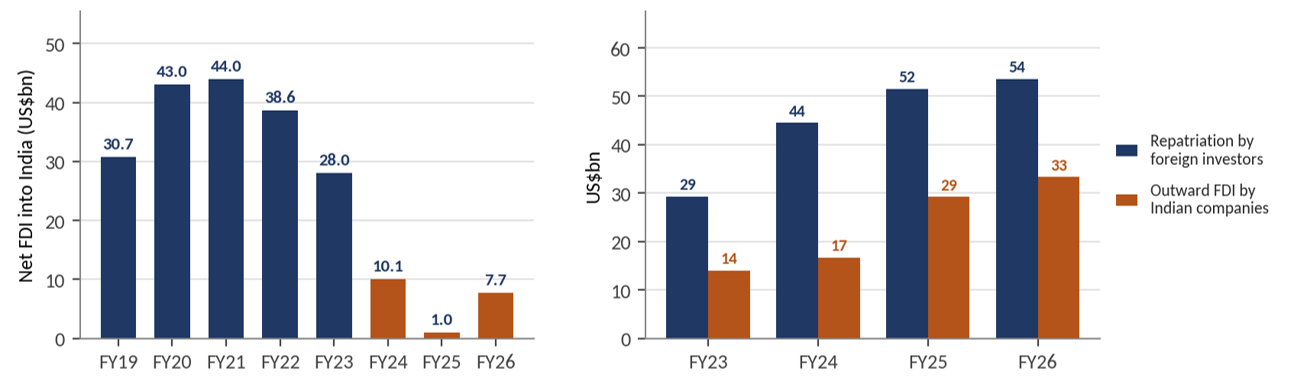
Source: Marcellus Investment Managers; RBI (State of the Economy, monthly bulletins; balance of payments data). FY26 figures per RBI data released May 2026. Net FDI = gross inward FDI less repatriation/disinvestment by foreign investors less outward FDI by Indian entities.
When the people who know an economy best — its own promoters — are exporting a record amount of capital while foreign owners take a record amount home, the indications are that the domestic profit pool is shrinking.
- America owns the AI stack, China owns clean tech and mobility, India owns neither
In the first part of our Fading Nation State series (see July 2026 blog: The Fading Nation State. Part 1: The Twilight of National Investing – Marcellus) we argued that the 150-year-old nation state is being hollowed out by three forces: its shrinking ability to tax mobile capital, the migration of work from salaried employment to global gig work, and — most relevant here — the fact that barring the United States and China, no state controls the critical technologies underpinning a modern economy.
The frontier of artificial intelligence — the largest models, the leading-edge accelerators, the hyperscale clouds — is overwhelmingly American, with chip fabrication concentrated in Taiwan. If AI is American, the energy transition is Chinese: the International Energy Agency reports that China’s share exceeds 80% at every major stage of solar PV manufacturing and rises above 95% for polysilicon and wafers, alongside dominance in battery cells and in the processing of rare earths and other critical minerals.
Exhibit 4: The clean-tech supply chain runs through China at every stage
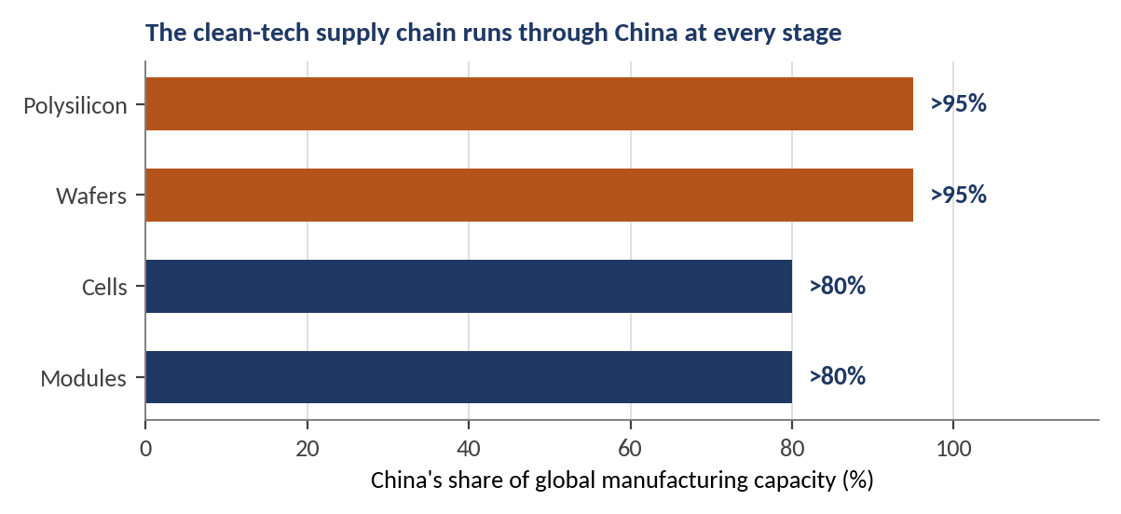
Source: Marcellus Investment Managers; International Energy Agency, as cited in Marcellus, ‘The Fading Nation State, Part 1: The Twilight of National Investing’ (July 2026). Bars show the lower bound of the IEA’s reported ranges.
India’s responses — production-linked incentives for solar, advanced-chemistry-cell batteries and electronics, a Critical Minerals Mission, and an India AI Mission with an outlay of roughly ₹10,000 crore — are real. They are also small relative to the gap, and upstream capacity takes a decade to build. In the meantime, India buys its intelligence from America and its energy transition and mobility hardware from China and sells the world neither.
Put the three together and the conclusion is uncomfortable but hard to escape. If the jobs that create middle-class income are not coming, if the capital that creates those jobs is leaving, and if the technologies that will define the next two decades of profit growth are owned elsewhere, then profit — and more importantly profit growth — will increasingly be earned outside India rather than inside it.
Three cardinal principles for Sankat Kaal
None of this requires a household to predict the future. It requires only that households stop assuming the last decade’s conditions will persist. Three actions follow, and all three are cheaper and easier to execute today than they are likely to be a year hence.
Principle 1: Reduce your non-mortgage debt
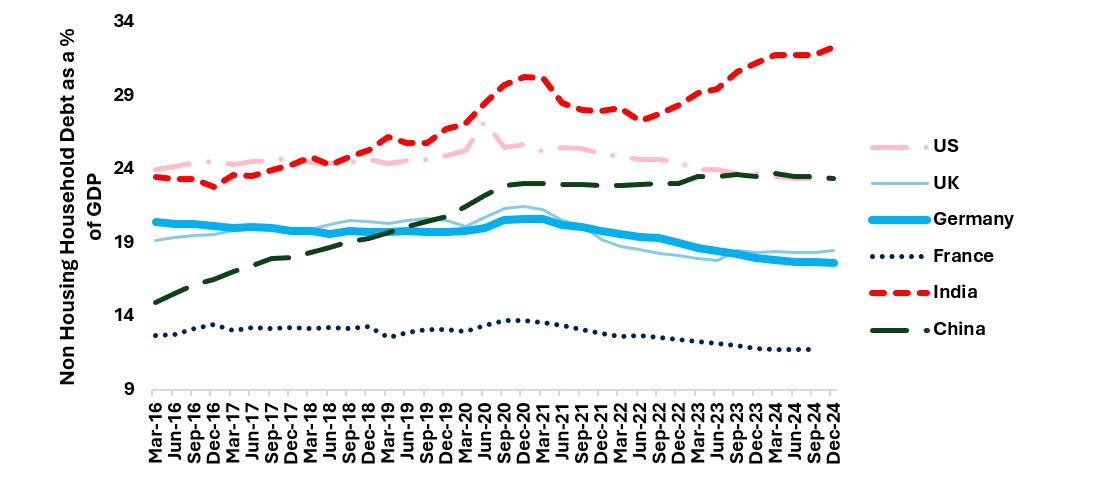
Once mortgages are excluded — and mortgages should be excluded, because they finance a real asset at a low interest rate — Indians are among the most indebted people on earth. Non-housing household debt stands at roughly 32% of GDP, up from 23% in FY17, and above both the United States and China. Measured against household income rather than GDP, which we think is the more honest denominator, the same debt has risen from 59% to 72% of household gross value added.
Exhibit 5: Ex-mortgages, Indian households are among the most indebted in the world
The reason to act now is that the cost of carrying this debt is far more likely to rise than fall from here. Three forces point the same way.
- Inflation is turning. CPI inflation rose to 4.38% in June 2026 from 3.93% in May — an 18-month high and the third consecutive monthly acceleration — with food inflation at 5.32%. The RBI has raised its FY27 forecast to 5.1% from 4.6% and projects 5.9% for Q3FY27, uncomfortably close to its 6% upper tolerance limit.
- The government’s fiscal room is narrowing. FY26 tax collections are estimated to have fallen short of target by around ₹3 lakh crore. FY27 gross market borrowing by the central government alone is set at a record ₹17.2 lakh crore. Add to that state government and PSU borrowing and the Indian sovereign will borrow close to ₹30 lakh crore from the Mumbai market. To put that colossal number in context, the Indian banking system made fresh loans of ₹29 lakh crore in FY26.
- The RBI has cut the repo rate by 125 basis points since early 2025, to 5.25%. Over the same period the 10-year government bond yield has gone up, to around 6.8% in late July 2026. Policy rates and the actual cost of money have decoupled, and it is the latter that eventually sets your EMI.
Exhibit 6: The RBI has cut rates; the market has not followed — and inflation is climbing back
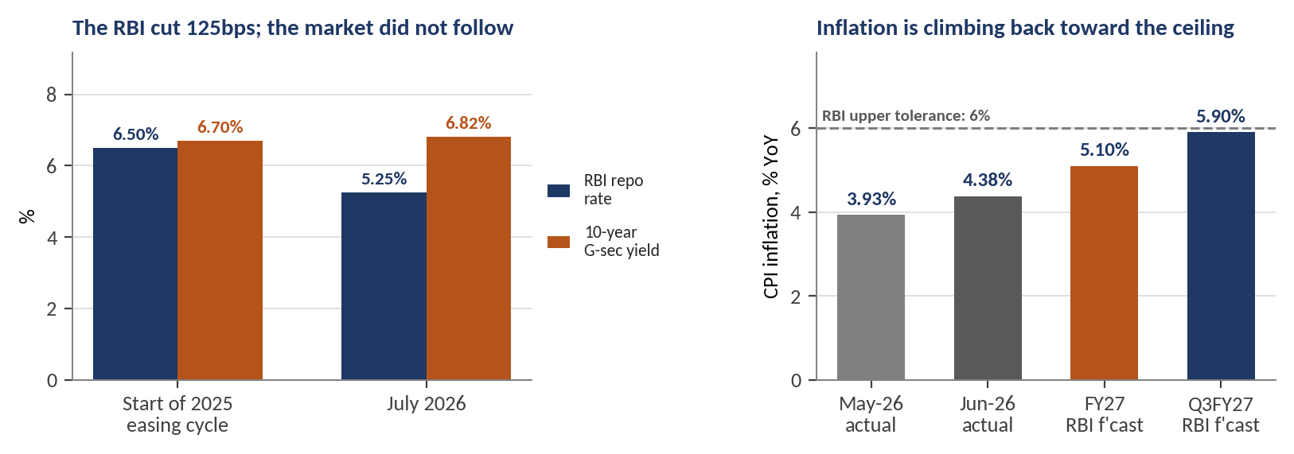
Source: Marcellus Investment Managers; RBI (Monetary Policy Committee resolutions, February 2025 and June 2026); MoSPI CPI releases for May and June 2026. RBI forecasts per the June 2026 MPC resolution. The 10-year G-sec level for the start of the easing cycle is an approximate market reference; the July 2026 reading is ≈6.82%. Note that the June 2026 CPI print uses the new 2024=100 base series.
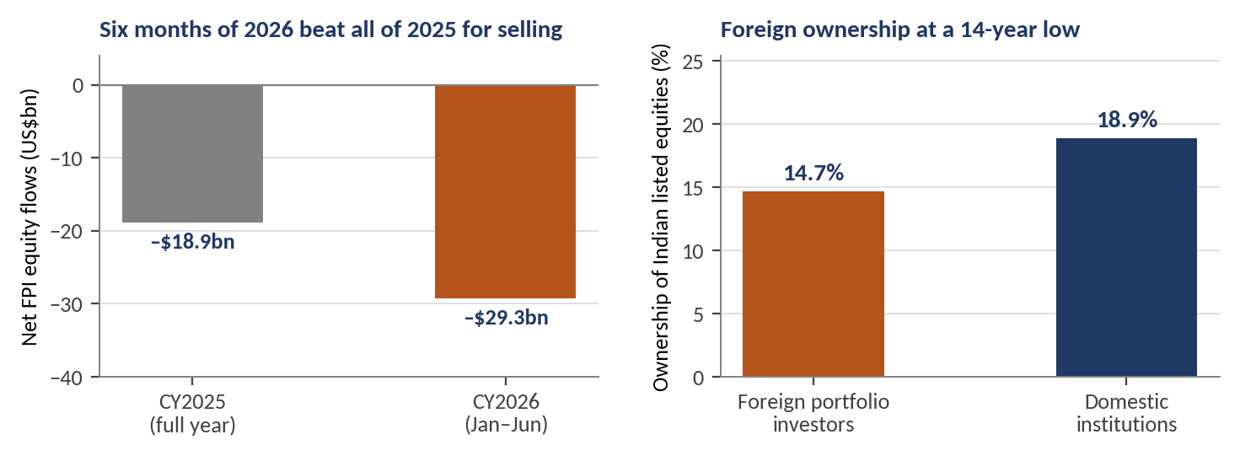
Source: Marcellus Investment Managers; NSDL/CDSL depository data for net FPI equity flows; ownership data per JM Financial as cited in the press, mid-2026.
Every rupee of unsecured debt you retire today is retired at a known cost. Every rupee you carry forward will be refinanced at a rate set HIGHER by inflation, by the government’s borrowing programme and by whether foreigners are buying or selling Indian paper — none of which you control.
Principle 2: Insure yourself properly
Insurance is the one financial product Indians reliably under-buy, and Sankat Kaal this gap gets exposed. India’s insurance penetration was flat at 3.7% of GDP in FY25 — roughly half the global average of 7.3% — with life at 2.7% (down from 2.8% the previous year) and non-life stuck at 1.0%. Life premiums grew 6.7% in FY25 while the number of new policies fell 7.4%: the already-insured are paying more, and few new households are joining.
The consequence shows up on household balance sheets. Out-of-pocket spending still accounts for 39.4% of India’s health expenditure, and medical inflation runs at close to 12% a year — far above headline CPI. A single hospitalisation is therefore one of the most common routes by which an Indian middle-class family moves from solvent to indebted. Note also the IRDAI’s own observation that while the number of health claims settled is high, the proportion of the amount claimed that gets paid remains below expectations. Being insured and being adequately insured are not the same thing.
Exhibit 8: India is insured at half the world’s rate, and households still pay 39% of health costs themselves
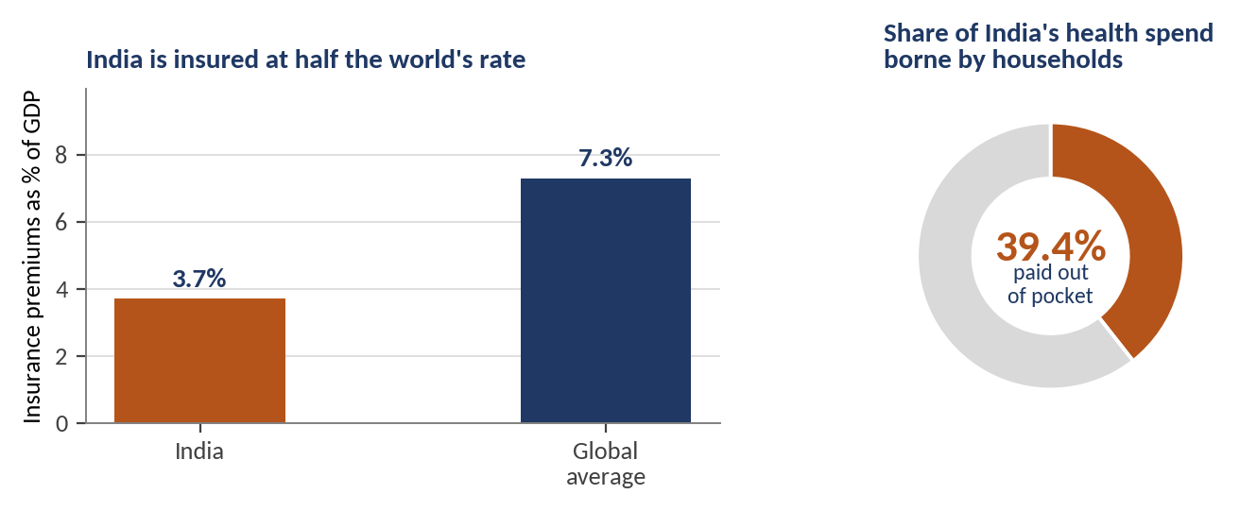
Source: Marcellus Investment Managers; IRDAI Annual Report 2024-25 and Handbook of Insurance Statistics (penetration, density); Swiss Re (global average); National Health Accounts, out-of-pocket share of health expenditure, 2021-22.
Two rules of thumb are worth holding to, and both should be acted on while you are still young, healthy and employed — the three conditions on which cheap cover depends:
- Term life cover: a sum assured of at least ten times annual income. Term insurance is pure protection with no investment component, which is exactly why it is affordable.
- Health cover: a minimum of ₹10 lakh. At 12% medical inflation, a sum insured that looks generous today will look thin within a decade, so treat ₹10 lakh as a floor rather than a target, and top it up with a super top-up policy, which is the cheapest way to buy a high sum insured.
Principle 3: Save aggressively in dollars
The rupee has fallen from ₹18 to the dollar in 1991 to around ₹96.6 in late July 2026 — a decline of roughly 5% a year, decade after decade, and the calmest depreciation in the emerging world. That calm rested on three foundations: a state that borrows in its own currency from its own savers, a large foreign-exchange buffer, and a credible central bank. As we set out in our 21st July 2026 blog Profiting From a Fading State & a Falling Rupee, all three are now eroding at once.
Exhibit 9: Thirty-five years of one-way traffic in the rupee
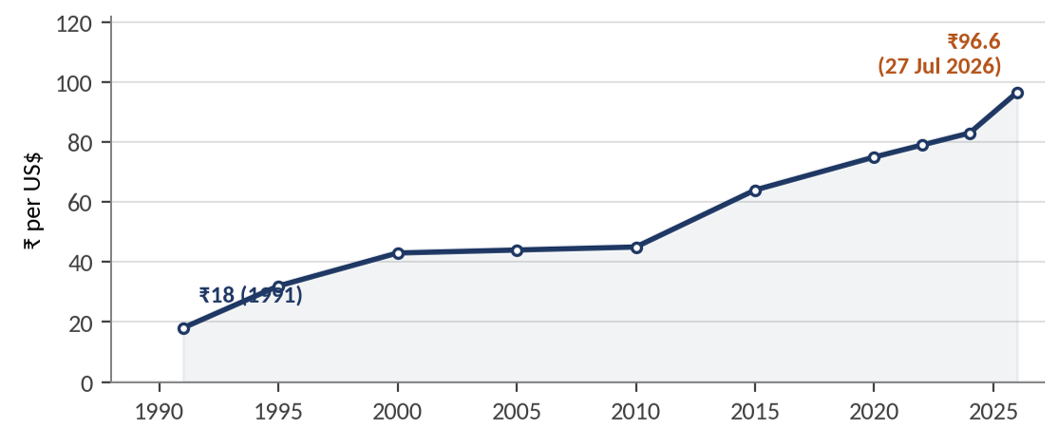
Source: Marcellus Investment Managers; RBI reference rates (daily USD/INR). Latest reading ≈₹96.6 as at 27 July 2026, against an all-time low of ₹96.97 reached in late May 2026.
Three forces now bear down on the currency simultaneously:
- India’s largest forex earner is being disrupted. Software and IT services account for roughly half of India’s ~US$421bn of services exports. In Q1FY27, constant-currency growth across the top five Indian IT firms stayed muted; Infosys cut the upper end of its FY27 guidance to 3.0% from 3.5%; TCS reduced headcount by roughly 23,000–25,000 over FY26; and the Nifty IT index touched its lowest level since May 2021 in early July 2026.
- Capital is flowing out. The US$29bn of H1 CY26 equity selling described above has to be bought with dollars, and the RBI has been intervening close to daily in both spot and forward markets to slow the slide.
- The domestic economy is weakening. The RBI cut its FY27 growth forecast to 6.6% from 6.9% in June 2026 while simultaneously raising its inflation forecast — the classic combination that precedes currency weakness.
For a rupee saver the arithmetic is blunt: a structurally softer currency imposes a drag of roughly 5% a year on every rupee asset before any question of relative stock returns. And the option to diversify is itself state-dependent. In 2013, the Liberalised Remittance Scheme limit was cut from US$200,000 to US$75,000 overnight during a currency crisis. Exercise the option while you still have it, and while your rupee assets still hold their value.
Marcellus can help in two ways
Firstly, we can help you prepare for Sankat kaal by:
- Quantifying your financial goals eg. retirement, children’s education;
- Creating a roadmap for reducing your debt burden; and
- Helping you create a low cost, diversified portfolio of Indian and global assets.
If you would like our guidance on the above, pls contact us via plan.marcellus.in or use the QR code shown below:

Investing globally, from GIFT City
Secondly, through our offices in GIFT City, Gujarat, Marcellus offers multiple global funds that give Indian investors access US$ investments. Ticket sizes begin at around US$5,000 (approximately ₹4.5 lakh), subject to the specific product, regulatory classification and investor eligibility. Our flagship global product is the Global Compounders Portfolio, whose track record is shown in Exhibit 10 below. Marcellus GCP PMS is offered by Marcellus Investment Managers GIFT Branch in a segregated managed accounts format.
Exhibit 10: Global Compounders Portfolio — wealth creation since inception, in USD and in INR
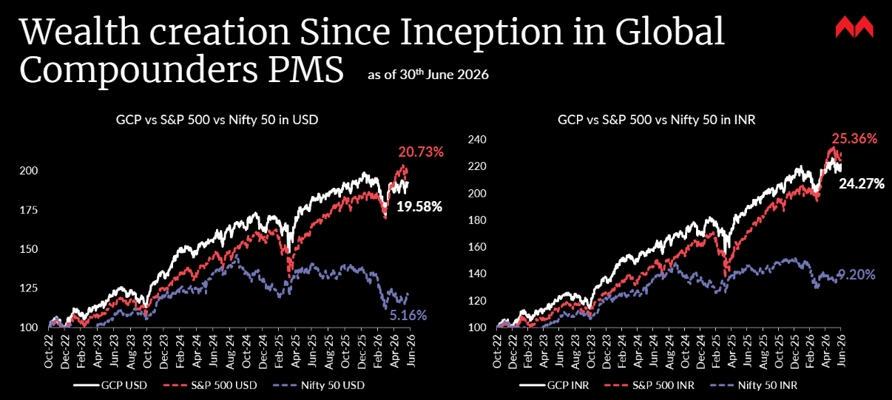
Note: Marcellus’ performance data shows the gross of taxes and net of fees & expenses charged till end of last month on client account. Performance fees are charged annually in December. Returns more than 1 year are annualized. Marcellus’ GCP USD returns are converted into INR using USD: INR exchange rate from RBI – Link for the reference
*Since Inception performance calculated from 31st Oct 2022. The inception date is 31st Oct 2022, the next business day after the account got funded on 28th October 2022. S&P 500 net total return is calculated by considering both capital appreciation and dividend payouts. The calculation or presentation of performance results in this publication has NOT been approved or reviewed by the IFSCA or US SEC. Performance is the combined performance of RI and NRI strategies. S&P 500 NTR is the benchmark for the strategy. Nifty 50 is provided for reference to illustrate the relative performance of the US and Indian markets. Past performance pertains to Marcellus’ GCP PMS strategy, not to this IFSC Retail Scheme and is not indicative of future results.
Marcellus GCP PMS is offered by Marcellus Investment Managers GIFT Branch in a segregated managed accounts format.
If you would like to invest with us, please visit invest.marcellus.in OR scan the QR code below.

Click Here for details about our regulatory registration and licensing information.
The above material is neither investment research, nor investment advice. Marcellus does not seek payment for or business from this material/email in any shape or form. Marcellus Investment Managers Private Limited (“Marcellus”) is regulated by the Securities and Exchange Board of India (“SEBI”) as a provider of Portfolio Management Services. Marcellus is also a US Securities & Exchange Commission (“US SEC”) registered Investment Advisor and is regulated by the International Financial Services Centres Authority (IFSCA) as a Fund Management Entity. No content of this publication including the performance related information is verified by SEBI, IFSCA or US SEC. If any recipient or reader of this material is based outside India and USA, please note that Marcellus may not be regulated in such jurisdiction and this material is not a solicitation to use Marcellus’s services. The PMS strategy, Category III AIF products and IFSCA retail schemes are distinct offerings with different regulatory frameworks, risk profiles, fee structures and investment thresholds; minimum investment amounts referenced (e.g. ~US$5,000) are applicable to specific IFSCA retail schemes and may not apply to PMS or Category III AIF products. Investors should refer to product-specific documents for details before investing. All recipients of this material must, before dealing and or transacting in any of the products and services referred to in this material, make their own investigation and seek appropriate professional advice. Past performance is not indicative of future results. Marcellus and/or its associates, the authors of this material (including their relatives) may have financial interest by way of investments in the companies covered in this material. Marcellus does not receive compensation from the companies for their coverage in this material. This material may contain confidential or proprietary information and user shall take prior written consent from Marcellus before any reproduction in any form.