OVERVIEW
POPULAR ARTICLES

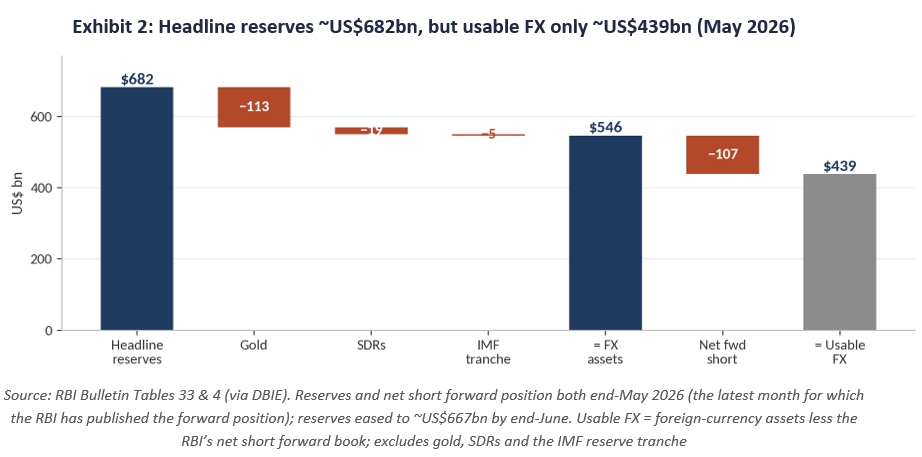
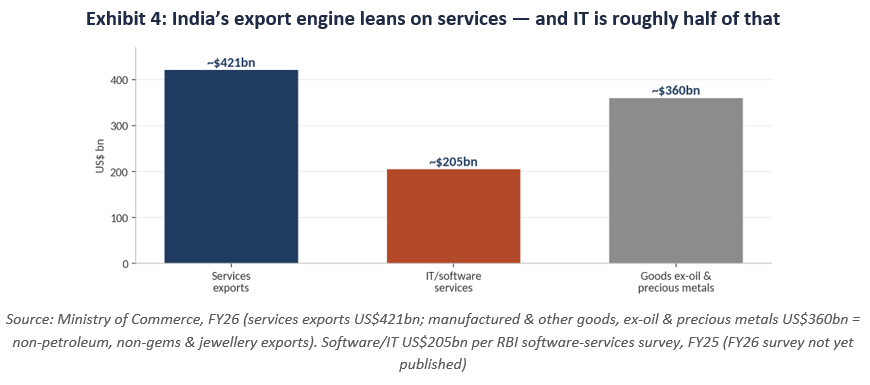
The rupee’s decline since 1991 — from ₹18 to ₹96 per dollar — has been the calmest depreciation in the emerging world, built on three pillars: a state that funds itself in its own currency, a large reserve buffer, and a credible central bank. All three pillars are eroding now. Usable FX reserves are ~US$439bn, roughly a third below the ~US$682bn headline; the RBI’s recent decisions show visible strain; and AI is dismantling IT services, India’s largest forex earner. With debt in rupees, printing money is the easiest way out for the government and that implies a further slide in the currency. The silver lining: a cheaper rupee reverses two decades of IT-driven ₹ overvaluation and could ignite India’s long awaited manufactured-exports renaissance.
The logical investment decisions for you: hold wealth outside the rupee and buy Indian exporters. Visit connect.marcellus.in if you would like to do either.
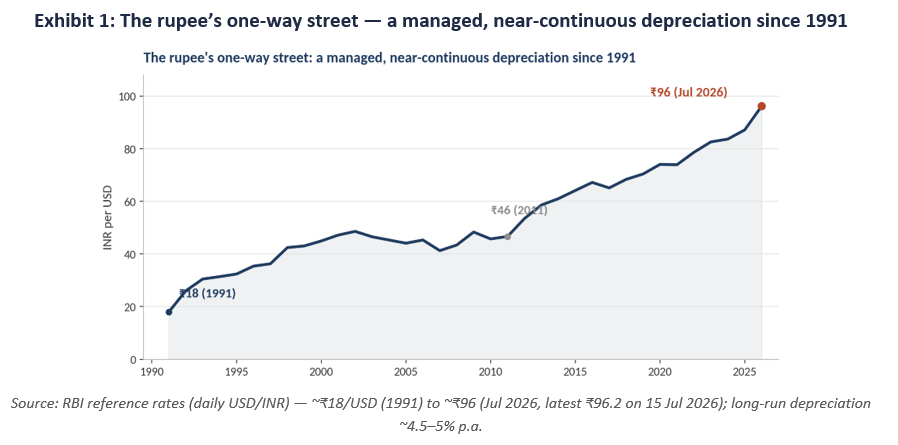
One of the Calmest Depreciation in the Emerging World…
For thirty-five years the rupee has done something unusual for an emerging-market currency: it has fallen slowly, predictably and without drama — roughly 5% a year, decade after decade, tracking India’s inflation differential with the US. No Argentine collapse, no Turkish spiral. That calm was not luck.
It rested on three foundations: the Indian state borrows money in its own currency from its own savers; it sits on one of the world’s larger forex reserve buffers; and the RBI has managed the exchange rate with credibility and a reasonable degree of independence. Every rupee saver — knowingly or not — has been relying on those three foundations holding.
…Was Built on Foundations That Are Now Eroding
1. Self-funding: weakening from both ends
As we argued in Part 1 of this series, a state that cannot tax mobile capital and gig income is fiscally squeezed on the revenue side. But there is a second leg: India’s private sector has itself turned reluctant to borrow and build in India.
In the 2000s, leveraged promoter capex drove the investment cycle and the tax buoyancy arising from that capex rescued the fiscal arithmetic. In contrast, in recent years, Indian corporates have preferred to deleverage and distribute cash back to shareholders.
As a result, the Government of India loses the growth-driven revenue that masked the fiscal gap in decades gone by.
2. Reserves: usable FX is ~US$439bn, not ~US$682bn
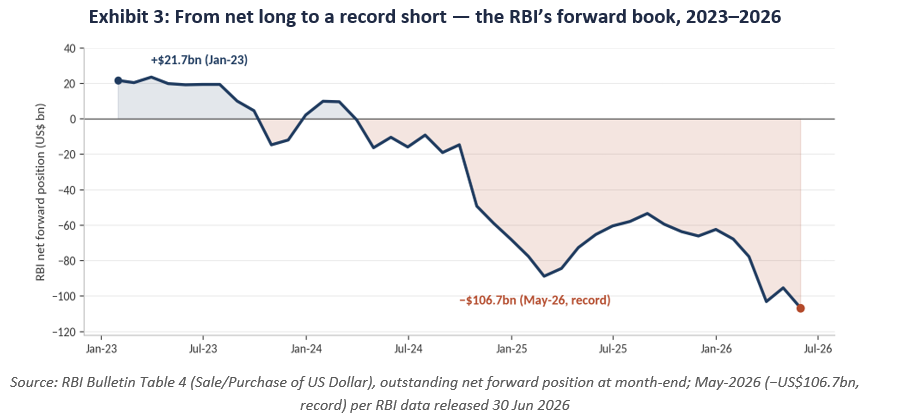
The reserve buffer is routinely cited near US$700bn. Strip out what cannot actually be deployed to defend the rupee — gold, Special Drawing Rights and the IMF tranche — and foreign-currency assets are about US$546bn (May 2026). Net off the RBI’s record net short forward book of ~US$107bn (end-May 2026) — dollars it is already committed to deliver — and usable FX is only about US$439bn, roughly a third below the headline.
More importantly, this modest deployable core of forex reserves is shrinking behind a flattering total: since their late-2024 peak, foreign-currency assets have fallen ~US$70bn (to ~US$546bn in May 2026; ~US$541bn on the latest June reading).
3. Central-bank autonomy: visible strain
Three recent, documented episodes point one way: the RBI has leaned heavily against the rupee’s slide toward the psychological ₹100 mark; it has reportedly discouraged banks from positioning against the rupee in the offshore market; and it has again reached for FCNR(B) deposit mobilisation — the same emergency lever used in 2013 but with an added kicker this time.
This time around the RBI had exhorted Indian banks to raise $ denominated deposits and bonds abroad with a commitment from the RBI that incremental costs arising from INR depreciation will be borne by the central bank.
Cumulatively, these interventions paint a picture of a central bank that is increasingly under pressure to stall the INR’s one-way slide downward.
4. And the leading forex earner is quietly dismantling
All of these challenges are kicking in even as India faces a structural shock to its Balance of Payments: a major driver of India’s foreign exchange is IT/software services — roughly half of the ~US$420bn India earns through services exports — and the quantum leap in AI worldwide has the potential to adversely impact this sector.
As we documented in our bestselling book, “Breakpoint: The Crisis of the Middle Class & The Future of Work” (2026), the impact on the IT services sector is already visible in hiring.
India has never had to defend its currency with a weakening fiscal position and an eroding services export franchise at the same time. In that sense, India has now entered uncharted territory.
Printing Money Is the Easiest Way Out — and India Is Being Pushed Toward It
Printing money — especially when government debt is overwhelmingly denominated in local currency — is perhaps the easiest way out for most governments: no default is required, and the cost is spread invisibly through inflation rather than declared through austerity.
In India, not only is this true, but three added forces now converge on that exit: the fiscal squeeze of the fading nation state; the rising interdependence of the state and the central bank; and an IT-services export machine that is being disrupted.Together, these make it likely that the government leans harder on the printing press. India is not unique in this.
Even the United States printed its way out of tricky spots like the 2008 crisis. But the US gets away with it because the dollar is the world’s reserve currency, and the world adjusts to absorb the excess (see our blog dated 7th July on the dollar’s reserve-currency status for more details). India, unfortunately, does not enjoy the same status.
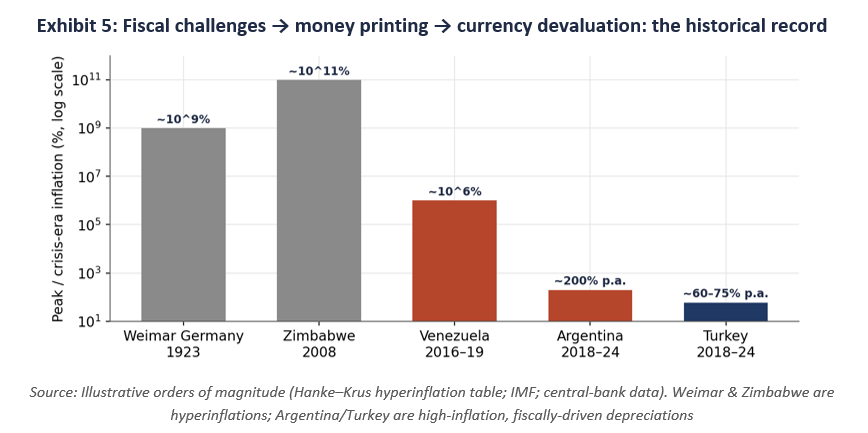
Therefore, a further slide in the INR looks likely. Across the world, history is unambiguous about the direction: where fiscal squeeze meets a compliant central bank, the currency pays.
The Silver Lining: India’s Manufactured-Exports Renaissance
Here’s the story turns from risk to an opportunity. For two decades, the forex inflows from IT services propped the rupee at a level that quietly priced Indian manufactured goods out of world markets — the classic ‘Dutch disease’, in which one booming export overvalues the currency and crowds out all the others.
As the IT tide recedes and the rupee slides, that overvaluation unwinds, and Indian manufacturing becomes globally price-competitive for the first time in a generation.
Layer on the free-trade agreements now being signed, and the conditions are in place for a genuine renaissance of manufactured exports. On a daily basis, we are ramping up our exposure to Indian exporters in our various domestic portfolios.
Two Ways in Which You Can Prepare for a Softer Rupee
First, hold part of your wealth outside the rupee. A structurally softer currency implies a 5%-a-year drag on every rupee asset before any question of relative stock returns. Furthermore, the 2013 episode, when the LRS limit was cut from $200,000 to $75,000 overnight in a currency crisis, teaches that the option to diversify is itself state dependent. Exercise it while you have the option and while your rupee assets are still holding their value. Our global products in GIFT City, Gujarat, will help you invest globally – see below.
Second, own the beneficiaries of the depreciation. The same weaker rupee that erodes rupee wealth is what finally makes Indian factories competitive in the global market: manufactured-exports champions, import-substitution and PLI beneficiaries stand to gain meaningfully. We are positioning our domestic PMS portfolios to benefit from this renaissance in India’s manufacturing exports.
Through its offices in GIFT City, Gujarat, Marcellus offers multiple funds that give investors access to the world’s largest stock markets. Ticket sizes begin at around US$5,000 (approximately ₹4.5 lakh), subject to the specific product, regulatory classification and investor eligibility. Our flagship global product is the Global Compounders Portfolio, whose track record is shown below.
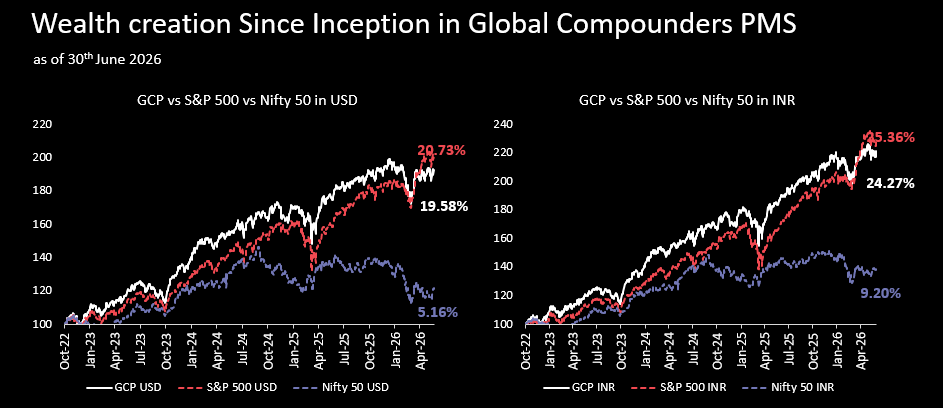
Note: Marcellus performance data is shown gross of taxes and net of fees & expenses charged till end of last month on client account. Performance fees are charged annually in December. Returns more than 1-year are annualized. Marcellus’ GCP USD returns are converted into INR using USD: INR exchange rate from RBI – Link for the reference
Note: *Since Inception performance calculated from 31st Oct 2022. The date of inception is 31st Oct 2022, being the next business day after the account got funded on 28th October 2022. S&P 500 net total return is calculated by considering both capital appreciation and dividend payouts. The calculation or presentation of performance results in this publication has NOT been approved or reviewed by the IFSCA or US SEC. Performance is the combined performance of RI and NRI strategies. S&P 500 NTR is the benchmark for the strategy. Nifty 50 is provided for reference to illustrate the relative performance of the US and Indian markets. Past performance pertains to Marcellus’ GCP PMS strategy, not to this IFSC Retail Scheme and is not indicative of future results.
Marcellus GCP PMS is offered by Marcellus Investment Managers GIFT Branch in a segregated managed accounts format.
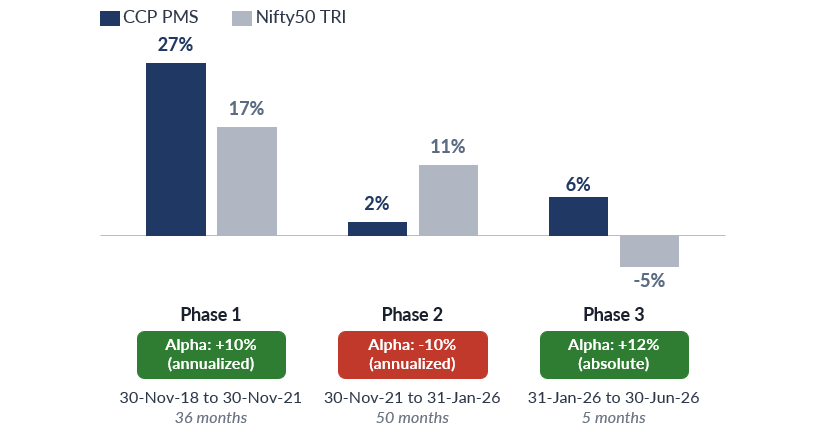
In our Consistent Compounders Portfolio (CCP), we invest in 19 Indian companies including manufactured goods exporters. More generally, this portfolio focuses on investing in clean, well-managed franchises providing essential goods & services to Indian households and companies.
Consistent Compounders Portfolio — CCP PMS vs Nifty50 TRI, annualized returns by phase
Consistent Compounders Portfolio — CCP performance vs Nifty50 TRI, by period
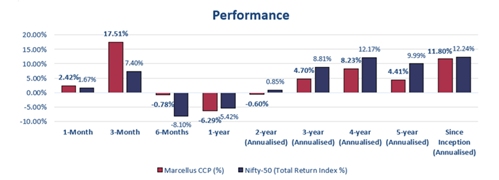
Note: Performance data for the domestic portfolio is shown net of fixed fees and expenses, and net of performance fees, charged till the last quarter end for client accounts. Short-period returns are absolute; longer-period returns are annualized. The calculation or presentation of performance results has NOT been approved or reviewed by the SEC, SEBI or any other regulatory authority. Past performance is not indicative of future results.
Note: Marcellus’ performance data is shown gross of taxes and net of fees & expenses charged till end of last month on client account. Performance fees are charged annually in December. Returns more than 1 year are annualized. Marcellus’ GCP USD returns are converted into INR using USD: INR exchange rate from RBI – Link for the reference
Note: * Since Inception performance calculated from 31st Oct 2022. The date of the inception is 31st Oct 2022, the next business day after the account got funded on 28th October 2022. S&P 500 net total return is calculated by considering both capital appreciation and dividend payouts. The calculation or presentation of performance results in this publication has NOT been approved or reviewed by the IFSCA or US SEC. Performance is the combined performance of RI and NRI strategies. S&P 500 NTR is the benchmark for the strategy. Nifty 50 is provided for reference to illustrate the relative performance of the US and Indian markets. Past performance pertains to Marcellus’ GCP PMS strategy, not to this IFSC Retail Scheme and is not indicative of future results.
If you would like to invest with us, please scan the QR code below.

Click here for details about our regulatory registration and licensing information.
Disclaimer:
This material is for informational purposes only and does not constitute investment advice or research. Marcellus Investment Managers Private Limited (“Marcellus”) is regulated by the International Financial Services Centres Authority (IFSCA) as a Fund Management Entity (Retail) offers Retail and Non-Retail products and is registered with the U.S. Securities and Exchange Commission (SEC) as an Investment Advisor. The PMS strategy, Category III AIF products (non-retail schemes), and IFSCA retail schemes are distinct offerings with different regulatory frameworks, risk profiles, fee structures, and investment thresholds. Minimum investment amounts referenced (e.g., ~US$5K) are applicable to specific IFSCA retail schemes and may not apply to PMS or Category III AIF products. Investors should refer to product-specific documents for details before investing. This communication is not a solicitation in jurisdictions where Marcellus is not regulated. It is confidential and intended solely for the addressed recipient; unauthorized use or distribution is prohibited. carefully read the Disclosure Document, Form ADV, Form CRS and any other documents or disclosures provided to them by Marcellus, as applicable. Actual results may differ materially from those suggested in this note due to risk or uncertainties associated with our expectations with respect to, but not limited to, exposure to market risks, general economic and political conditions globally, inflation, etc. Information provided is based on data available at the time of preparation and may change without notice. Marcellus makes no representation regarding accuracy or completeness and assumes no obligation to update. Recipients should rely on their own judgment and consult independent legal, tax, and financial advisors before making any investment decisions. Investments are subject to market risks and uncertainties. This material may include “forward looking statements”. All forward-looking statements involve risk and uncertainty. Any forward-looking statements contained in this document speak only as of the date on which they are made. While historical data illustrates the potential benefits of geographic diversification, global investing involves risks may not present in domestic portfolios. These include the potential for adverse currency fluctuations—such as an appreciating Indian Rupee offsetting global gains—differing regulatory environments, and exposure to global geopolitical events. Past performance is not indicative of future results, and there is no assurance that investment objectives will be achieved. The calculation or presentation of performance results in this publication has NOT been approved or reviewed by the SEC, SEBI or any other regulatory authority. Marcellus, its affiliates, employees, and authors may have financial interests in securities discussed. To the fullest extent permitted by law, Marcellus disclaims all liability arising from the use of this material.