OVERVIEW
POPULAR ARTICLES
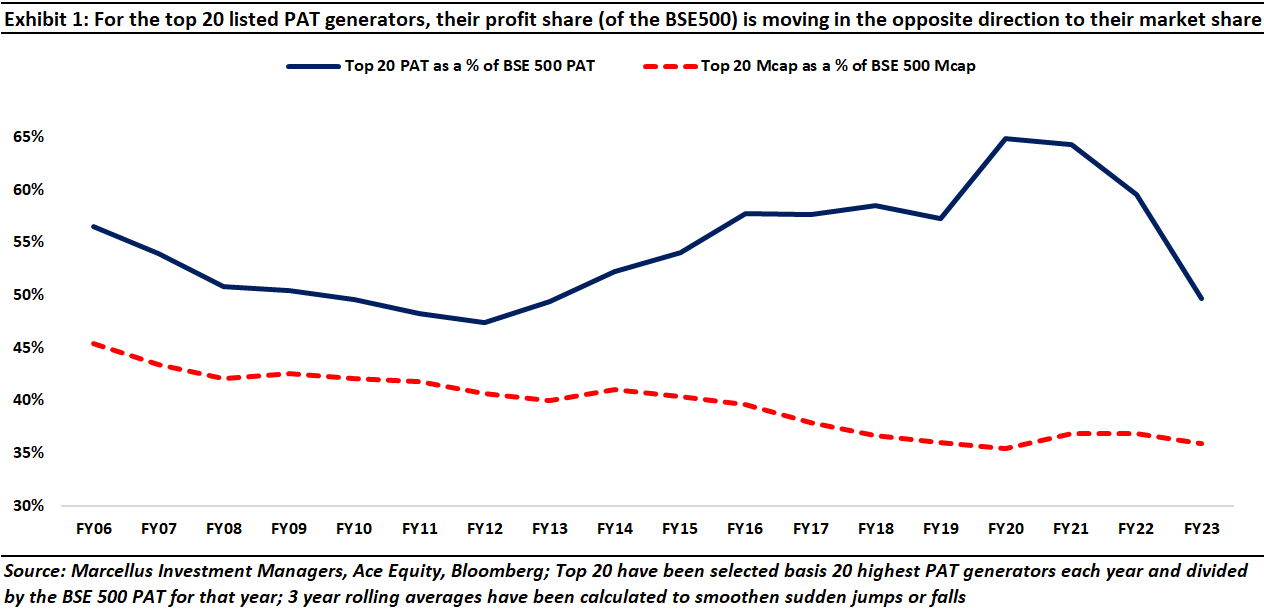
Although India’s 20 most profitable listed companies (the ‘Megacaps’) account for around 50% of the profits generated by the BSE 500 companies, these Megacaps account for just 34% of the BSE500’s market cap (down from 41% a decade ago and 45% nearly two decades ago). Indian retail investors’ fascination with SmallCaps seems to be the primary reason for the decline in the market cap weight of the Megacaps. As a result, on a P/FCF basis, not only are the Megacaps cheaper than every other segment of the Indian stock market, but they are also trading at the lowest valuations we have seen for Megacaps since 2016.
“Buying something for less than its value. In my opinion, this is what it’s all about—the most dependable way to make money. Buying at a discount from intrinsic value and having the asset’s price move toward its value doesn’t require serendipity; it just requires that market participants wake up to reality. When the market’s functioning properly, value exerts a magnetic pull on price.” – Howard Marks in his book The Most Important Thing: Uncommon Sense for the Thoughtful Investor (2011)
As the country joined up, profits got democratized…
As is well understood now, over the past decade, India has seen a dramatic upgrade in its physical and virtual infrastructure. With the national highway network seeing a near doubling from ~79K km in 2012 to ~140K km in 2022, domestic air travel passengers more than doubling from ~58 mn in 2012-13 to ~136 mn in 2022-23, households with broadband connections growing ~7x from ~20 mn in 2013 to ~137 mn in 2023, and the number of bank accounts growing ~3x from ~100 crores in 2015 to ~300 crores in 2023, doing business in India has become easier than it was in the past.
The post-Covid recovery, aided by easier availability of credit due to the dramatic acceleration in the use of UPI and ever-widening spread of social media, has surely helped smaller companies find new customers and new ways to reach existing customers (see our 7th February 2023 blog, The Polarization of Corporate Profits in India is Reducing). However, the long-term structural trend seems to be that the networking of India is helping large companies spread their wings at a national level and make more money than ever before. As shown in the Exhibit 1 above, the top 20 listed companies’ profit share as a percentage of BSE 500’s has remained steady at ~50% in the last decade.
…and the Megacaps’ market capitalization share got compressed
Even as the profit share of India’s Megacaps has remained steady over the past decade, their market cap share has fallen relentlessly – from 41% of the BSE500’s market cap in 2013 to around 34% now. Interestingly, this anomalous situation does not exist in the only other large stock market in the world which has thrived over the past decade, the United States. In fact, if we were to look at the concentration of profits for the top 20 companies in the US vis-à-vis the S&P 500, it has risen over the last 10 years, but so has their market capitalization concentration. The table below highlights how the Indian and American stock markets have moved in opposite directions when it comes to profit concentration vs market cap concentration.
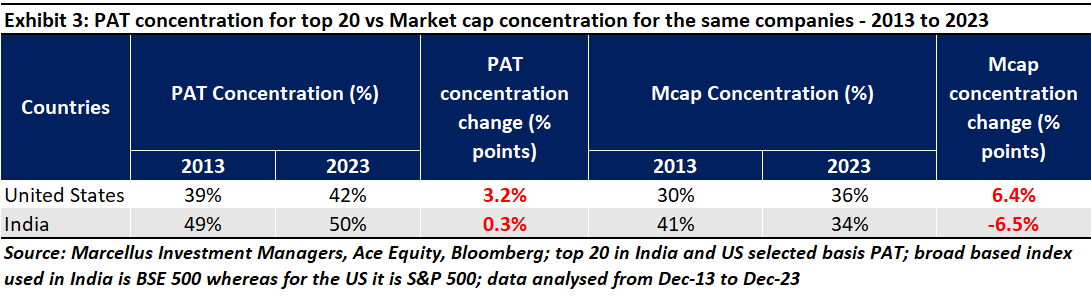
So, why is profit concentration in India moving in the opposite direction to market cap concentration when the same is NOT happening in the United States?
The 6%-point rise in market capitalization concentration in the USA is largely a result of the rise of passive investing in the country. Researchers from UCLA and the University of Minnesota argue in their prescient paper on the subject that flows in the United States have become more ‘inelastic’ to valuation and price changes owing to a massive rise in passive investing. To be precise, passive funds’ share in the ownership of an average listed American company has more than trebled from 6% in 2013 to 19% in 2023. In fact, according to the Investment Company’s Factbook, fee-based advisers had 41% of their clients’ money invested in ETFs in 2021, up from 10% in 2011). What this essentially means is that the American stock market has created a dynamic where large companies keep attracting investors through passive investing, just by dint of their market cap.
In contrast, in India, whilst the profit concentration of the top 20 has remained steady at around 50% in the last decade, their market capitalization concentration has reduced by nearly 7% points, meaning equity markets in India have actually punished the best profit generators in the country vis-à-vis the rest of the companies.
Rise of the Indian retail investor (and of SmallCaps)
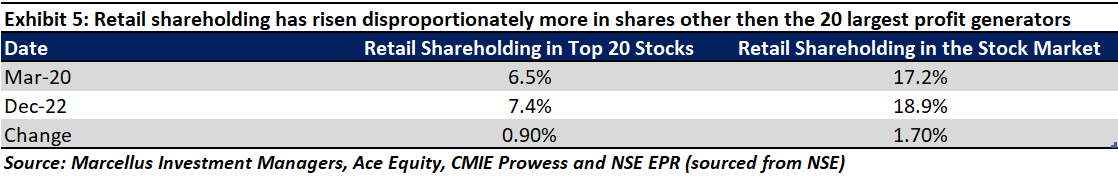
A key reason for the divergence between profit vs mkt cap concentration in India is the meteoric rise of the Indian retail investor. As the table below shows, in the aftermath of Covid, retail investors have flooded into the Indian stock market. In fact, the number of demat accounts has increased from ~40 mn in 2020 to ~140 mn now, growing by 3.5x in the span of just 3 years!
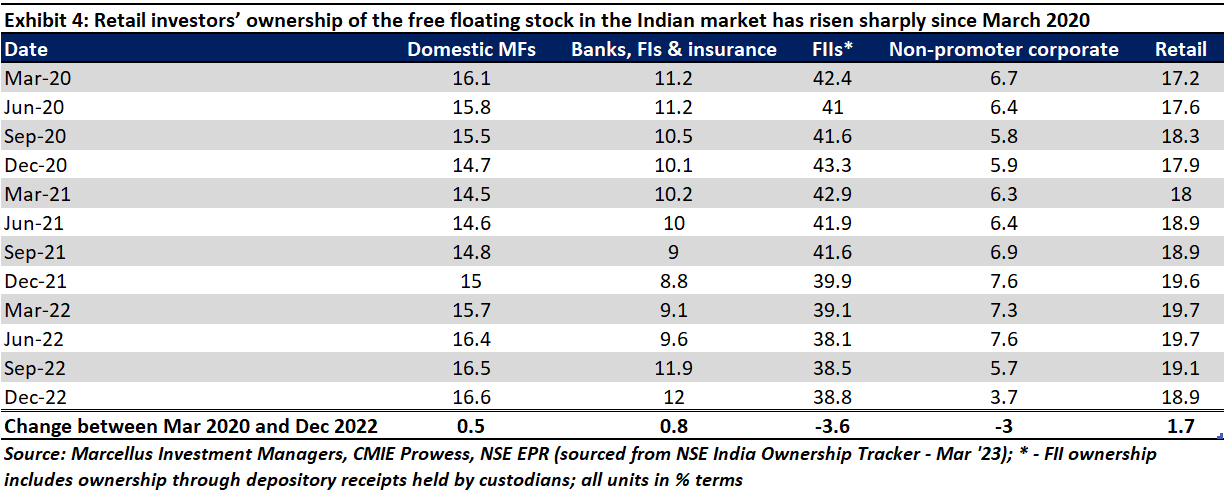
As the last column of exhibit 4 shows, the shareholding of retail investors has risen (as a % of the free float in India) by 170 bps post-Covid. What is remarkable is that the rise in retail shareholders’ holdings in top 20 companies (or Mega caps) has only been ~90 bps over this period (from March 2020 to December 2022; see exhibit below). This implies that retail investors’ investments in shares other than the Megacaps has been disproportionately higher.
Why does any of this matter?
The disproportionate interest that Indian retail investors have taken in stocks beyond the Megacaps has made the 20 largest profit generators cheaper: (a) relative to their recent history; and (b) relative to the rest of the Indian stock market.
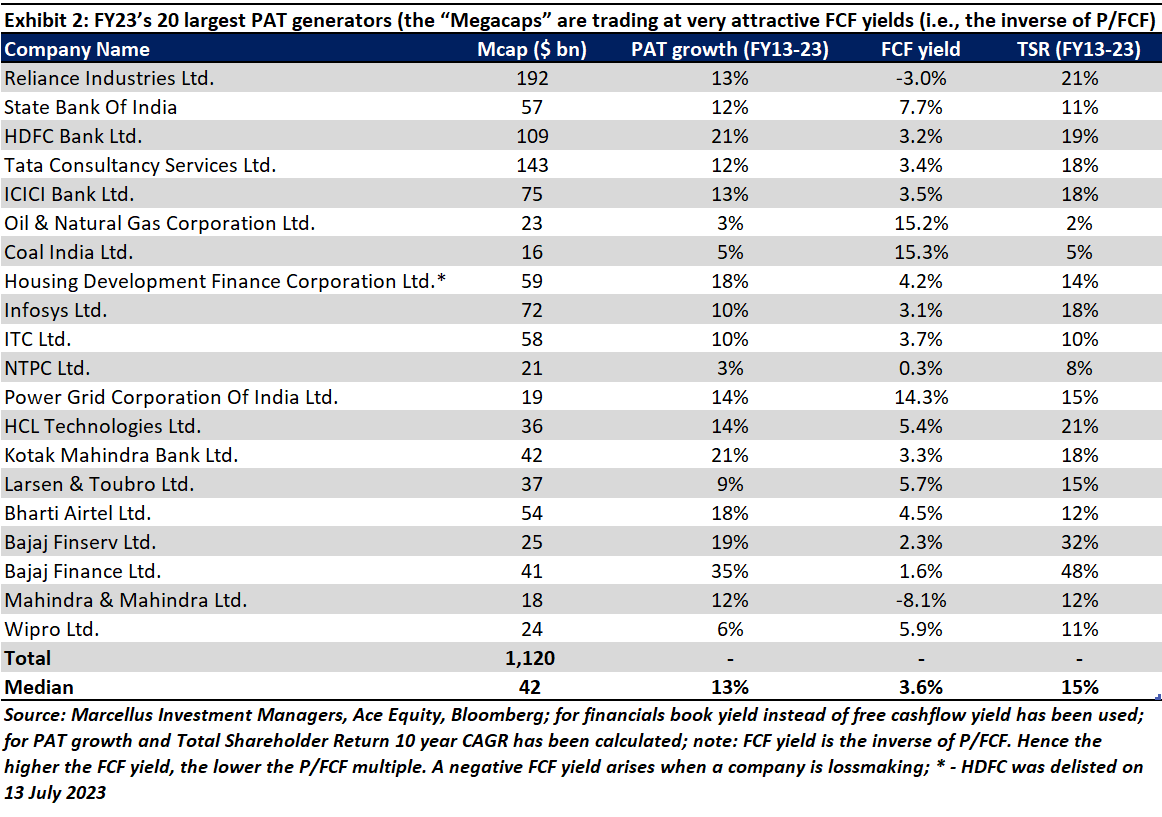
To quantify exactly how big an opportunity this is we looked at the free cashflow yields (i.e. the inverse of the Price / Free cashflow) of the Megacaps (the top 20 by PAT), ultra large caps (the Nifty 50), and the broader market (the BSE 500). We found that the FCF yield differential between Megacaps and BSE 500 has widened (see exhibit below) to levels not seen since 2016 i.e., on a P/FCF basis, Indian Megacaps are the cheapest they have been – relative to the broader Indian market – since 2016.
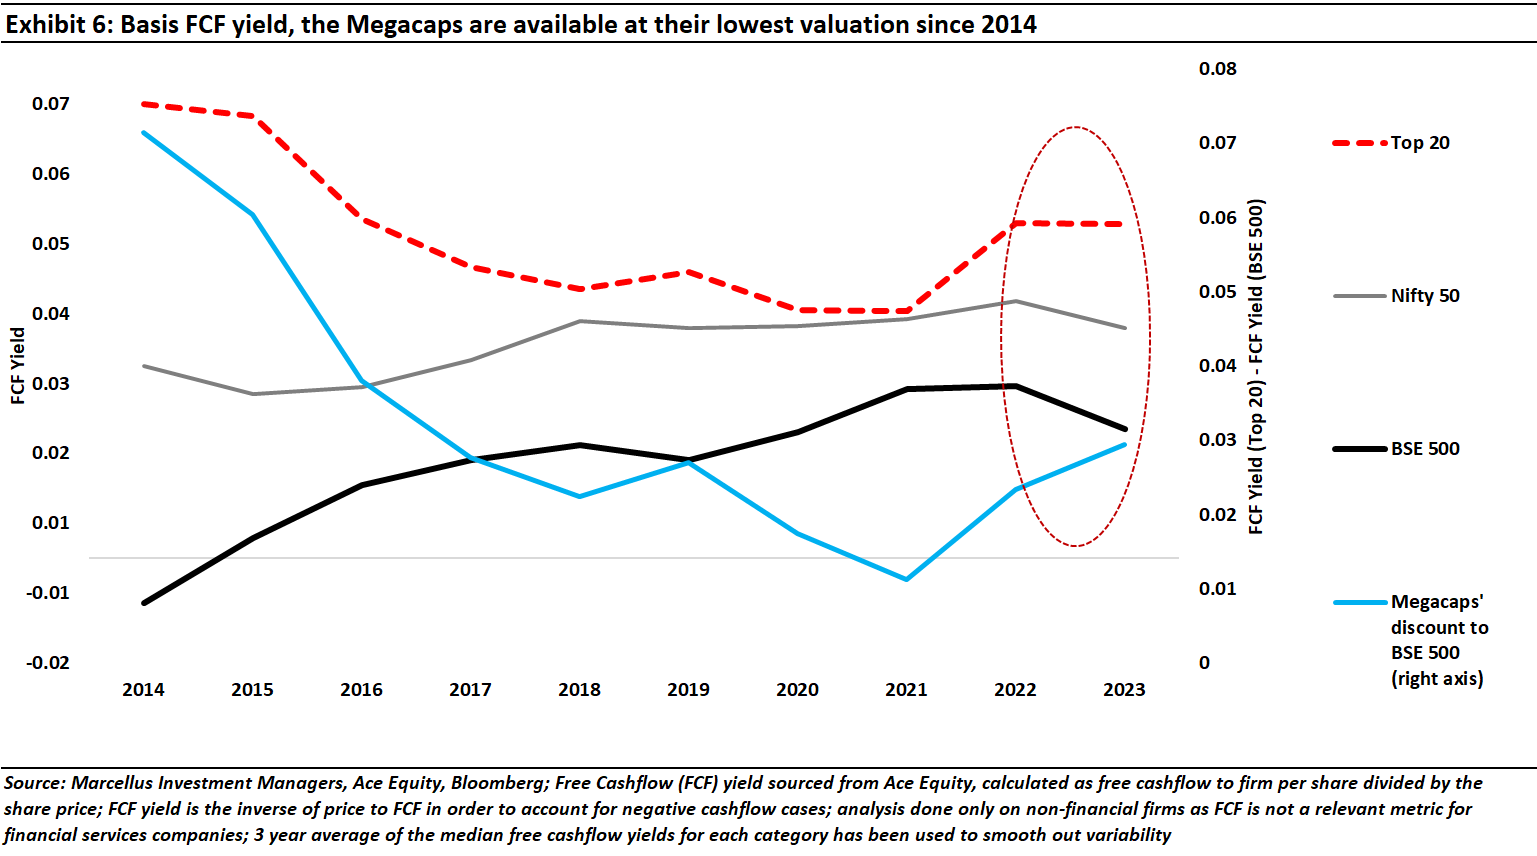
To the extent that the same economic opportunities are available for all Indian companies, there is no reason for the 20 largest profit generators to trade at a discount to the rest of the Indian stock market. Therefore, this ~300 bps discount between the Megacaps and the BSE500 should get closed in in the years to come as the Megacaps rally towards fair value.
Nandita Rajhansa and Saurabh Mukherjea work for Marcellus Investment Managers (www.marcellus.in). Amongst the companies mentioned in this note, HDFC Bank, Tata Consultancy Services, ICICI Bank, Infosys, Kotak Mahindra Bank, and Bajaj Finance are part of Marcellus’ various portfolios. Nandita and Saurabh may be invested in these companies and their immediate relatives may also have stakes in the described securities. The described stocks/securities are for educational/illustration purpose only and not recommendatory.
Disclaimer:
If you want to read our other published material, please visit https://marcellus.in/pms-investment-blog/
Note: the above material is neither investment research, nor investment advice. Marcellus does not seek payment for or business from this material/email in any shape or form. Marcellus Investment Managers Private Limited (“Marcellus”) is regulated by the Securities and Exchange Board of India (“SEBI”) as a provider of Portfolio Management Services. Marcellus is also a US Securities & Exchange Commission (“US SEC”) registered Investment Advisor. No content of this publication including the performance related information is verified by SEBI or US SEC. If any recipient or reader of this material is based outside India and USA, please note that Marcellus may not be regulated in such jurisdiction and this material is not a solicitation to use Marcellus’s services. This communication is confidential and privileged and is directed to and for the use of the addressee only. The recipient, if not the addressee, should not use this material if erroneously received, and access and use of this material in any manner by anyone other than the addressee is unauthorized. If you are not the intended recipient, please notify the sender by return email and immediately destroy all copies of this message and any attachments and delete it from your computer system, permanently. No liability whatsoever is assumed by Marcellus as a result of the recipient or any other person relying upon the opinion unless otherwise agreed in writing. The recipient acknowledges that Marcellus may be unable to exercise control or ensure or guarantee the integrity of the text of the material/email message and the text is not warranted as to its completeness and accuracy. The material, names and branding of the investment style do not provide any impression or a claim that these products/strategies achieve the respective objectives. Further, past performance is not indicative of future results. Marcellus and/or its associates, the authors of this material (including their relatives) may have financial interest by way of investments in the companies covered in this material. Marcellus does not receive compensation from the companies for their coverage in this material. Marcellus does not provide any market making service to any company covered in this material. In the past 12 months, Marcellus and its associates have never i) managed or co-managed any public offering of securities; ii) have not offered investment banking or merchant banking or brokerage services; or iii) have received any compensation or other benefits from the company or third party in connection with this coverage. Authors of this material have never served the companies in a capacity of a director, officer or an employee.
This material may contain confidential or proprietary information and user shall take prior written consent from Marcellus before any reproduction in any form.