OVERVIEW
POPULAR ARTICLES

Whilst India remains the most energy intensive of the world’s four largest economies (i.e., we use more power per $1 of GDP than USA, China, and Japan), India today is far more efficient in the use of oil & coal than it was a decade ago. This improved efficiency in the use of energy has essentially freed up around 3% of Indian GDP (or roughly US$ 100 bn per annum) for the country to spend on other things. Enhanced efficiency in the use of oil & coal has also reduced India’s energy import bill by a similar amount (3% of GDP) with obvious ramifications for the stability of the Indian rupee.
The general perception in the media is that India is at the mercy of Oil Producing and Exporting Countries (OPEC), and therefore a rally in fuel prices often triggers all sorts of manic responses in India. For example, when crude oil prices rose by 47% in the first half of this calendar year (courtesy Russia’s attack on Ukraine) the Nifty corrected by 10%.
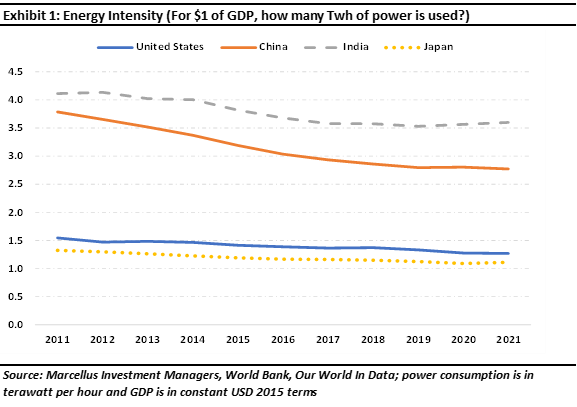
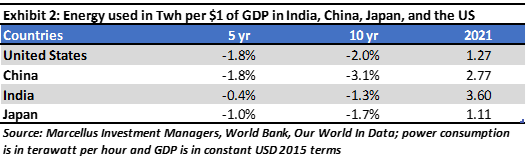
The real story of India’s energy consumption is actually very different from the popular picture. Firstly, whilst India’s energy intensity, i.e., total power consumption in India divided by GDP, is significantly higher than that of the USA, China, and Japan, it has improved significantly over the past decade. Specifically, India’s energy intensity has fallen at 1.3% per annum over the past decade. Even more encouragingly, as is evident from Exhibit 1, there is enormous room for the country to raise its game on this front – Japan and USA use one-third as much energy as India for every of $1 of GDP generated and both of these countries and China have improved their energy intensity far more rapidly than India over the past decade. (Japan is the most efficient user of energy amongst the Big 4 economies. To understand how Japan got there, see our blog dated 28th May 2022, Japan 1970s, not USA 1970s, is the better guide to what lies ahead for India.)
Economic implications of improved efficiency in energy usage
India’s enhanced efficiency in the use of energy (i.e., the nation’s ability to use less and less energy to generate $1 of GDP) has in all likelihood been driven by the falling share of manufacturing in India’s GDP – over the last decade, industry’s share of Indian GDP has fallen from ~30% to ~25% (source: https://data.worldbank.org/indicator/NV.IND.TOTL.ZS?end=2021&locations=IN&start=2011&view=chart). The improvement in the energy intensity of the Indian economy has broader economic ramifications.
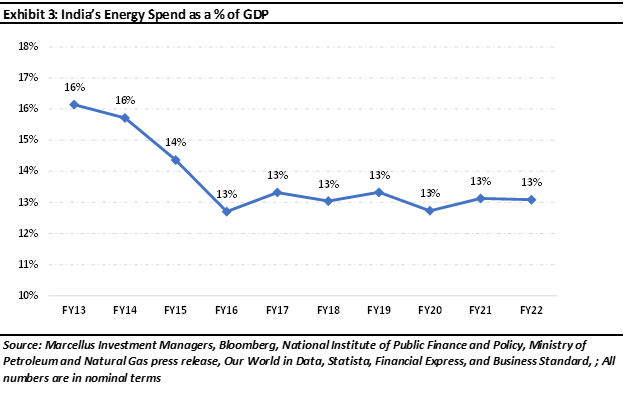
If we consider energy consumption spend in India as a percentage of GDP, it has fallen from 16% a decade ago to 13% in FY22 (see the exhibit below). This essentially means that around 3% (around US$ 100 bn) of our GDP has been freed up. To give some context regarding how significant this sum of money is, the Government allocated an amount which accounted for around 3% of the country’s GDP to military spending in the FY22 budget. This is the third highest spend on military across the globe! (Source: https://timesofindia.indiatimes.com/business/india-business/budget/data/how-india-spends).
India’s energy imports as a percentage of GDP have been falling
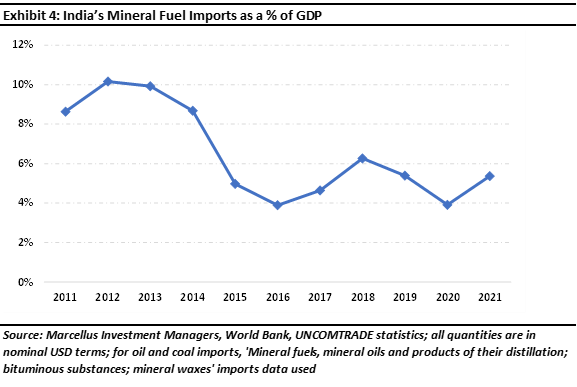
Given that India imports upwards of 80% of its total fuel requirement, India’s improved energy efficiency has lowered the nation’s import bill. Over the past decade, oil and coal imports as a percentage of the GDP has reduced from 9-10% to 4-5% (see chart below).
Investor Implications
Whilst India’s current account deficit (CAD) touching 3% of GDP is raising blood pressure levels amongst some investors, this figure would have been at least twice as high had India not become a more efficient user of energy over the past decade. As it happens, with remittances from non-resident Indians plus inflows of capital from foreign companies and foreign investors hovering
around 1.5-2% of GDP, a Balance of Payments deficit of 1-1.5% (i.e., 3% CAD less the capital inflows of 1-1.5%) can be comfortably financed by the RBI’s forex reserves. This is in stark contrast to the position that India faced in 2013 where a far more modest monetary tightening by the Federal Reserve, relative to what we are currently witnessing, sent the rupee tumbling from Rs 54/$ to Rs 62/$ in the space of six months. Such a currency meltdown is highly unlikely now largely because of India’s improved energy efficiency.
Looking forward, as India further improves its energy efficiency (even China is more than twice as efficient as India on this front), even bigger savings will accrue to the Indian economy. These gains from using less coal & oil per $1 of GDP, if invested sensibly, can further spur economic growth. In fact, the 13th May 2022 issue of the Economist highlights this latent potential of the Indian economy:d 1.5-2% of GDP, a Balance of Payments deficit of 1-1.5% (i.e., 3% CAD less the capital inflows of 1-1.5%) can be comfortably financed by the RBI’s forex reserves. This is in stark contrast to the position that India faced in 2013 where a far more modest monetary tightening by the Federal Reserve, relative to what we are currently witnessing, sent the rupee tumbling from Rs 54/$ to Rs 62/$ in the space of six months. Such a currency meltdown is highly unlikely now largely because of India’s improved energy efficiency.
“As the country emerges from the pandemic, however, a new pattern of growth is visible. It is unlike anything you have seen before. An indigenous tech effort is key. As the cost of technology has dropped, India has rolled out a national “tech stack”: a set of state-sponsored digital services that link ordinary Indians with an electronic identity, payments and tax systems, and bank accounts. The rapid adoption of these platforms is forcing a vast, inefficient, informal cash economy into the 21st century. It has turbocharged the world’s third-largest startup scene after America’s and China’s.
Alongside that, global trends are creating bigger business clusters. The IT-services industry has doubled in size in a decade, helped by the cloud and a worldwide shortage of software workers…. India ranks third for solar installations and is pioneering green hydrogen. As firms everywhere reconfigure supply chains to lessen their reliance on China, India’s attractions as a manufacturing location have risen, helped by a $26bn subsidy scheme. Western governments are keen to forge defence and technology links. India has also found a workaround to redistribute more to ordinary folk…a direct, real-time, digital welfare system that in 36 months has paid $200bn to about 950m people.” (Source: https://www.economist.com/leaders/2022/05/13/the-indian-economy-is-being-rewired-the-opportunity-is-immense).
Nandita Rajhansa and Saurabh Mukherjea work for Marcellus Investment Managers (www.marcellus.in).
Note: the above material is neither investment research, nor investment advice. Marcellus does not seek payment for or business from this material/email in any shape or form. Marcellus Investment Managers Private Limited (“Marcellus”) is regulated by the Securities and Exchange Board of India (“SEBI”) as a provider of Portfolio Management Services. Marcellus is also a US Securities & Exchange Commission (“US SEC”) registered Investment Advisor. No content of this publication including the performance related information is verified by SEBI or US SEC. If any recipient or reader of this material is based outside India and USA, please note that Marcellus may not be regulated in such jurisdiction and this material is not a solicitation to use Marcellus’s services. This communication is confidential and privileged and is directed to and for the use of the addressee only. The recipient, if not the addressee, should not use this material if erroneously received, and access and use of this material in any manner by anyone other than the addressee is unauthorized. If you are not the intended recipient, please notify the sender by return email and immediately destroy all copies of this message and any attachments and delete it from your computer system, permanently. No liability whatsoever is assumed by Marcellus as a result of the recipient or any other person relying upon the opinion unless otherwise agreed in writing. The recipient acknowledges that Marcellus may be unable to exercise control or ensure or guarantee the integrity of the text of the material/email message and the text is not warranted as to its completeness and accuracy. The material, names and branding of the investment style do not provide any impression or a claim that these products/strategies achieve the respective objectives. Further, past performance is not indicative of future results. Marcellus and/or its associates, the authors of this material (including their relatives) may have financial interest by way of investments in the companies covered in this material. Marcellus does not receive compensation from the companies for their coverage in this material. Marcellus does not provide any market making service to any company covered in this material. In the past 12 months, Marcellus and its associates have never i) managed or co-managed any public offering of securities; ii) have not offered investment banking or merchant banking or brokerage services; or iii) have received any compensation or other benefits from the company or third party in connection with this coverage. Authors of this material have never served the companies in a capacity of a director, officer or an employee.
This material may contain confidential or proprietary information and user shall take prior written consent from Marcellus before any reproduction in any form.