MeritorQ uses forensic ratios to evaluate the accounting quality of Indian companies. As we highlighted in our February newsletter – Forensic Accounting Using Quant Methods Boosts Returns – our accounting checks can identify accounting frauds well in advance of the actual drawdown event. Using the specific examples of two companies in this newsletter, we discuss how accounting ratios helped us in classifying these companies in the ‘Zone of Thuggery’ long before their accounting malpractices were publicly known. Further, we discuss the size, sector distribution, and transition rates of companies across forensic accounting deciles.
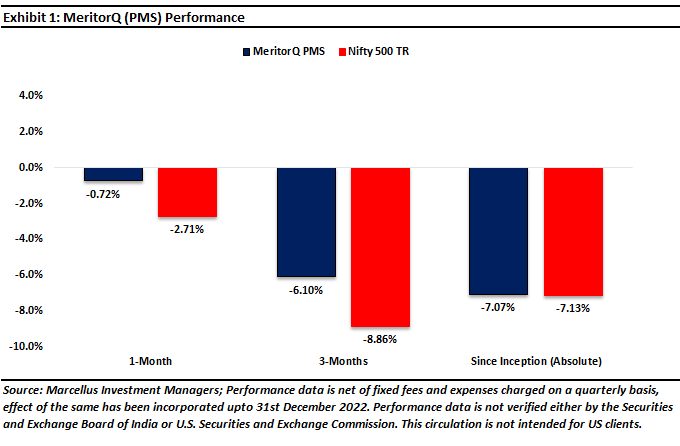
Since its launch on 15th November 2022 MeritorQ has generated -7.07% return whilst the NIFTY 500 Total Return Index has generated -7.13%. The returns for MeritorQ are stated in terms of price returns and calculated net of fixed fees and expenses charged on a quarterly basis.
Why is forensic accounting such a big deal?
“I can’t afford the operation, but would you accept a small payment to touch up the x-rays” – Warren Buffett
The above comment is taken from Buffett’s 1991 shareholder letter [link] in which he describes a conversation between a seriously ill patient and his doctor after x-ray revealed bad news about the patient’s health condition. Rather than accepting the diagnosis of his deteriorating health, the patient immediately responded to the dreadful news by asking the doctor to simply “touch up” the x- ray report. Buffett uses this story to warn investors about companies that try to hide the truth about their deteriorating business’ health by “touching up” their financial statements. Buffett then prophetically adds “In the long run, trouble awaits management that paper over operating problems with accounting maneuvers. Eventually, managements of this kind achieve the same result as the seriously ill patient.”
Indeed, a company’s use of accounting trickery to paper over poor economic health is no more effective than a doctor touching up of x-rays to improve a patient’s physical health. Such gimmicks are pointless as the company’s deteriorating condition is bound to ultimately come to light one day.
We discuss two case studies of companies that had papered over their financial performance and business problems to delay the inevitable bad news and how different metrics in our forensic screen helped identify them in advance.
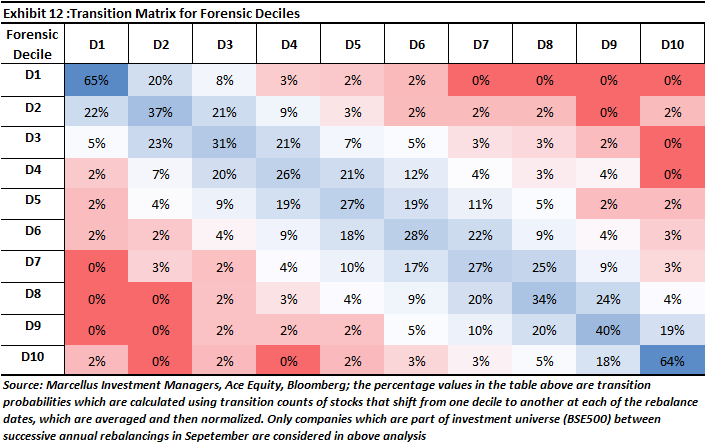
Recall that in MeritorQ, the forensic screening process buckets BSE 500 companies (excluding insurance companies) at each semi-annual rebalance date into 10 equal sized buckets (deciles) based on their ranks. These ranks are calculated basis the 11 forensic ratios for non-financial companies. This forensic screening process results in the cleanest and best companies ending up in the top 3 deciles, questionable ones in the next 3, and earnings manipulators in the bottom 4 deciles. Companies in the bottom 4 deciles (“Zone of Thuggery”) are completely excluded from any further analysis. [Our February newsletter, describes the MeritorQ investment process in more detail.]
Case 1: Amtek Auto (Amtek)
Amtek Auto was an auto components supplier founded in 1985. During the initial phase, riding on the success of being a supplier to Maruti, the company made inroads with new customers like Honda, Eicher Motors, etc., and launched new products. However, from 2001 onwards, Amtek consummated more than fifteen acquisitions that would come to define the company over the next fifteen years, until the start of its collapse in 2015. While the most widely cited reason for Amtek’s failure is aggressive capital allocation (mostly acquisitions) gone awry, our forensic framework also suggested that there was a substantial possibility of the company misrepresenting their financial statements long before it went bust.
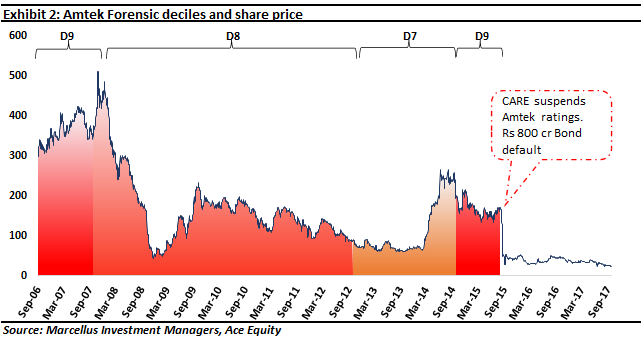
As exhibit 2 shows, Amtek was consistently classified in zone of thuggery (D7-D10) throughout our accounting back-test. This weak accounting score was due to multiple accounting red flags, and this saved us from the massive share price drop in September 2015 once the company defaulted on Rs. 800 crores of bond payments.
Now, let us use the MeritorQ forensic accounting model to walk through the problems in Amtek Auto’s financial statements using just one ratio: cashflow from operations to Earnings Before Interest, Depreciation, and Amortization (or CFO:EBITDA).
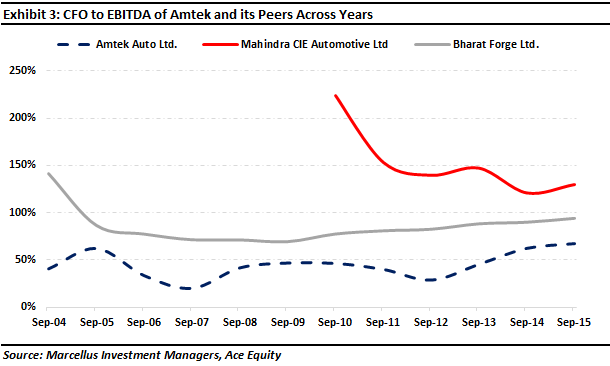
For those who are unfamiliar with accounting measures, CFO:EBITDA helps measure how much of the booked profits are converted into actual cash by the companies. In our forensic framework, we define CFO:EBITDA as 6Y Cumulative CFO/ 6Y Cumulative EBITDA to capture cross cycle conversion of operating profits into cash. As shown in exhibit 3, this ratio for Amtek was consistently lower than its auto ancillary peers thus highlighting a major red flag for the company.
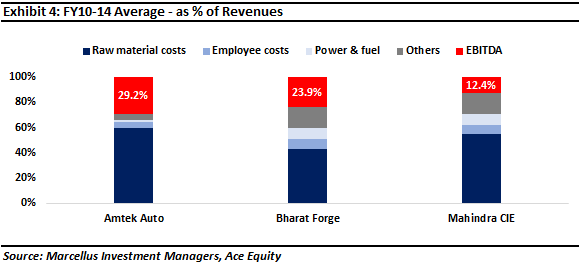
The Amtek example also highlights that looking at just earnings is not enough because Amtek Auto’s standalone EBITDA margins were among the best in the Indian auto ancillary space. And whilst Amtek Auto’s standalone raw material costs were significantly higher than for its peers, it had extremely low overheads such as employee costs, power and fuel, etc (see exhibit 4).
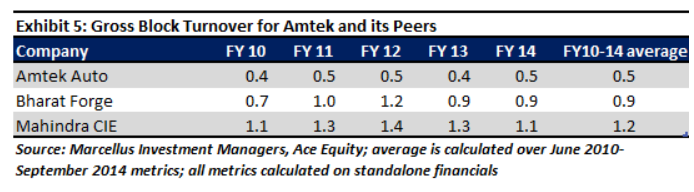
However, as exhibit 5 shows, Amtek’s gross block turnover (or simply revenue divided by the fixed assets of a company) was significantly lower than its peers, which suggested a reliance on in-house manufacturing versus outsourced manufacturing.
The other aspect which shows if a company has a significantly better cash flow conversion is whether it has a leaner working capital cycle. In Amtek’s case, the working capital cycle was significantly inferior compared to its peers. Particularly worrisome was Amtek’s high trade debtor days (or the number of days that the company’s clients take to pay them) even relative to Bharat Forge. This was particularly intriguing considering that exports – where credit periods to customers tend to be typically higher – constituted a larger proportion of revenues for Bharat Forge.
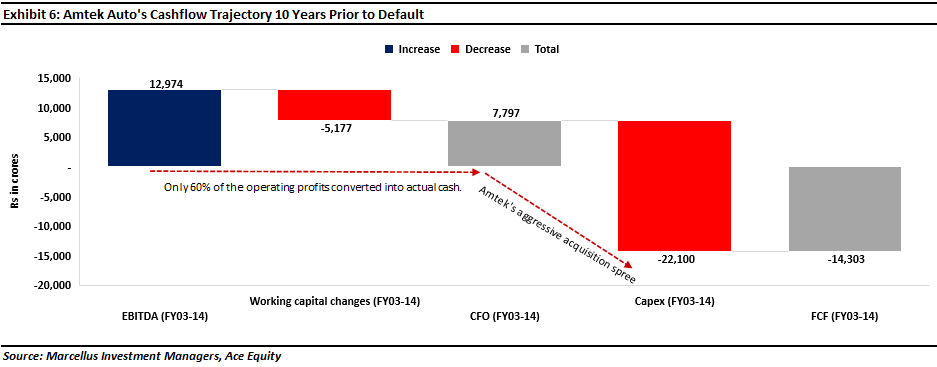
The result – as exhibit 6 shows – was higher working capital levels and lower gross block turnover. This led to Amtek Auto’s CFO significantly lagging its reported operating profits. With just 60% of the operating profits being converted into cash over FY 2003 to FY 2014, the published financial statements raised questions about the sanctity of the company’s reported operating profits.
Case 2: Eros International Media Ltd (EIML)
Eros group has been present in the Indian film industry for around thirty years and EIML has its distribution network in all the theatrical territories in India. EIML is engaged in acquisition, production, co-production, and distribution of Indian films across various formats. It owns a content library of 2000+ films and music. The international and digital rights for the new film content for the entire world excluding India are licensed to Eros Worldwide FZ-LLC (holding company of EIML).
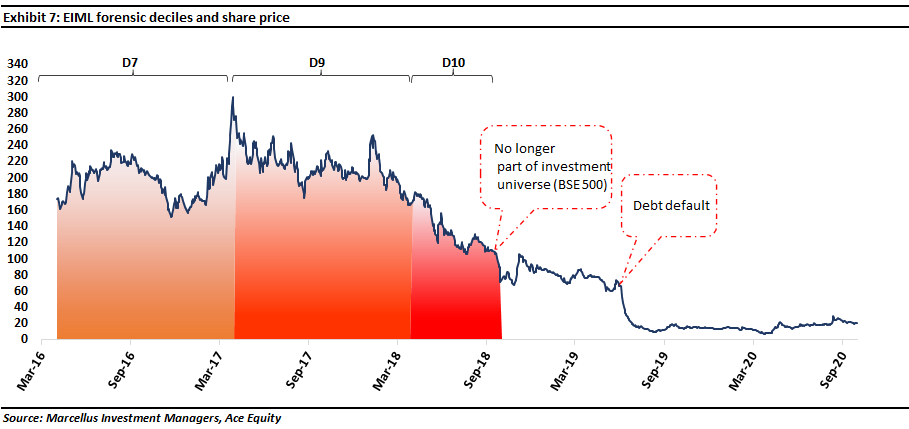
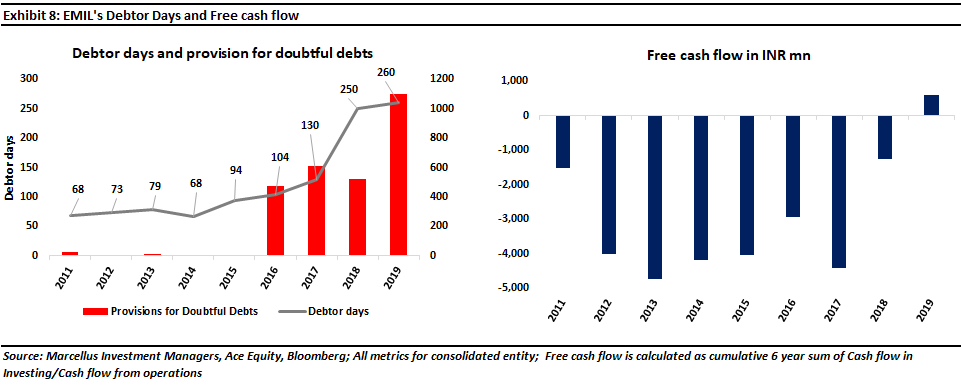
EIML consistently gets categorized in deciles D7 to D9 from 2015 onwards (see exhibit 7 below). The main reason for low accounting scores is the high and rising trade receivables and consistently negative free cash flow which showed that the company spends on content and production costs were unable to keep up with revenue generation (see exhibit 8 below).
A glance at consolidated financial statements of EIML for FY15, FY16, and FY17 reveals that ~14-25% of company’s receivables were due to related party entities. Some of these receivables are also written off in subsequent years (refer to red bars in exhibit 8 below).
Though we do not check related party transactions directly in the forensic screen, we usually do see the number of related party trade and non-trade related loans/advances and similar dubious transactions entered between the group companies. Between 2015 to June 2019, Eros Plc (parent to EIML and listed on NYSE) was subject to allegations of accounting discrepancies by short sellers on similar counts (source: link)
The company managed to shake off these allegations until June 2019 when it was downgraded to default by CARE credit ratings ostensibly “due to slow down in collection from debtors leading to cash flow issues in the company” (see Care Ratings report). The company somehow managed to struggle on until August 2021 when it announced that it would be unable to produce its March FY21 results on time as it was conducting a review into inappropriate revenue recognition during FY20 and merger-related balance sheet adjustments.
Few other facts about the forensic framework
We address some commonly asked questions on the forensic screening process in MeritorQ.
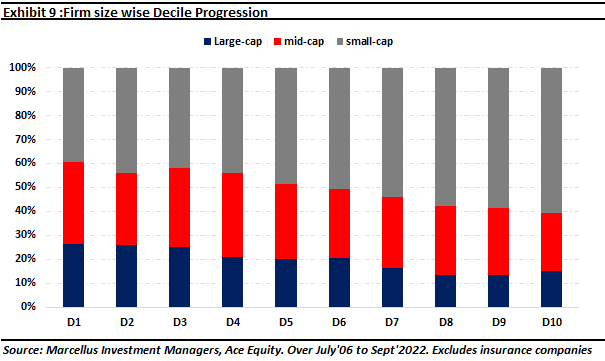
Size and sector distribution: Looking at the size distribution across forensic accounting deciles over the back-test period (July’06 to Sept’22) we find that small caps constitute ~60% of the population within D7- D10 deciles and 40-50% in the D1-D4.
On the other hand, the proportion of large caps and mid-cap steadily decreases as one moves into higher accounting deciles (D7 to D10) in the Zone of Thuggery (note that small caps and large caps constitute 50% and 20% of the BSE 500 respectively). This is not surprising as larger companies generally have more proven business models, longer operating histories as well as higher institutional ownership and greater analyst following, and hence are subject to greater investor scrutiny than small caps.
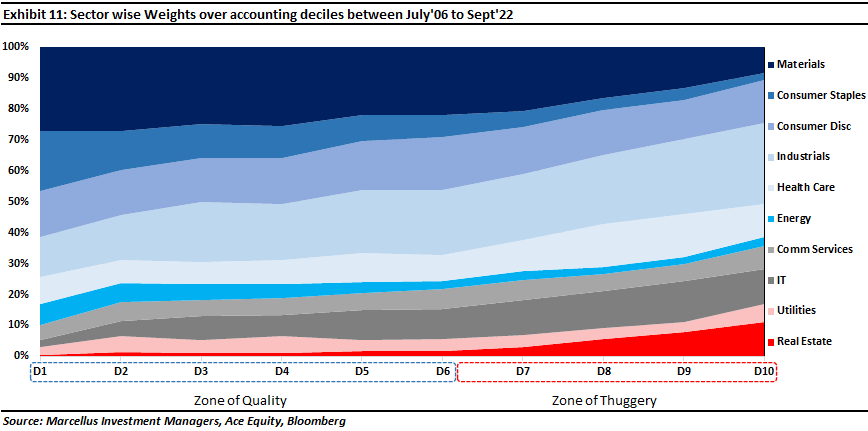
Since the accounting deciles are based on scores calculated on accounting ratios separately across non-financials and financials, it is possible that certain sectors are classified into zone of thuggery just due to the nature of their business models. For example, more capex intensive sectors like industrials can have high capital work-in-progress /gross block for years, and as a result end up in the last 4 deciles i.e., from D7 to D10 (see exhibit 11).
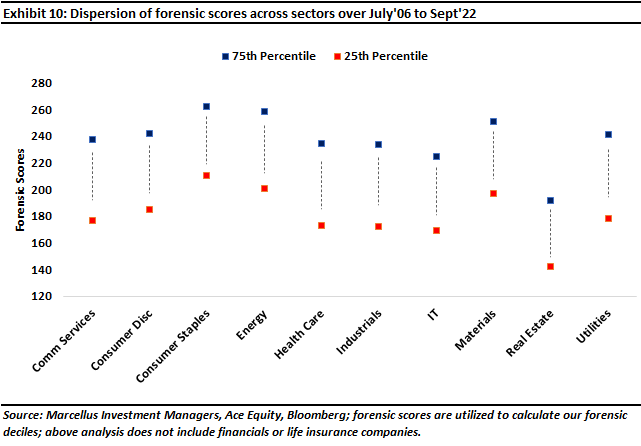
However, as shown in exhibit 10, the dispersion of forensic accounting scores within sectors is meaningful but quite similar across sectors. The forensic framework is therefore able to distinguish both accounting quality within sectors while penalizing sectors with higher chance of poor accounting quality like real estate and industrials.
|
If you would like to know more about MeritorQ, please write to sales@marcellus.in
If you would like to watch our previous webinar on forensic accounting, click here.

