CCP portfolio companies’ valuations have become 30-35% cheaper over the last 12 months. Given that Free Cashflows of these companies have compounded at 5-7% higher run-rate compared to their earnings consistently over the last 5-10 years, their current valuations (on a Price to Free Cashflow basis) are significantly cheaper than where they were 3 or 5 years ago. Historically, ‘holiday periods’ with healthy compounding of underlying fundamentals have been followed by 40%-80% rally in share prices of these companies as the dislocation between fundamentals and valuations reverses. Over the last 2 years, revenue growth and profit growth of CCP companies on average has been higher than 20% p.a. with their capital allocation decisions radically transforming and upgrading the strengths of these businesses.
Performance update – as on 28th February 2023
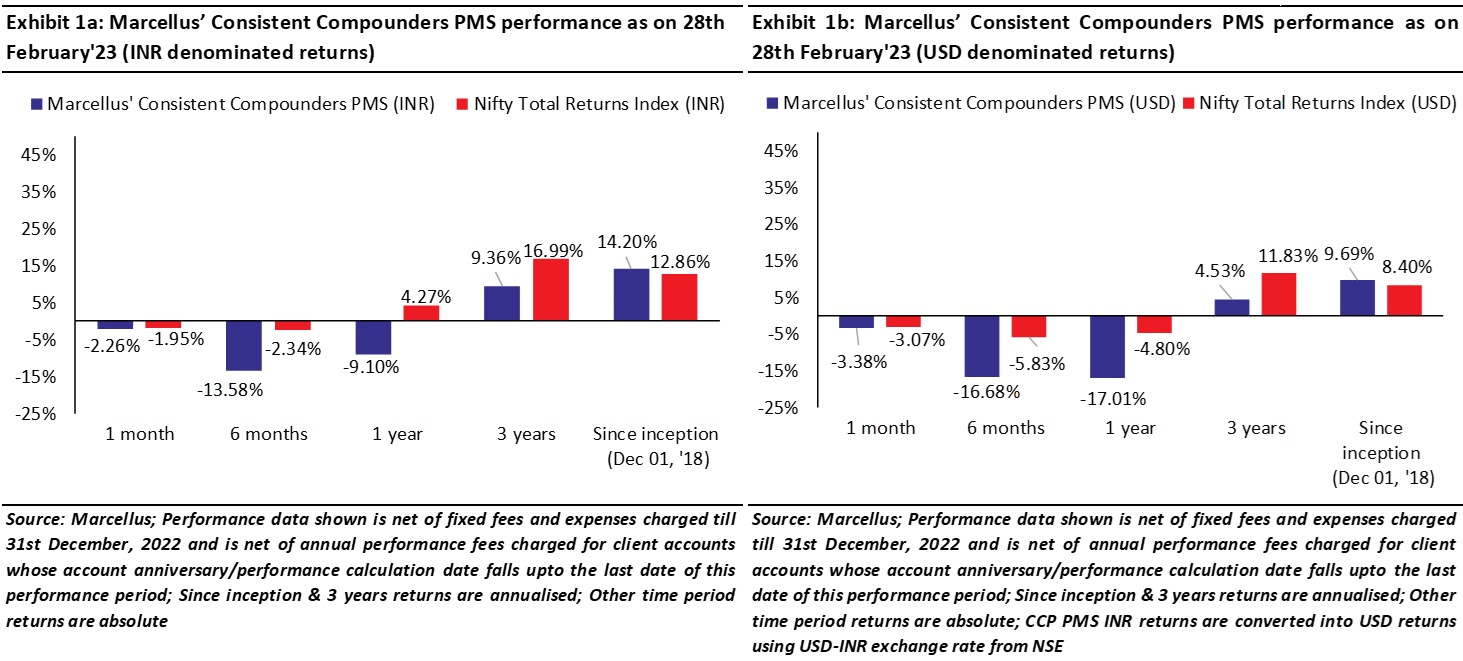
We have a coverage universe of around 25 stocks, which have historically delivered a high degree of consistency in ROCE and revenue growth rates. Our research team focuses on understanding the reasons why these companies have delivered healthy and consistent historical track record and which of these companies are likely to sustain their superior financial performance in future. Based on this understanding, we construct a concentrated portfolio of 13-15 companies with an intended average holding period of stocks of 8-10 years or longer. The latest performance of our PMS portfolio and the underlying fundamentals of the constituent stocks is shown in the charts above.
Sharp recovery from ‘holiday periods’ (dislocation between fundamentals and share prices) for CCPs
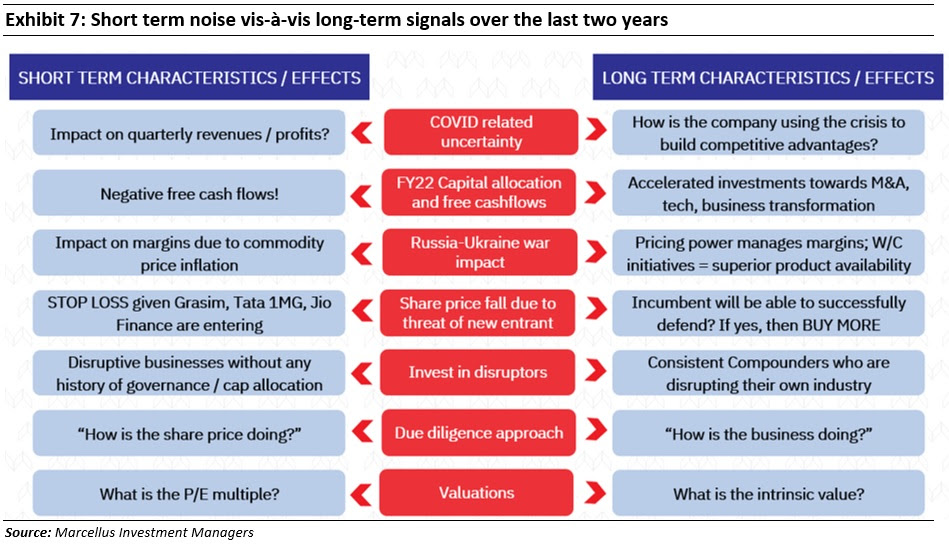
Ben Graham famously said ‘in the short term market is a voting machine & in long term it’s a weighing machine’.
In our May’22 newsletter, we had discussed how share prices of CCP companies often go on a ‘holiday’ for 12-24 months, delivering weak or no returns. These ‘holiday’ periods of share price are typically uncorrelated with fundamentals.
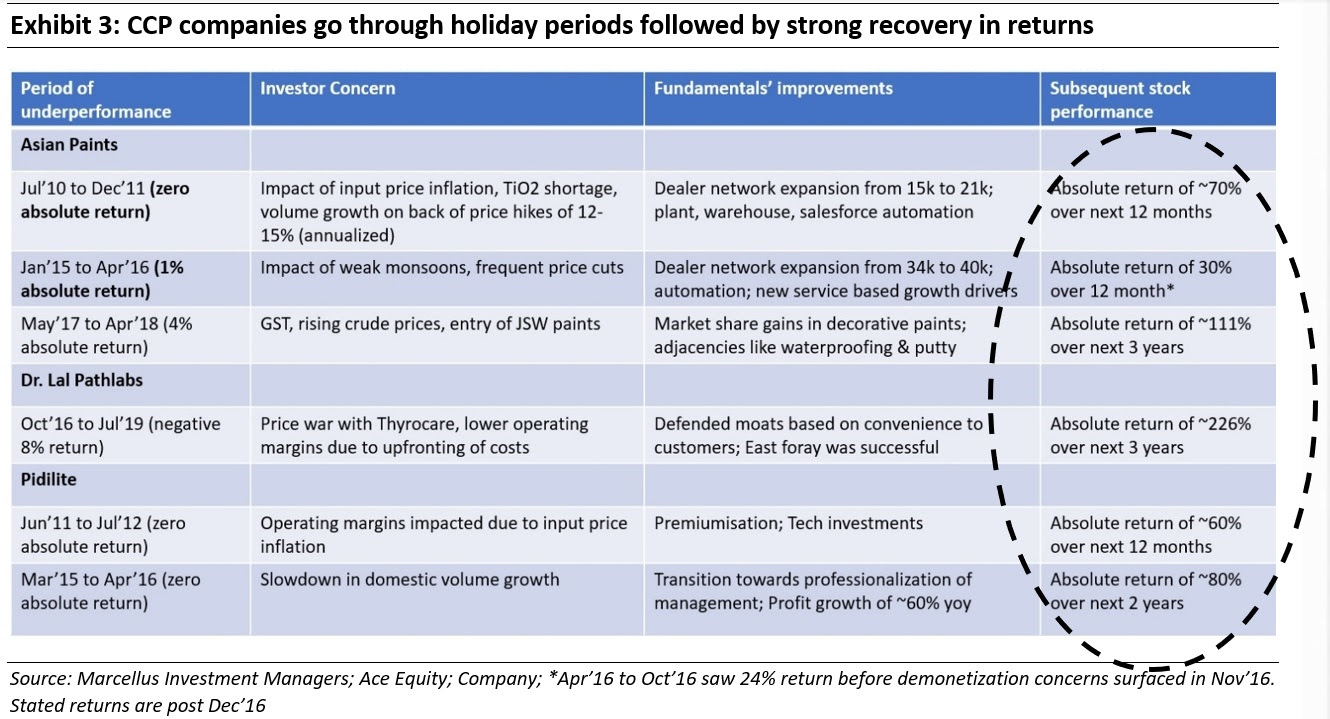
As long as these companies implement during such periods, initiatives to enhance the sustainability of their competitive advantages, the recovery in share prices is sharp and quick after the ‘holiday period’ ends. For instance:
- During the global financial crisis (Jan 2008 to March 2009), share prices of companies such as Asian Paints, HDFC Bank, Infosys – which featured in the filter-based CCP portfolios highlighted in our books ‘Coffee Can Investing’ (2018) and ‘Diamonds In The Dust’ (2021) – fell between 30% and 60%. Full recovery from their March 2009 lows for these share prices back to their pre-crash levels was completed within 3-7 months vs the 20 months taken by the broader market. More importantly, after the full recovery, these companies’ share prices continued to rise by another 60%-80% return over the next 12 months (Sept 2009 to Sept 2010)
- As highlighted in the table below, there have been several instances of 40% to 80% annualized returns from share prices of high-quality companies as they catch-up with fundamental progression of the underlying businesses after their ‘holiday period’ ends.
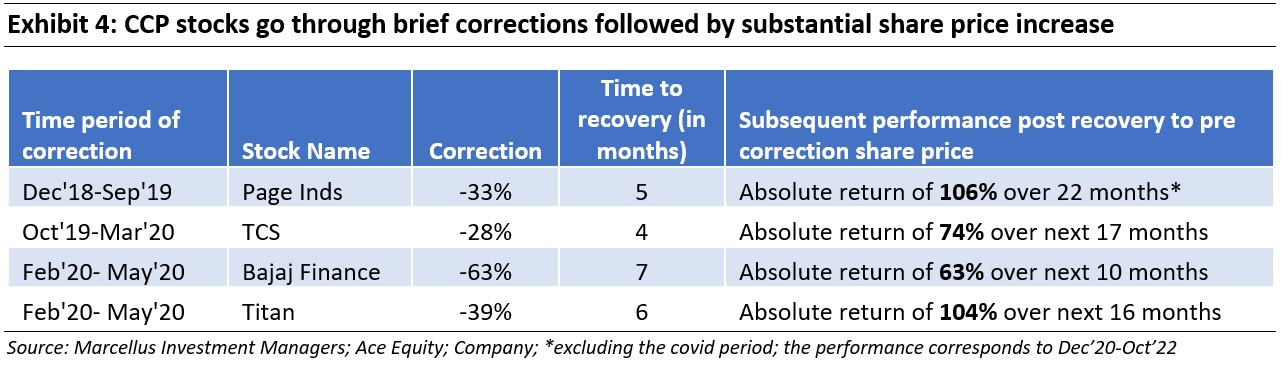
- Since the inception of Marcellus’ CCP in Dec’18, we’ve seen similar temporary periods of weakness in our holding companies’ share prices at different points in time. As shown in the charts below, such weakness was resolved within a few months and was followed by sharp returns as share prices realigned with underlying business fundamentals.
CCP’s consistent compounding of healthy fundamentals over the last 3 years provides strong foundation for recovery
Over the last year or so, for a variety of non-fundamental reasons, many of our portfolio stocks have displayed weak share price performance. However, as managers of your hard-earned monies our job is not to get swayed by short term excitement (or disappointments) and instead remain focussed on the underlying business performance of our portfolio companies as well as their future prospects.
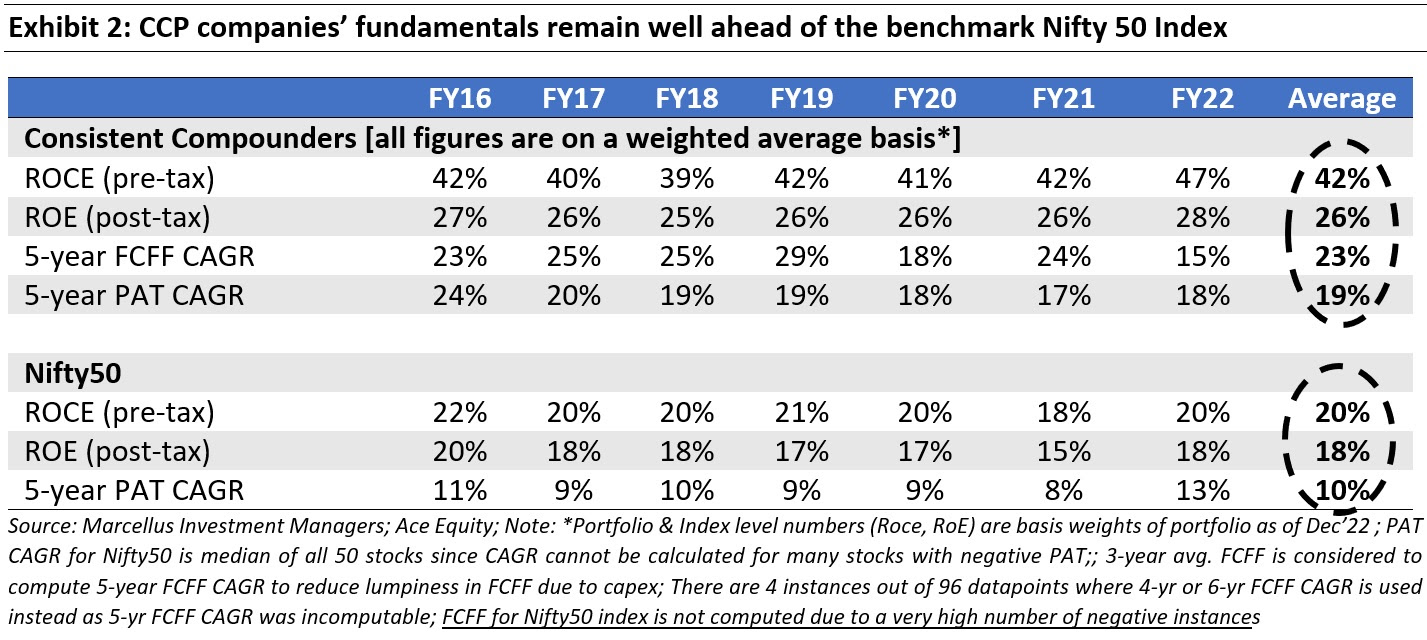
As can be seen in the table below, at a portfolio level our holding companies continue to compound revenue growth and earnings growth at more than 20% annually.
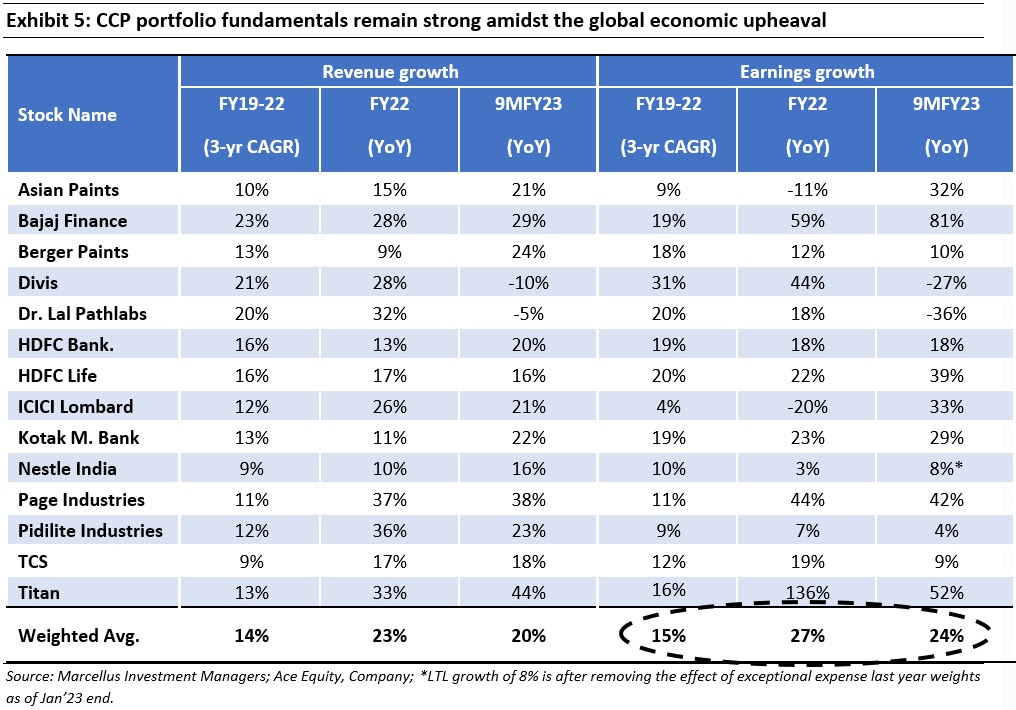
Some of our portfolio companies – such as Dr. Lal Pathlabs and Divis Labs – have seen a normalization of revenues (after the Covid-induced revenue boost faded) as well as their profits in the recent quarters. We use such an overreaction by markets to increase allocation of your portfolio to these companies as we remain confident of their compounding potential.
Dr. Lal Pathlabs
Macro opportunity :
Diagnostics in India today offers a huge market opportunity at ~Rs. 70k-80k crores which is growing in double digits (Source: Company presentation) led by faster growth in elder population, increase in evidence-based treatment, and increase in health awareness.
Competitive positioning :
Today, ~50% market share of diagnostics is with unorganised standalone labs (Source: Company presentation), many of which are not even run by qualified pathologists. Organised competitors like the national and regional diagnostic chains offer a superior solution to patients in the form of collection centre network or home collection services supplemented by a wide range of tests, digital interface to access diagnostic services and reports.
Dr Lal Pathlabs is not only the fastest growing firm amongst the larger organised players in diagnostics (3-4% faster growth each year over the last 3-years), but it’s also a much stronger business now (versus 3 years ago) due to various initiatives like investments in the D2C channel, Control Tower, Automation of QC checks and entry in Mumbai with acquisition of Suburban diagnostics. Further, as Covid-19 related tests have ebbed away, the temporary windfall gain which accrued to new entrants/ smaller labs has waned resulting in weakening of competition from such players. See more details on how Dr. Lal has reinvented the industry dynamics in our Nov’22 newsletter.
In conclusion, with both macro opportunity and industry positioning working favourably for Dr. Lal, we see the price correction in 2022 as an opportunity rather than a setback.
Divis Laboratories
Macro opportunity:
The global market size for small molecules APIs is around $200bn. This market is growing at around 5%-6% globally in $ value terms (Source: API industry reports). Local sourcing in the $20bn domestic API market (Source: Coherent Market Insights) along with higher share in export markets provide ample market opportunities for Indian manufacturers.
Competitive positioning :
The key success factors in API manufacturing industry are – a) quality assurance, b) regulatory compliance, c) reliability of supplies and d) competitive pricing. Amongst the Indian pharmaceutical companies, Divi’s has one of the best track-records in terms of regulatory compliance (in terms of US FDA audits).
Additionally, the scale of operations for Divi’s makes it the most competitive manufacturer amongst peers. Divi’s also benefits from a long history of trust (~3 decades) of its clients who are global pharmaceutical innovators on the back of reliable supplies of quality products along with regulatory compliances. This allows Divi’s to remain preferred partner for big pharma companies whenever the need for outsourcing manufacturing of small molecule APIs arises. Further, our primary checks indicate that the company has only strengthened its position with its clients through the Covid-19 pandemic by honouring all supply commitments and seamless execution of Covid related API manufacturing in a short period of time. Lastly, in addition to its own strengths and relationships with clients, Divi’s is also expected to benefit from the supply chain diversification initiatives being undertaken by the American and European pharma companies over the next decade. More details on why Divi’s is a champion franchise can be found in our Jan’23 newsletter.
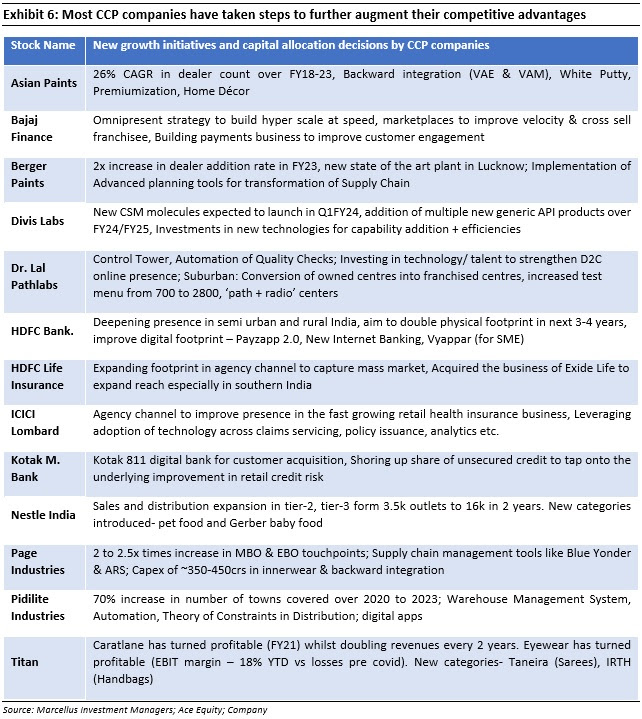
Much like the cases discussed above, our portfolio companies continue to do what they do best – keep reinvesting in ROCE accretive opportunities using abundant free cash flow at their disposal. In the table below, we provide a snapshot of the key new initiatives and capital allocation decisions taken by our portfolio companies in last couple of years.
Investment Implications – Valuation multiples are 30-35% lower levels than where they were a year ago!
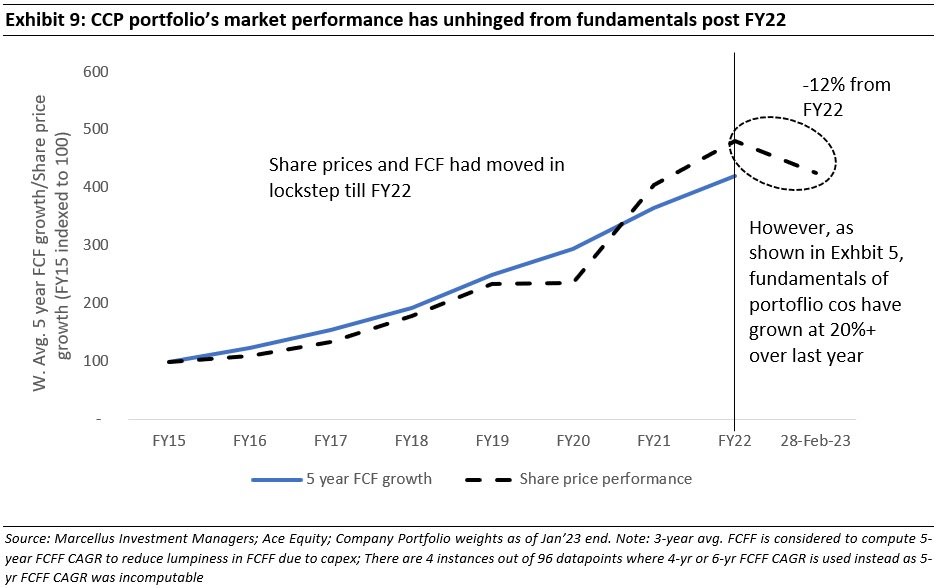
Our Feb’23 newsletter highlighted that focusing on short term investment performance is almost a guaranteed recipe for permanent unhappiness even if over the long term the aforementioned investment generates smart returns. The reason this is so is because while in the short term there can be many reasons why share prices tend to come unhinged from the underlying business fundamentals but over the long term share prices compound at the rate of underlying Free Cash Flows (see our Jul’21 newsletter on this topic).
Secondly, as we’d discussed in our Nov’21 and Oct’22 newsletters, Free Cashflow compounds at around 6-7% higher rate than earnings (PAT) for the most capital efficient companies (as measured by their RoCE). This in turn leads to the P/E multiple of such companies increasing year after year (as the share price in the numerator tracks the Free Cashflow compounding which is growing at higher rate than the earnings in the denominator).
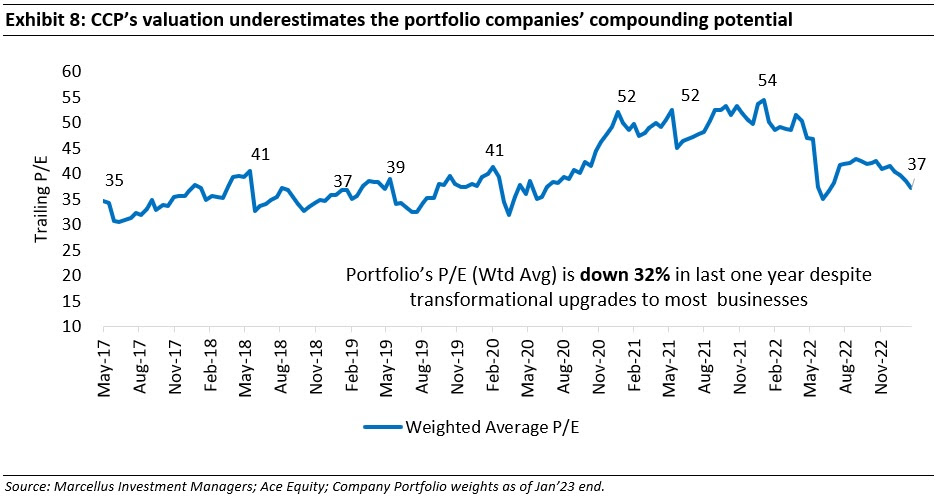
Over the last 12 months, the weighted average portfolio P/E multiple has corrected by more than 30%, despite transformational upgrades across most investee companies (as discussed in previous section) – binging it close to levels seen at the inception of the CCP (Dec’18).
Given the accelerated compounding of Free Cashflows vs earnings compounding discussed above, valuations in the portfolio (on a Price to Free Cashflow basis) have become even cheaper than where they were four years ago. With both valuations as well as company fundamentals (+ steps taken to increase longevity of Free Cashflows) working in investors’ favour, we are excited about the prospects of wealth compounding through the CCP portfolio in future.