MeritorQ’s strategy of picking high-quality undervalued companies delivers better risk adjusted returns by taking advantage of mispricing associated with erroneous investor expectation. Such a strategy also delivers positive excess returns (i.e., returns in excess of the benchmark, in this case the BSE 500) around earnings dates further reaffirming the mispricing hypothesis. In fact, a significant portion of returns from investing in undervalued companies arises from companies with better fundamentals.
Recall that in MeritorQ, we select 30-45 undervalued yet profitable companies which have met our criteria of clean accounts, low leverage, and consistent profitability (our November 2022 newsletter explains the MeritorQ construct). In MeritorQ, value is measured by comparing the free cash flow generation ability of company versus the market price of the company (i.e., free cash flow yield). In our May-2023 newsletter “MeritorQ: The Value of Free Cash Flows”, we demonstrated why the free cash flow-based valuation measure is superior to other commonly used relative valuation measures like price to earnings, EV to EBITDA, and price to book.
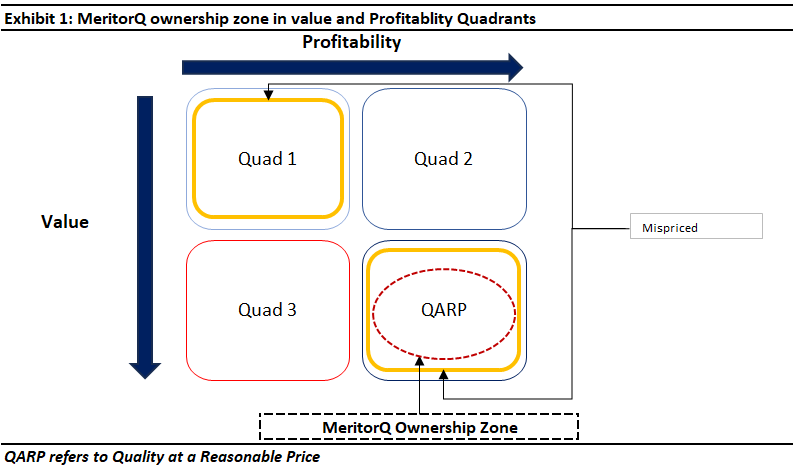
The final selection step is achieved by ranking companies independently across a value metric (price to free cashflow) and profitability (which we can represent with Return on Capital Employed or ROCE). Those which are profitable and relatively undervalued are selected. This is shown pictorially in Exhibit 1 below. Further in MeritorQ, the screening steps ensure that we are checking quality across multiple dimensions instead of looking at just profitability.
Profitable and undervalued companies: Where fundamentals and valuation meet
A key question is whether the high average expected returns associated with undervalued stocks (or low average expected returns earned by expensive stocks) are an outcome of mispricing due to transient factors like some short-term negative news, a temporary business slowdown, an industry being out of favor, etc. If indeed this is the case, then we should see meaningful returns (whether negative or positive) for companies where the share price is more disconnected from its fundamentals, that is, which are mispriced and consequently the probability of convergence to fundamentals is the highest. These would be companies which are unprofitable and expensive (top left quadrant) and those which are profitable and cheap (bottom right quadrant).
To check this, we divide the BSE 500 companies into each of the four quadrants basis profitability and relative value each year in September as shown in exhibit 1. Returns for the quadrant portfolios formed are thus calculated over the subsequent 1-year holding period. Results from September-2006 to August-2023 are shown in exhibit 2. Note that this analysis utilizes point-in-time data for BSE 500 constituents as well profitability and value metrics and includes firms which have subsequently been merged, delisted etc.
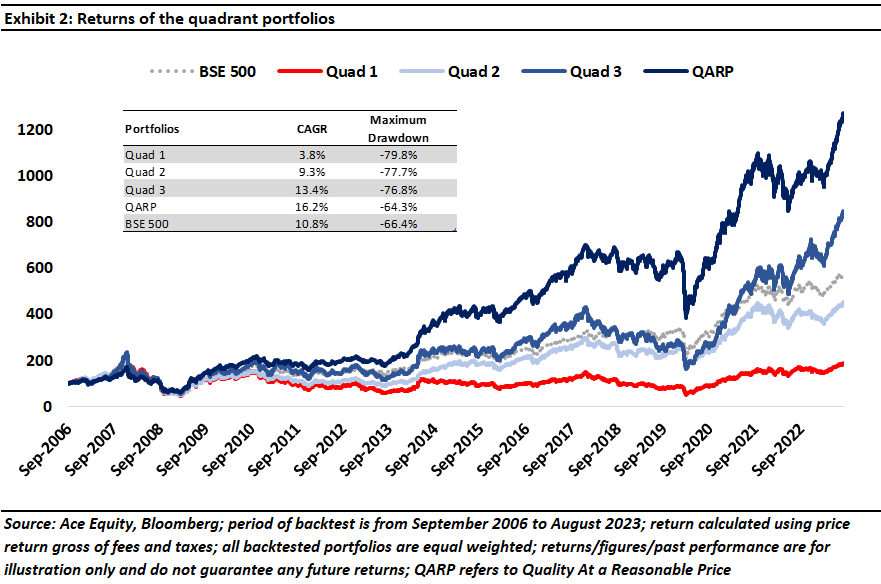
As would be expected, the two most mispriced portfolios, the ‘unprofitable and expensive’ and ‘quality at a reasonable price’, have the lowest and highest returns respectively as valuation converges to fundamentals. This reduces the mispricing gap. Note that the quality at a reasonable price quadrant not only has the highest returns but also exhibits the lowest risk and drawdowns versus others.
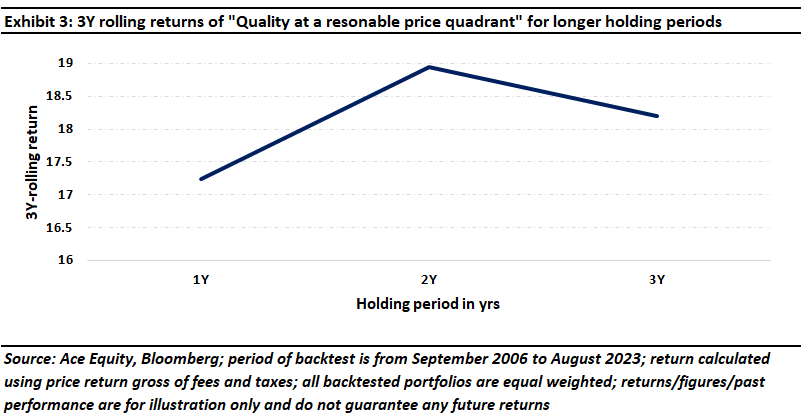
In exhibit 2, we only hold the quadrant portfolios for 1-year before rebalancing. However, over the course of a year cheap stocks can always get cheaper, and expensive stocks can always get more expensive before reversion to fundamentals occur.
Exhibit 3 shows the rolling returns of quality at a reasonable price portfolio if they are held for 2 and 3 years respectively. Whilst most of the gains from reversion are likely to be realized in the first year itself, we can observe that returns for 2 and 3-year holding periods are slightly higher and also sustained. This affirms why we believe MeritorQ’s objective of buying quality yet undervalued companies can earn attractive risk adjusted returns for relatively long-term investors.
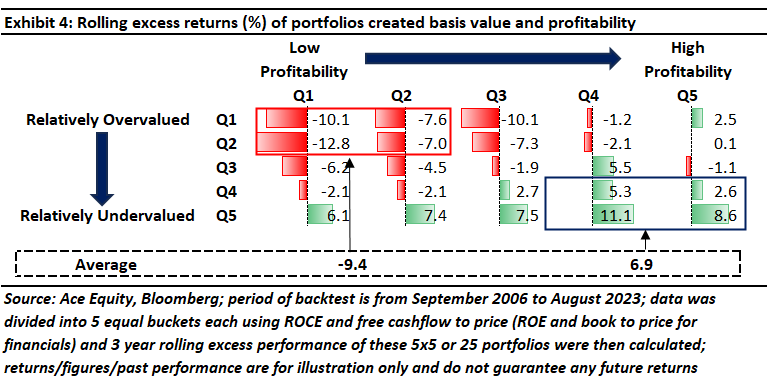
Given that each quadrant portfolio has roughly 125 stocks, it could turn out to be too large for a practical and actively managed strategy. Exhibit 4 shows results if we were to breakdown the quadrant portfolios into more granular subsets. We achieve this by dividing the BSE 500 universe into 5 equal buckets sorted independently on value and profitability – so that for each we get 25 equal buckets of BSE 500 companies (5 buckets basis valuation and 5 buckets basis profitability – see Exhibit 4), with each bucket containing around 20 companies.
Returns for these quintile portfolios are calculated in the same manner as for the quadrants, except that we present the results in terms of average rolling excess returns over the benchmark (BSE 500). We can observe more clearly in Exhibit 3 that higher profitability and undervaluation are correlated with future excess returns (shown under the highlighted bottom left box). The mispriced portfolios highlighted under the two boxes have average excess returns of -9.4% and ~7% respectively, confirming the results from the quadrant analysis.
Returns around earnings dates are generally positive for undervalued and profitable companies
Since companies update investors on their financial and business performance around earnings announcement dates, the market adjusted returns around these dates provide an indication if investors are correcting their expectations for mispriced companies. Hence, we also check the average excess returns around earnings announcement dates for these quintile portfolios (see exhibit 5 below). This is done to further validate our argument that mispricing and subsequent reversion to fundamentals is one of the key drivers of returns for high profitability and undervalued quintiles.
Exhibit 5 shows the three-day market-adjusted earnings announcement returns calculated four quarters later for a given firm in the year following portfolio formation. Quintile portfolios are formed in September each year following the same procedure described previously.
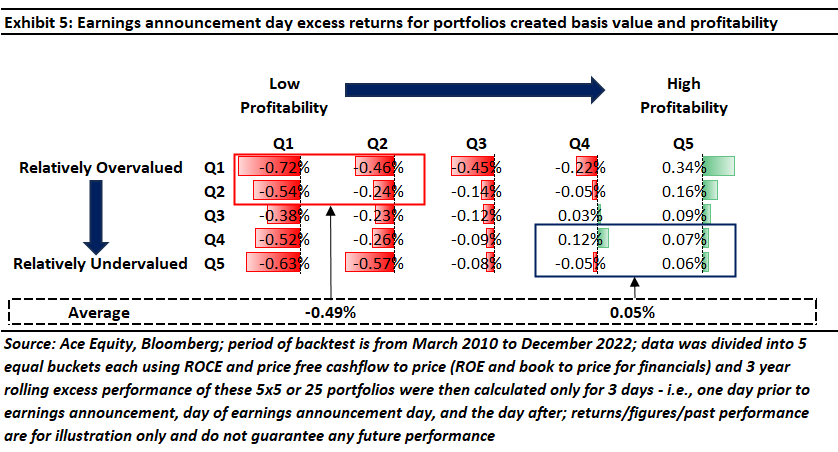
Again, we observe that unprofitable, overvalued firms experience negative earnings announcement excess returns following portfolio formation (average excess returns of -0.5%), consistent with the market revising downward its overly optimistic expectations about these firms when they announce earnings; the opposite is true for those which are undervalued with high profitability (average excess returns of 0.05%). Similarly, in MeritorQ, we see positive excess returns on an average around earnings announcement dates compared to negative returns for BSE 500 companies over the analysis period.
Unsurprisingly companies in both value traps as well as ‘overvalued, unprofitable’ bucket experience negative announcement date returns. In addition, across every value quintile, earnings announcement returns are larger for firms in quintile 5 (Q5) of profitability than for firms in quintile 1 (Q1), suggesting that the market is surprised by subsequent earnings announcements for firms with high profitability. Firms which are relatively overvalued and profitable see the largest positive returns around earnings announcements perhaps because their current high relative valuations perhaps still underestimate longevity and future growth of their free cash flows (both of which are not captured in the matrix above).
In summary, MeritorQ’s strategy of focusing on quality companies at a reasonable price allows long term investors to benefit from mispricing and subsequent reversion to fundamentals through a systematic, long only approach.
To invest in MeritorQ through Smallcase, please visit MeritorQ Advisory – Marcellus
If you would like to know more about MeritorQ, please write to help.ia@marcellus.in
* The securities quoted are for illustration only and are not recommendatory
Regards
Team Marcellus

