Although India’s 20 most profitable listed companies (the ‘Megacaps’) account for around 50% of the profits generated by the BSE 500 companies, these Megacaps account for just 34% of the BSE500’s market cap (down from 41% a decade ago and 45% nearly two decades ago). Indian retail investors’ fascination with small caps seems to be the primary reason for the decline in the market cap weight of the Megacaps. In this context, MeritorQ’s broad, multi-cap investment universe allows flexible allocation across the market cap thus allowing investors to benefit from such valuation disconnects. Specifically, MeritorQ’s allocation to large caps has increased by 18% points over the past 12 months.
As the country joined up, profits got democratized…
As is well understood now, over the past decade, India has seen a dramatic upgrade in its physical and virtual infrastructure. With the national highway network seeing a near doubling from ~79K km in 2012 to ~140K km in 2022, domestic air travel passengers more than doubling from ~58 mn in 2012-13 to ~136 mn in 2022-23, households with broadband connections growing ~7x from ~20 mn in 2013 to ~137 mn in 2023, and the number of bank accounts growing ~3x from ~ 100 crores in 2015 to ~300 crores in 2023, doing business in India has become easier than it was in the past.
Whilst the post-Covid recovery – with easier availability of credit and dramatic acceleration in the use of UPI and social media – has helped smaller companies find new customers and new ways to reach existing customers (see Marcellus’ 7th February 2023 blog, The Polarization of Corporate Profits in India is Reducing), the long-term structural trend seems to be that the networking of India is helping large companies spread their wings at a national level and make more money than ever before.
…the Megacaps’ market share got compressed
Even as the profit share of India’s Megacaps has remained steady at around 50% over the past decade, their market cap share has fallen relentlessly – from 41% of the BSE500’s mkt cap in 2013 to around 34% now. As we move down the size spectrum from top20 to Nifty 50 or to BSE 100 index we can see the relative compression of market cap versus profits is either lower or entirely absent. This is shown in the last three rows of exhibit 1. Interestingly, this anomalous situation does not exist in the only other large stock market in the world which has thrived over the past decade, the United States. In fact, if we were to look at the concentration of profits for the top 20 companies in the US vis-à-vis the S&P 500, it has risen over the last 10 years, but so has their market capitalization concentration. The first two rows of the table below highlights how the Indian and American stock markets have moved in opposite directions when it comes to profit concentration vs market cap concentration.
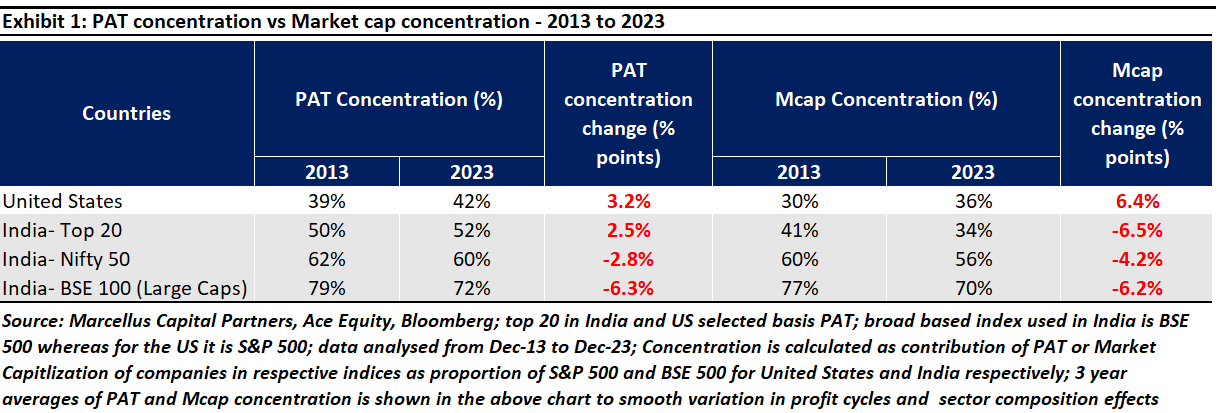
So, why is profit concentration in India moving in the opposite direction to market cap concentration when the same is NOT happening in the United States?
A possible explanation is that the 6% point rise in market capitalization concentration in USA is largely a result of the rise of passive investing in the country. To be precise, passive funds’ share in the ownership of an average listed American company has more than trebled from 6% in 2013 to 19% in 2023. In fact, according to the Investment Company’s Factbook , fee-based advisers had 41% of their clients’ money invested in ETFs in 2021, up from 10% in 2011). Because passive indices employ market capitalization weighting, as US investors allocate more towards passive products, companies with larger market cap receive still larger inflow or demand for their shares, causing their share prices to go up further leading to a positive feedback loop. In fact US equity Researchers from UCLA and the University of Minnesota argue in their prescient paper on the subject that owing to massive rise in passive investing, equity inflows have become ‘inelastic’ or blind to valuations. What this essentially means is that the American stock market has created a dynamic where large companies keep attracting investors by dint of their market cap through passive investing.
In contrast, in India, whilst the profit concentration of the top 20 has remained steady at around 50% in the last decade, their market capitalization concentration has reduced by nearly 6.5% points.
Rise of the Indian retail investor (and of small caps)
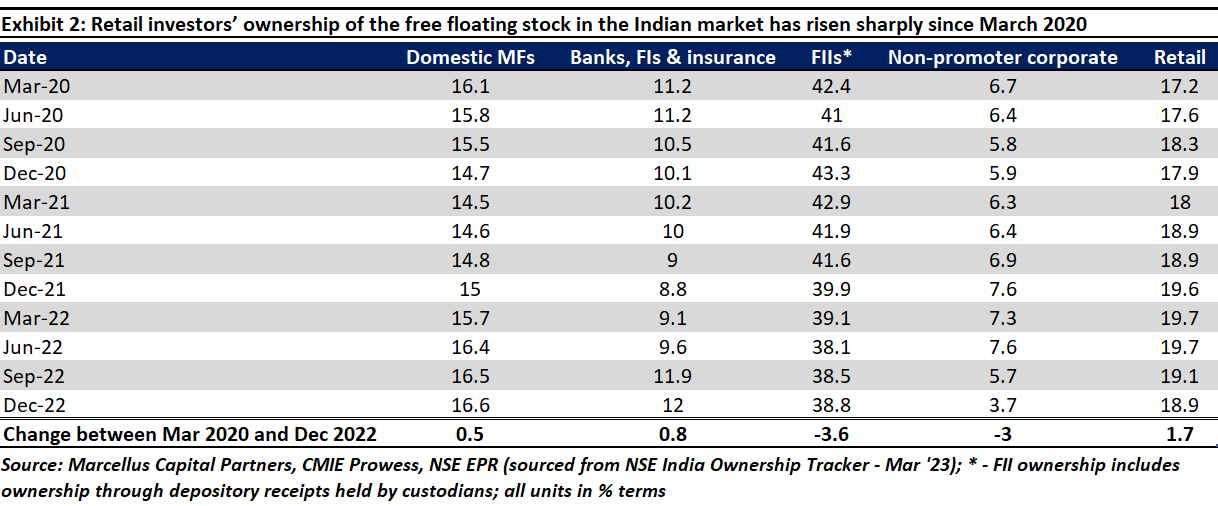
A key reason for the divergence between profit vs mkt cap concentration in India is the meteoric rise of the Indian retail investor. As the table below shows, in the aftermath of Covid, retail investors have flooded into the Indian stock market. In fact, the number of demat accounts has increased from ~40 mn in 2020 to ~ 140 mn now, growing by 3.5x in the span of just 3 years!
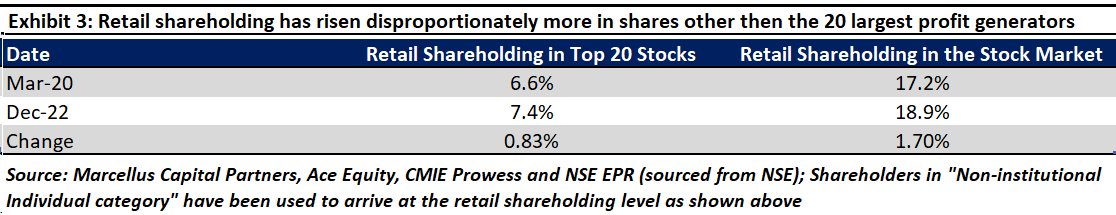
As the last column of exhibit 3 shows, the shareholding of retail investors has risen (as a % of the free float in India) by 170 bps post-Covid. What is remarkable is that the rise in retail shareholders’ holdings in top 20 companies (or Mega caps) has only been up ~83 bps over this period (from March 2020 to December 2022; see exhibit below). This implies that retail investors’ investments in shares other than the Megacaps has been disproportionately higher.
Why does any of this matter?
As we have argued in our December-2022 newsletter, Strength lies in numbers, the large investment universe of 500 companies in MeritorQ (equivalent to BSE 500 or Nifty 500) is well suited for quant approach and gives us more opportunities to select profitable, undervalued companies and position size them accordingly.
The multi-cap investment universe in MeritorQ also allows us to allocate flexibly across large, mid, and small cap stocks based on their fundamentals and valuations. This means when there are relatively more profitable, undervalued companies in small and mid-cap space, there is a higher chance that such companies get selected (because we select relatively undervalued companies at each rebalance), which also get a higher allocation in final portfolio (because more undervalued companies get higher portfolio allocation).
Small cap returns in India also tend to be cyclical with a sharp run up every 2-3 years. Previous peaks reached in 2008, 2011, 2014, 2017, and 2021 were inevitably followed by drawdowns of various durations and intensities. This is visible in Exhibit 5 where the sell-off in small caps through 2018 and 2019 and early 2020 led to a widening of FCF yield spread between small caps and large caps i.e. small caps became cheap relative to large caps. This in turn led to increasing allocation to small caps in MeritorQ model portfolio throughout this period. This contrarian and dynamic reallocation across the market cap spectrum during quarterly rebalancing allows MeritorQ to profitably exploit cyclicality within the small cap segment. The systematic and data driven approach in MeritorQ also ensures that such reallocation opportunities can be taken advantage of in a timely manner and in a consistent way.
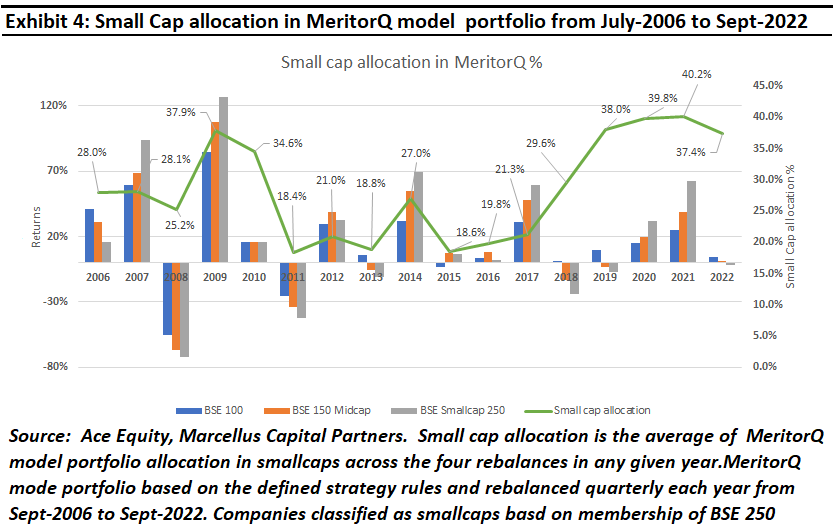
While Exhibit 4 shows the small cap allocations for the model portfolio between July- 2006 to September-2022, we note that small cap allocation since the inception of the strategy on Oct-2022 has fallen by around 21% points and, allocations to large cap stocks have consistently increased over the last 3 rebalancings (in April-2023, Oct-2023 and Jan-2024) from 15% to 33%. This is against the backdrop of the disproportionately large interest that Indian retail investors have taken in stocks beyond the Megacaps, which has made the 20 largest profit generators cheaper: (a) relative to their recent history; and (b) relative to the rest of the Indian stock market, as we have already explained before.
To invest in MeritorQ through Smallcase, please go to https://marcellus.smallcase.
If you would like to know more about MeritorQ, please write to help.ia@marcellus.in.
* The securities quoted are for illustration only and are not recommendatory
Regards,
Team Marcellus
If you want to read our other published material, please visit https://marcellus.in/meritorq-
Source: Ace Equity, Bloomberg; Return/figures/Past Performances are for illustration only and do not guarantee any future returns.

