The industry in which B2B firms operate can have an outsized impact on their compounding potential. Over FY14-23, some sectors like IT, Light Industrials and Chemicals have generated twice as much RoCE and share price returns as compared to sectors like Energy and Metals & Mining (which struggle to return even cost of capital). This is due to industry specific factors like cyclicality, lack of product differentiation and weak bargaining power of producers vs customers. Hence, the probability of finding long term winners is much higher (>80%) in the former sectors than latter (<50%). Our quant screeners help us weed out firms that operate in industries with sub-par ROCEs while our qualitative frameworks help us select firms commanding a dominance position in the value chain. Most B2B firms in our Little Champs and Rising Giants portfolios exemplify these two key characteristics.
The importance of industry analysis in B2B investing
Huge dispersion in sector-wise RoCE and share price performance
In our past newsletters we have discussed the importance of free cash flow generation and capital efficiency in order for a firm to become a decadal wealth compounder (see our May’23 newsletter for more on this idea). In this month’s newsletter we argue that the ability of any firm to become a long term compounder is dependent on not just the firm’s own competitive advantages and capital allocation skills but is also influenced by the industry it is operating in.
For instance, consider the wide divergence in the long term (FY14-23) in the capital efficiency (RoCE) of B2B firms operating across various sectors (using BSE 500 index non-financial constituents)
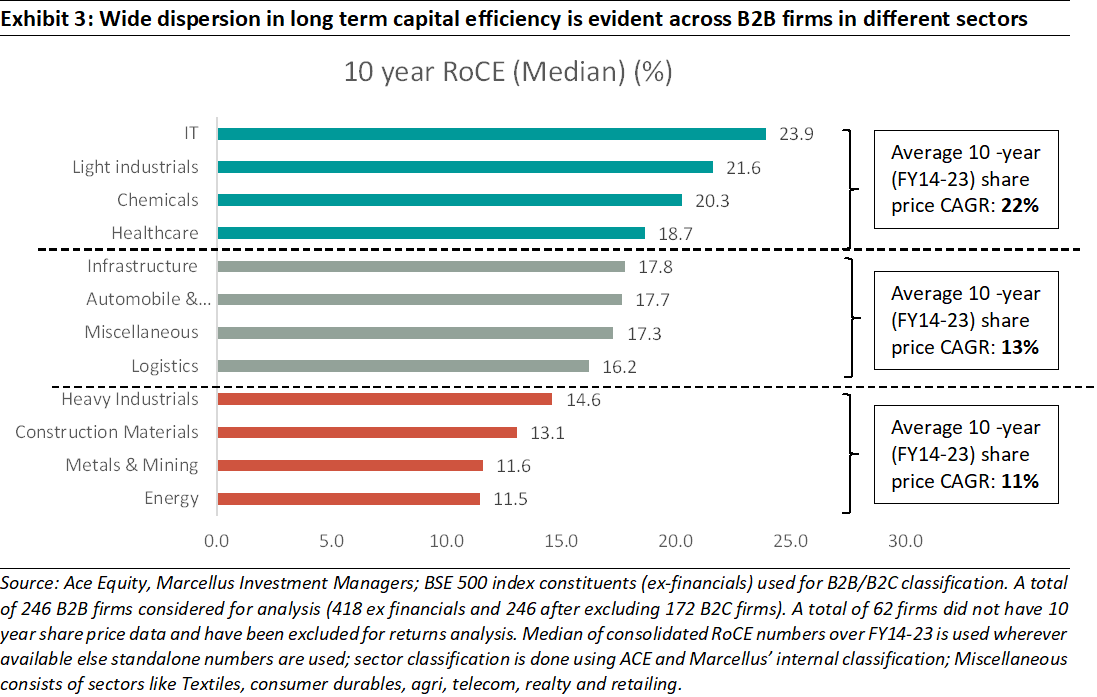
As can be seen in the above exhibit, the top four sectors outperform the bottom four by nearly 2x both on RoCE as well as on share price returns. For some industries – like Metals and Mining & Energy – the median long term RoCE as well as share price returns for firms operating in these sectors falls is in the range of 11-12% i.e. below the cost of capital. On the other side of the spectrum, firms in sectors like IT, light industrials, chemicals & healthcare have generated almost 2x the RoCE and share price returns generated by firms discussed above.
Analyzing the reasons behind this divergence
Let’s understand the reasons behind this divergence in long term RoCE using heavy and light industrial companies as examples below:
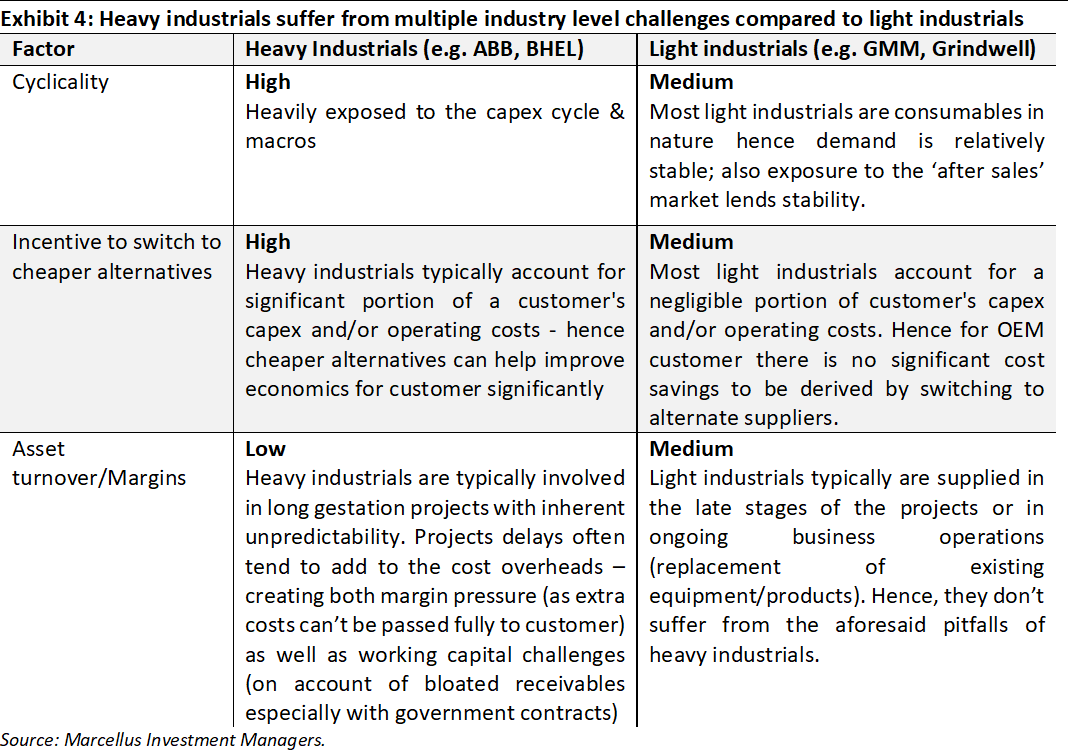
Somewhat similar to the above reasons, industries like Metals and Mining & Energy by their very nature are cyclical in nature with most products/services being offered having nonexistent pricing power. This in turn affects the numerator of RoCE. E.g. the price of iron ore/steel/oil moves according to the broader macro supply/demand scenario whereas the manufacturer of a differentiated light industrial offering is able to command a price premium.
Combined with their high asset base, most firms operating in this sector resultantly have low RoCE (sectors with high asset base have higher ‘Capital Employed’ or the CE in the denominator to calculate RoCE). Given the ‘commodity’ (i.e. lacking pricing power) nature of their products/services, similarly low RoCE is evident for sectors like construction materials and Heavy industrials.
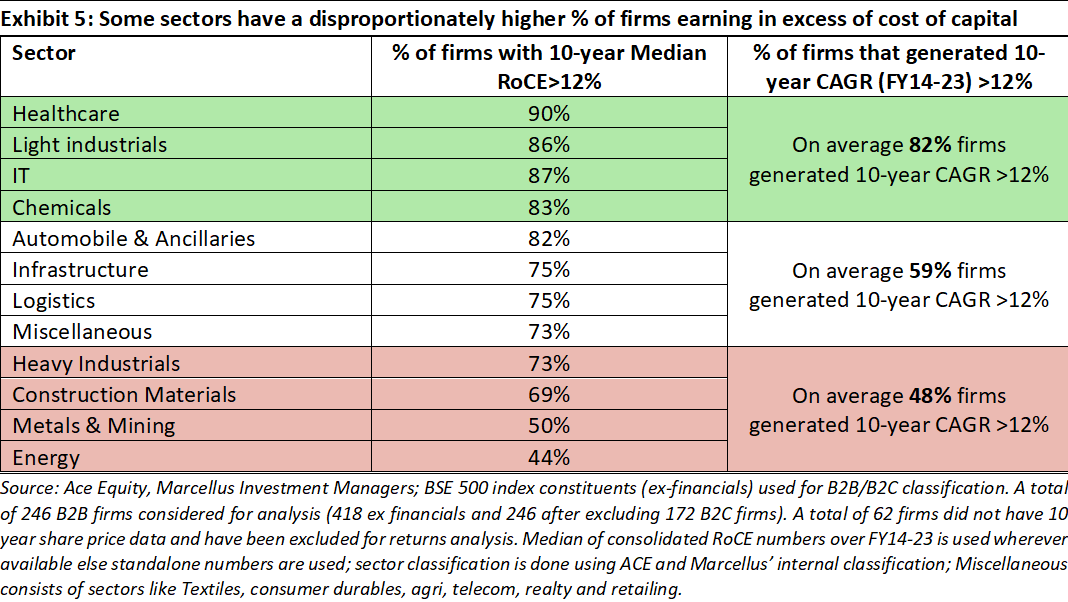
Probability of finding winners is significantly higher in some sectors than others
The analysis above is useful to understand that the industry forces can have sizeable impact on the RoCE even if a company has been able to sustain or grow its market share. Investing at the end of the day is a game of probabilities and the probability of finding a winner (i.e. a long term wealth compounder) is much higher for some sectors vs. the others.
For example, consider the table below which shows that the probability of finding a firm that enhances shareholder value (i.e. earning RoCE and returns more than cost of capital of 12%) is more than 80% for sectors like Healthcare, Light Industrials and IT vs. less than 50% for sectors like Energy or Metals and Mining.
Marcellus’ research process to identify and invest in the right neighborhood:
Our research process helps us avoid investing in the sectors where there are structural impediments around generating healthy RoCEs:
- Quantitative filters: Our in-house forensic accounting and capital allocation frameworks and screeners help us weed out most of the firms that feature in the industries earning sub-par ROCEs by default, allowing us to focus on a universe of 40-50 stocks for further deep dive (see our introductory Little Champs Jan’20 newsletter for details)
- Qualitative analysis: While the quantitative process allows us to discard firms with low potential, by itself it’s not enough to be able to identify the winners i.e. B2B firms in an attractive industry and which commands an enviable position in its industry ecosystem. Our research process requires analysts to assess a company’s competitive advantages through not only the lens of its strengths over its peers but the industry attractiveness through.
- Michael Porter’s five forces which ascertain if a company’s position in the value chain is prone to high competitive intensity and pricing pressure, resulting in low foreseeable RoCE (due to a combination of low entry barriers/commodity products/consolidated customer or supplier base)
- Hermann Simon’s Hidden Champions framework where smaller B2B companies have a hammerlock on their much larger customers (see our Nov’19 Little Champs newsletter for more on Hermann Simon’s framework).
Some common traits of champion B2B franchises which create tremendous bargaining power vs customers and also creates strong entry barriers:
- Cost vs criticality for customers: High quality B2B firms’ products are highly critical to customer’s operations as they either lend important functional characteristics to customer’s end products or provide solutions without which a product’s failure can inflict significant financial and reputational damage on the end customers. Simultaneously such products do not form a significant portion of the overall operating costs for their end-customer leading to little motivation for the customer to shift to a competitor’s product even if it is available at a lower cost.
For instance, Garware Technical Fibre’s salmon aquaculture cages constitute less than 10% of the total cost of running a salmon aquaculture farm. The customer (marine farmer) can choose a cheaper alternative but risks heavy losses not only in terms of fish caught but also via loss of his license. As a result, most customers are willing to pay a premium for a product that ensures a win- win scenario for both parties.
- Innovation: Successful B2B firms devote a lot of time, effort and capital towards both product and process innovations. Within process innovation the focus is not just on cost leadership but also towards higher efficiency, delivery timeliness and quality. Further, these firms become intricately linked to the IP of their customers by offering increasingly comprehensive/customized solutions which are hard for others to deliver (and thus become significant barriers to entry).
For example, Fine Organics supplies additives that have very low molecular weight (less than 1%) in the final products manufactured by its clients. The clients are willing to pay a premium not only due to the high quality of products but also endeavor on part of Fine to keep pushing the envelope and improve economics for the clients. For instance, the company introduced oleo-based additives for the packaging industry which replaced additives that were derived from animal fats. Resultantly, packaging manufacturers who use Fine’s additives can now manufacture packing for vegetarian food items – thus increasing their addressable market size.
More details on such desirable attributes of B2B firms can be found in our Sep’22 newsletter.
Assessing changes in industry dynamics also very important:
While certain industries may have been attractive in the past, it is not necessary they will remain so going forward. There are for a number of reasons for this:
- Technology disruption which can create a fresh bout of competitors/substitutes: The most recent example of firms getting disrupted in the B2B space would be electrification of transport/use of renewables for power. Electric vehicles have a fraction of moving parts as compared to internal combustion vehicles – which is hugely disruptive to auto ancillary firms whose earnings were mainly dependent on repairs/selling spare parts. Similarly, firms that are involved in servicing clients that operate in fossil fuel-based power generation would face existential threat from rise of renewable sources of energy like solar plants which’ve become economically viable due to technological advances in energy storage technologies (excess power produced during day can be stored for use at night).
- Consolidation in any part of the value chain can increase the bargaining power vs others: A good example of how industry dynamics changed due to bargaining power shift comes from the media industry. Studios like Universal Pictures, MGM, etc. enjoyed tremendous power vs. the distributors (customers) and artists (supplier) in their heyday. While the latter were fragmented, the studios were large organizations which could dictate terms as per their convenience. The rise of internet streaming in general and Youtube/Netflix in particular led to the decline is such bargaining power as now the likes of Netflix increasingly controlled distribution to the end customer. Further, the artists were no longer dependent on studios to showcase their talent and could use DIY platforms like Youtube and build their own fan base – allowing for much improved bargaining power vs. the studios.
- Regulatory changes: Disruption from regulatory changes is particularly relevant for B2B firms operating in sectors that enjoy regulatory moat that reduces competitive intensity (for e.g. restriction on number of licenses issued/import ban etc.). For example, firms like Borosil Renewables which manufacture solar panel glass enjoyed a monopolistic position in the domestic market on the back of anti-dumping duty imposed on solar glasses imported from China from 2017 to 2022. However, as such duty was lifted the pressure on company’s margins and growth rate followed through (link) given it now had to compete with Chinese low cost producers for a mostly commoditized product.
Assessment of disruption risk through any of the aforementioned reasons sits at the core of our Longevity Framework wherein we not only analyze a company’s competitive positioning here and now but more importantly what steps are being taken to ward off risks arising from changes undergoing in the industry dynamics. For example, we exited our position in Music Broadcast Limited (MBL), a leading radio broadcaster in India once it became clear to us that the music industry is going through a massive disruption on account of streaming services like Spotify and the aforementioned company’s competitive positioning is under huge threat.
Conclusion
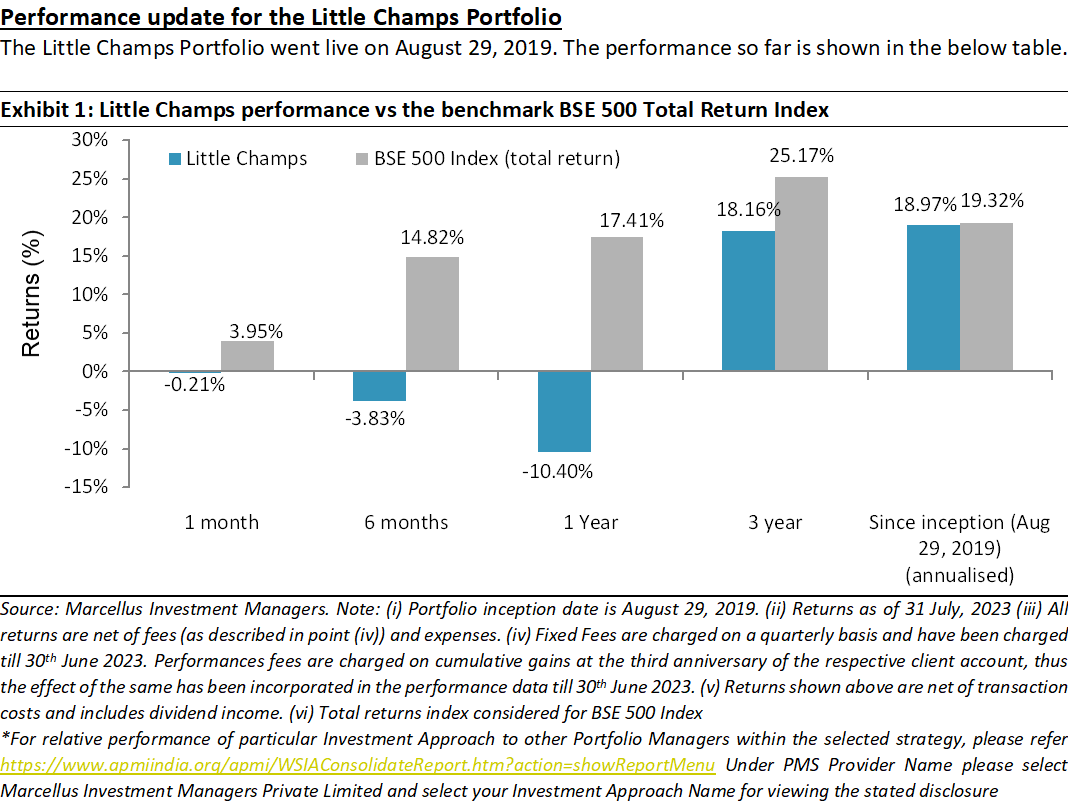
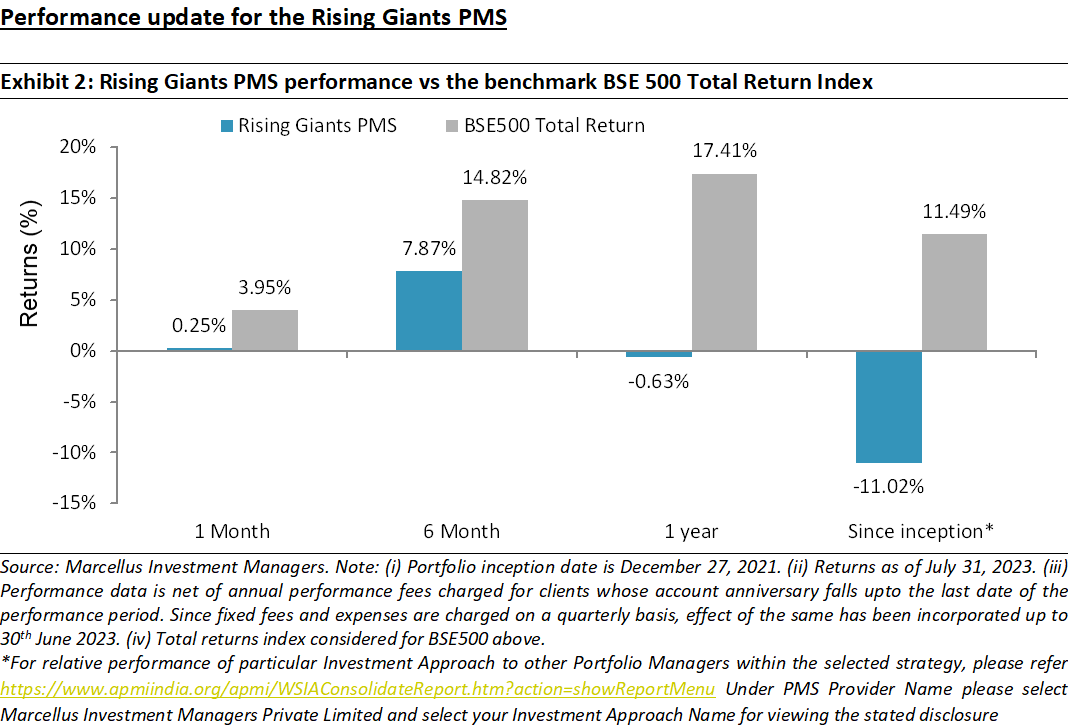
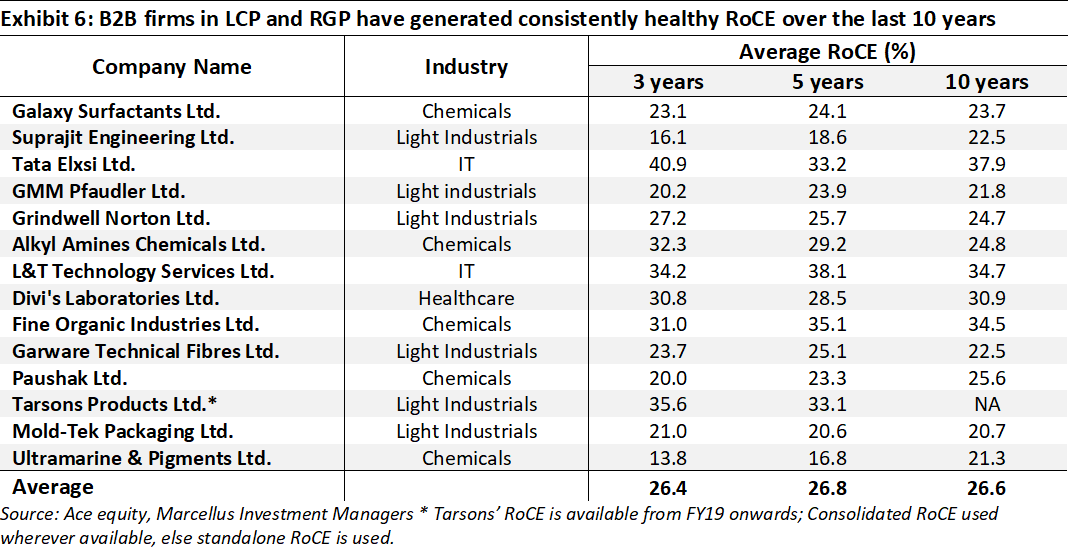
In our Little Champs and Rising Giants portfolios, we have sizeable exposure to B2B companies. The common thread across these firms is the fact that these firms’ products/services offer a value proposition that improves the quality/reduces the cost for their end customer – a key reason why these firms remained entrenched with their customers and have been able to sustain high RoCEs over the last may years (see table below)
Coming to an often asked question around valuation of our portfolio companies, we’d urge our readers to revisit two newsletters – our CCP Jan’20 newsletter and our Rising Giants Apr’23 newsletter, wherein we discussed longevity (i.e. the number of years in future a firm will enjoy competitive advantages and generate free cashflow growth) remains the biggest source of undervaluation in markets.
To that end, we had presented the table shown below which puts P/E multiples in the context of earnings (or FCF) growth and longevity of such growth. While the stock market views P/E multiples in the 15-30x range as being ‘fair value’, such assumption is fair only for companies with modest growth rates (upto 15%) and longevity periods (upto 10 years). On the other hand, champion firms (like the ones discussed in this newsletter) which enjoy extremely strong competitive advantages and are likely to grow their earnings by 20%+ for many years into the future deserve much higher ‘fair value’ multiple.
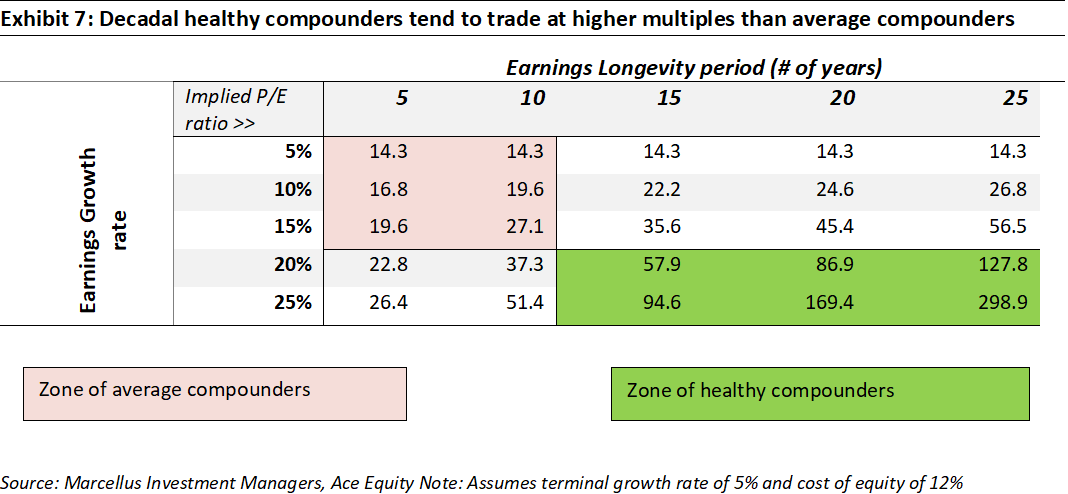
The weighted average PE multiple of Little Champs portfolio is ~30x while that of Rising Giants portfolio is ~38x. These P/E ratios suggest that market implies that the firms in our portfolio would continue their dominance (i.e. longevity) for less than 10 years in the future – something we feel highly underappreciates the level of moats and capital allocation skills these firms enjoy.
Let’s consider the case of GMM Pfaudler – one of the top allocations in our LCP and RG portfolios. The Company enjoys strong moat in its core Glass-Line Equipment (GLE) business through access to best-in-class technology from Pfaudler, long-standing relationships with customers, smart capital allocation skills and massive scale benefits – the nearest competitor is 2/3rd its size (basis standalone numbers). Furthermore, the Company has strengthened its business in the recent years through: (i) Continuous reinvestments in enhancing the GLE capacities. It also acquired De Dietrich Process Systems’ (DDPS) Indian unit. (ii) Bought its parent Pfaudler’s International business thus gaining access to global markets, creating opportunities to bring Pfaudler’s global products to India and increasing sourcing from India for the global business; and (iii) carried out other acquisitions to strengthen the non-GLE businesses such as mixing systems, heavy engineering etc. All of the above has been done without impacting the balance sheet with consolidated debt-equity at 1x at FY23-end. While we believe GMM has significantly strengthened in the recent years, the market seems to think otherwise: against GMM’s consolidated PAT CAGR of 44% CAGR over FY20-23, the share price CAGR has been significantly lower at 10%, resulting in 1-year forward P/E derating from 52x at FY20-end to 24x currently. We believe the current P/E of GMM significantly underestimates the longevity and growth in GMM’s free cash flows.

