The fact that Indian lenders are sitting on: (i) their highest ever capital adequacy, (ii) their lowest non performing assets since the Asset Quality Review in 2015, and (iii) their highest RoAs since FY13 has been masked by global macro uncertainties. Since private sector Indian banks are funded by growing domestic financial savings and have minimal foreign exposure on the asset side, global macro uncertainties are unlikely to impact the fundamentals of Indian lenders. Whilst the stars are indeed aligned for Indian banks, the key beneficiaries would continue to be lenders which have the ability to consistently deliver RoEs above the cost of capital over extended periods. This key trait compliments the ability of these high quality lenders
(which have underperformed the Bank Nifty over the past couple of years) to raise capital across market cycles at elevated P/B multiples, eventually leading to superior shareholder returns.
Performance update of the live fund
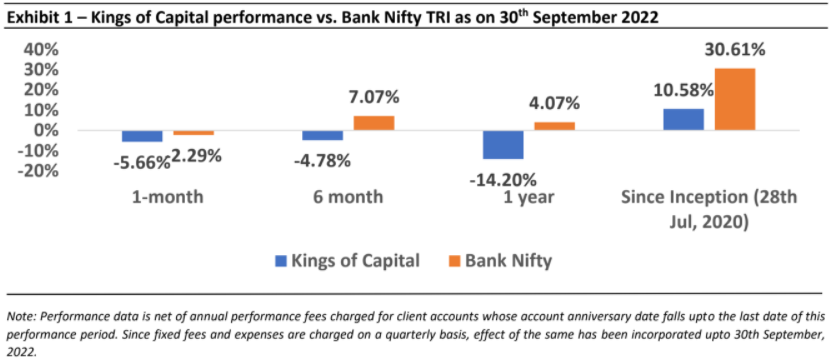
The key objective of our “Kings of Capital” strategy is to own a portfolio of 10 to 14 quality financial companies (banks, NBFCs, life insurers, general insurers, asset managers, brokers) that have good corporate governance, prudent capital allocation skills and high barriers to entry. By owning these quality financial companies, we intend to benefit from the consolidation in the lending sector and the financialization of household savings over the next decade. The latest performance of our PMS is shown in the chart below.
India’s banking sector is well positioned for rapid growth
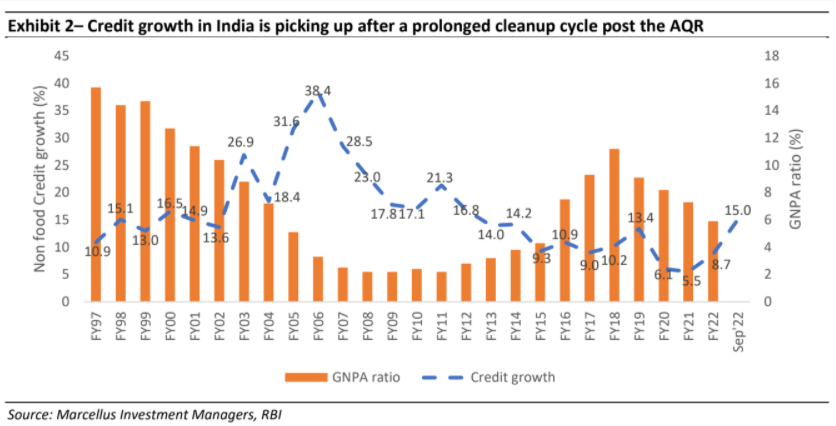
After a turbulent period of almost a decade, which saw credit growth in India come to a near standstill, the stars seem to be aligning for India’s banks. As can be seen in the exhibit below, credit growth has picked up over the last eighteen months or so with both the borrowers (i.e. corporates and households) as well as lenders sitting on healthier balance sheets as compared to a decade back.
High quality lenders are well placed to capitalize on the credit growth revival
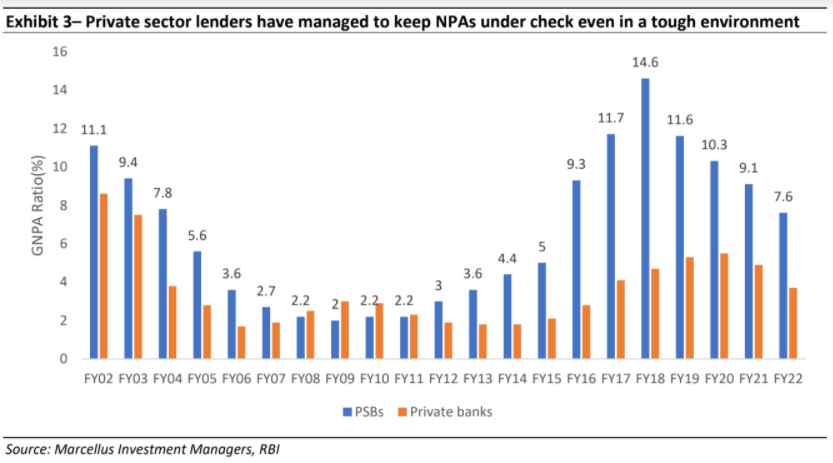
However, Exhibit 2 masks the dichotomy in the Indian banking industry viz. the difference in performance between private sectors banks and public sector banks (PSBs). If one was to break down the GNPA performance for PSBs and private sector banks,the wide divergence in performance over the past two decades becomes apparent. Even in FY22, the PSBs GNPA ratio is more than 2x that of private sector banks (7.6% vs 3.7%).
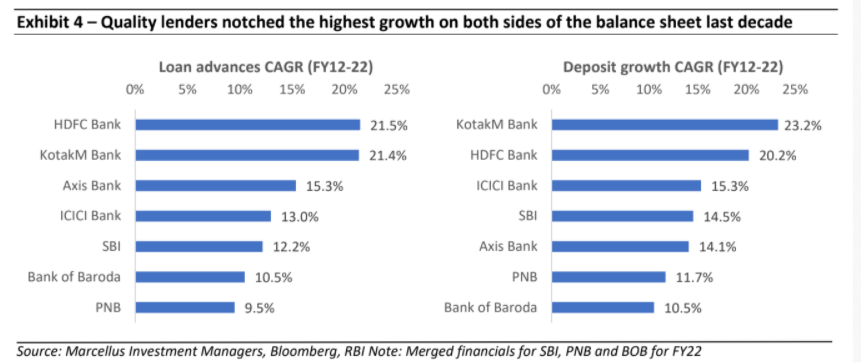
Similarly, even amidst moderate credit growth for the banking system as a whole, the private sector banks were able to notch a very healthy growth in loan advances of 18.1% CAGR over FY12-22 vs. just 6.8% CAGR for the PSBs. The scenario for deposits growth was much the same with the figures standing at 17.2% CAGR for private sector banks vs. just 8.4% CAGR for the PSBs. In both the cases, high quality lenders like HDFC Bank and Kotak Mahindra Bank came out on top.
More details on how high quality private sector lenders have built a strong foundation on the both asset and liability side for the next phase of their growth can be found in our Jul’22 newsletter.
Share prices of lenders with poor fundamentals have outperformed in the recent past
Over the last year or so, banking stocks which are considered to be attractive basis low value of metrics like P/BV and which are expected to a show near term improvement in their fundamental metrics have seen a lot of investor interest leading to an increase in the aforementioned multiples alongside commensurate stock returns. However, if one was to see the underlying metrics (in terms of RoE and GNPA ratio) it leaves much to be desired.
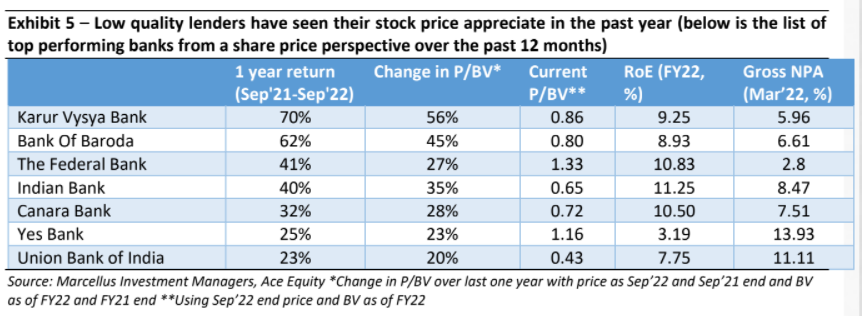
The central tenet of long term stock price compounding for lenders is that it happens in line with the Book Value Per Share (BVPS) compounding. BVPS compounding in turn is dependent on the bank’s RoE as well as the multiples at which equity capital raises are done over a cycle (for more details on this see our Jun’22 newsletter). Specifically, banks which are able to raise equity capital at higher P/BV multiples, deliver greater BVPS compounding for their shareholders.
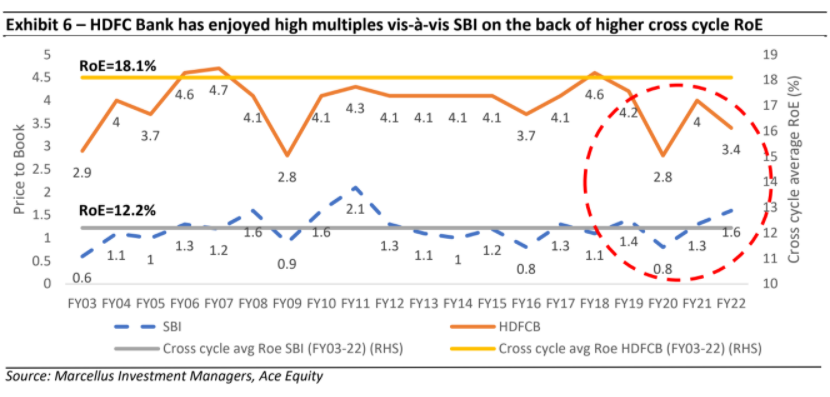
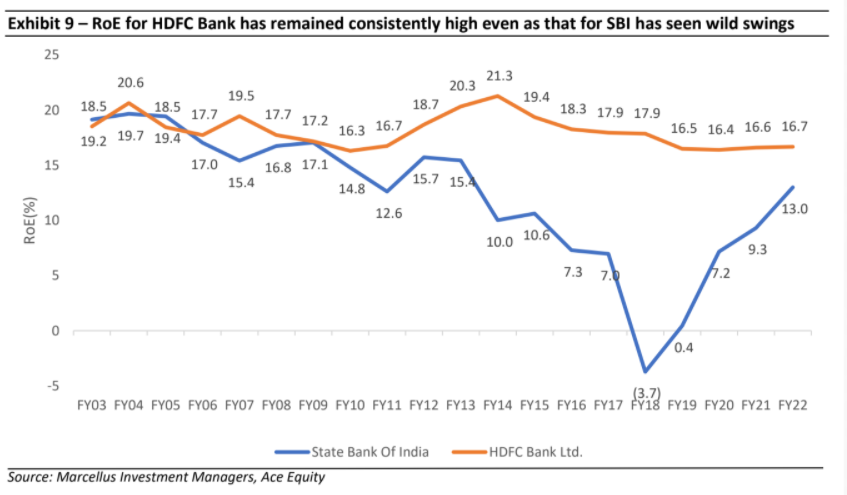
The recent divergence of stock price movements away from the aforementioned tenet we believe is a temporary phenomenon and it can be illustrated using the example of largest private sector bank i.e. HDFC Bank and largest PSB i.e. SBI. As can be seen in the chart below, in the recent past the P/BV multiple for HDFC Bank has retreated while the same has risen for SBI (marked in red circle). However, HDFC bank has continued to enjoy a P/BV multiple which is almost 2-3x that of SBI on a cross cycle basis. Such a wide differential in P/BV multiple is on the back of 50% higher RoE for HDFC Bank (18.1%) vs. SBI (12.2%) indicating the ability of the private lender to compound its BVPS (and its hence share price) at a much faster pace than the state owned lender.
RoEs supported by lower leverage reduce volatility in fundamentals
Further, high RoEs of HDFC Bank have not been generated on the back of high leverage (i.e. higher debt:equity ratio) but rather is a result of high RoAs. As can be seen in the chart below, the RoA for HDFC Bank has actually increased over the last 20 years from 1.4% to 1.9% whereas for SBI it has consistently remained below 1.1% touching lows of even -0.2% in FY18. Notice that not only are the absolute levels of RoA much higher for HDFC Bank, but they’re also much more consistent (implying lower volatility – measured in the exhibit below by standard deviation – in HDFC Bank’s operating performance).
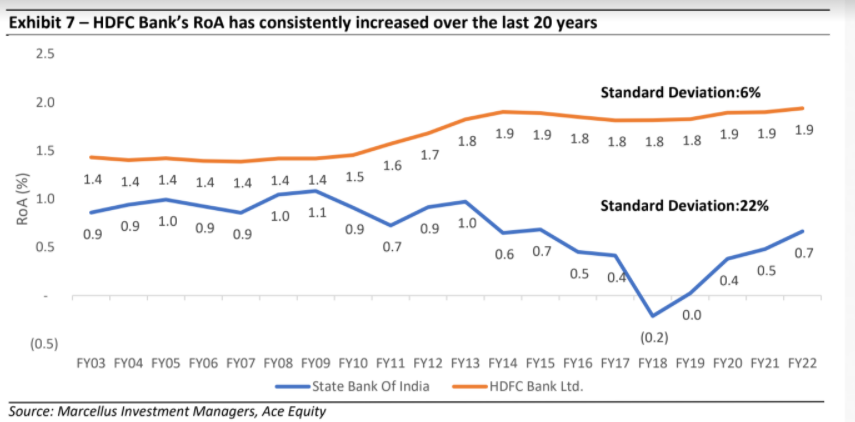
Leverage for HDFC Bank has in fact gone down vis-à-vis SBI which has seen its leverage ratio consistently increase since FY14.
The result is that HDFC Bank’s RoE has been both higher and much more consistent compared to SBI.
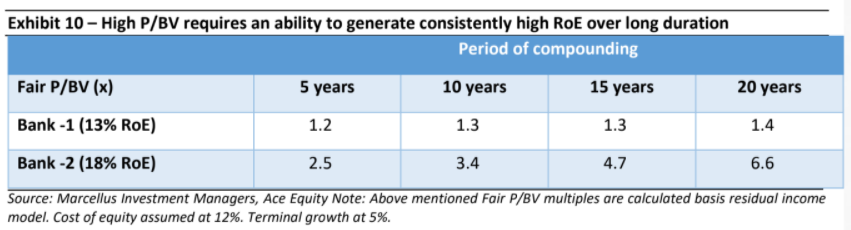
The ability of a bank to consistently generate high RoE over a long duration is what determines its fair P/BV and hence its ability to raise equity capital on favorable terms. As illustrated in the table below, a banking stock that generates a 12-13% RoE would trade in the vicinity of 1.2-1.4x P/BV. However, a banking stock that generates 18% RoE consistently over long term would have P/BV multiple in line with that seen for likes of an HDFC Bank.
Given the consistency in the fundamental aspects that have a bearing on long term BVPS compounding of a lender, we remain sanguine about the Kings of Capital portfolio even after recent underperformance by high quality lenders like HDFC Bank. The long term consistency of performance as highlighted above is rewarded by the stockmarkets long after bouts of euphoria (as is being seen currently) around relatively lower quality banking stocks subsides.
There are several historical precedents for what is currently playing out in Indian banks. For example, HDFC Bank’s stock price returns were close to zero from FY00-03 (these were the four years at the beginning of the noughties credit cycle) even as it’s BVPS compounded at 37% CAGR. This dissonance was corrected over the following five years however as the stock price compounded at 42% CAGR over FY03-08.
We expect to see a similar pattern playing out currently as the stock price performance of HDFC Bank has remained subdued since FY19 end. However, fundamentals have continued to grow at a healthy pace with a 5-year EPS CAGR of 20% but stock price CAGR of 10%. As in the past, the dissonance would resolve in the future as the stock price performance catches up with underlying fundamentals.

