While the first decade of this millennium (FY00-10) saw banking industry credit grow rapidly at a 22% CAGR, the past decade (FY11-21) has seen the banking system credit grow at only a 10% CAGR. The life insurance industry has also seen similar trends – premiums grew at 22% CAGR during FY01-10 vs. 8% CAGR during FY11-21. The general insurance industry saw slightly better trends this decade with 15% CAGR growth during FY01-10 vs. 17% CAGR during FY11-21. In stark contrast to this variability, KCP companies have consistently grown earnings at 20%+ CAGR thanks to: (a) conservative underwriting standards, (b) a sharp focus on segments that they deeply understand, and (c) clean management teams. In this newsletter we delve into their secret sauce. We also discuss the change made to the KCP portfolio over the past month – we sold City Union Bank and invested in Cholamandalam.
Performance update of the live fund
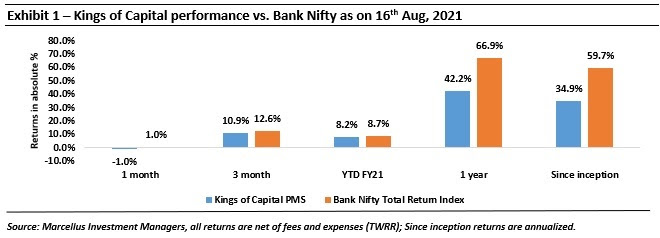
The key objective of our “Kings of Capital” Portfolio (KCP) is to own 10 to 14 high quality financial companies (banks, NBFCs, life insurers, general insurers, asset managers, brokers) that have good corporate governance, prudent capital allocation skills and high barriers to entry. By owning these high-quality financial companies, we intend to benefit from the consolidation in the lending sector and the financialization of household savings over the next decade. The latest performance of our PMS is shown in the chart below.
KCP portfolio companies have demonstrated consistent growth across time periods
As illustrated in Exhibit 2 below, KCP companies – regardless of whether they are lenders or non-lenders – have demonstrated consistent growth over the past decade despite the industries that they operate in growing at single digits or low double digits during this period. This ability to grow profits at a steady pace in a cyclical sector has made these Financial Services companies steady compounding machines. We delve deeper in the sections that follow as to why these handful of Financial Services companies have been able to stand tall in a sector which has been a graveyard for many prominent and well capitalised Financial Services companies.
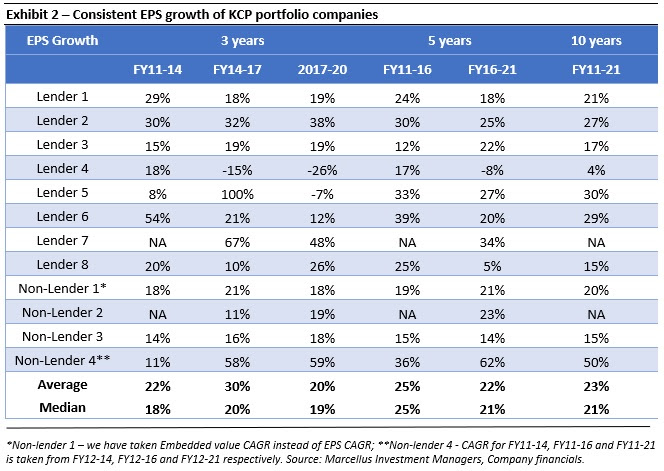
The key conclusions from Exhibit 2 above are:
-
Consistent performance across time periods:
Irrespective of the length of time i.e. 3 years, 5 years or 10 years or the beginning or ending points, the KCP companies have delivered a healthy rate of compounding. As illustrated in our November 2020 newsletter, (click here to read) high quality financial services stocks have delivered not only superior absolute returns but also superior risk adjusted returns versus the Nifty over the past two decades.
-
Growth has been a result of market share gains:
The healthy growth of the KCP portfolio companies has not come because of the underlying Financial Services sector growing rapidly; a large part of the growth for KCP companies has come from market share gains. Over the past decade, the Indian financial system has been hit by several disruptive events such as the RBI’s asset quality review, demonetization, introduction of the Goods & Services Tax, the IL&FS crisis, Yes Bank’s struggles, the DHFL panic and now Covid-19. Although these events have led to an adverse impact on the Financial Services sector, the KCP companies have benefited from the challenges faced by their competitors. While the KCP companies also get impacted in an absolute way from a crisis like Covid-19, the relative impact on these companies is much lower than their competitors and as illustrated in our December 2020 newsletter (click here to read), Covid will lead to further market share gains for the KCP companies. The 20%+ EPS CAGR generated during FY16-21 (see Exhibit 2) is despite the excess provisions created by KCP lenders for Covid-19 related disruptions.
-
Portfolio approach to risk and returns:
In a ‘buy and hold’ portfolio with low churn, not every company in the portfolio will grow at the same pace every year. Hence the idea is to build a resilient portfolio which compounds at a healthy rate over a 3 to 5 year period. We can see that certain companies accelerate their growth and make up for the laggards during a 3-year period while the laggards become outperformers during other time periods. As a result, the overall portfolio is able to deliver a healthy rate of compounding for each 3-year period. For example, Lender 8 grew its EPS at a CAGR of 20% during FY11-14 and observed a deceleration in growth rate to 10% during FY14-17. However, during FY14-17, Lenders 2 and 3 further accelerated growth from the previous 3 year period.
KCP portfolio companies continue to generate 20%+ return on equity consistently
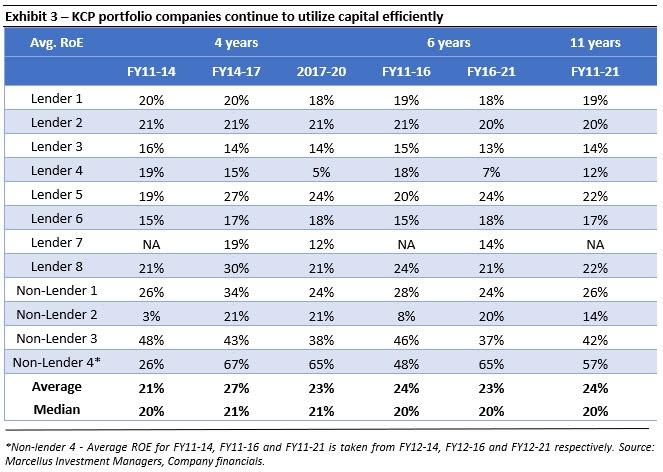
Looking at the PAT growth of Financial Services companies in isolation can be misleading as these firms can raise equity capital, lend it out and increase their profitability in absolute terms. However, every time a Financial Services firm raises equity capital, its existing shareholders get diluted. It is therefore important to look at the return on equity (ROE) that a Financial Services company generates in addition to its PAT growth. As illustrated in Exhibit 3 below, the ROE for the KCP companies remains consistently above the 20% mark and the earnings growth of KCP portfolio companies has not come at the cost of excessive dilution to existing shareholders of these Financial Services companies.
The ‘expensive’ valuation of certain KCP portfolio companies works to their advantage
In the February 2021 KCP newsletter (click here to read) we had illustrated how more than 80% of shareholder returns arise from book value per share growth and less than 20% of share price returns are attributable to entry P/B multiples. In addition to a lower BVPS compounding, shareholders of low-quality lenders are at a disadvantage as they get repeatedly diluted over time while a high-quality lender trading at a high P/B multiple sees a lower dilution while raising equity. Consider the two illustrations below:
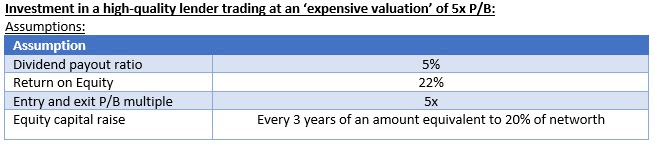
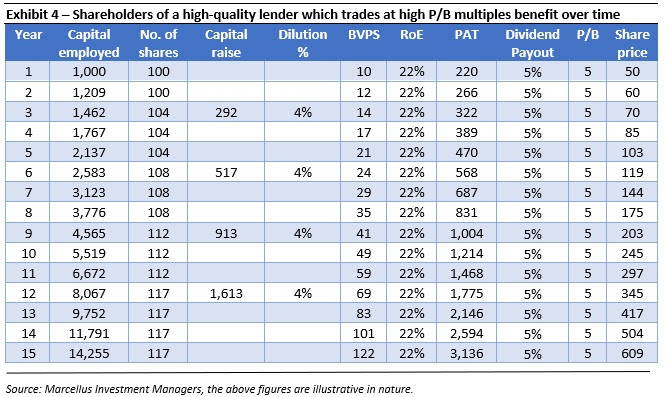
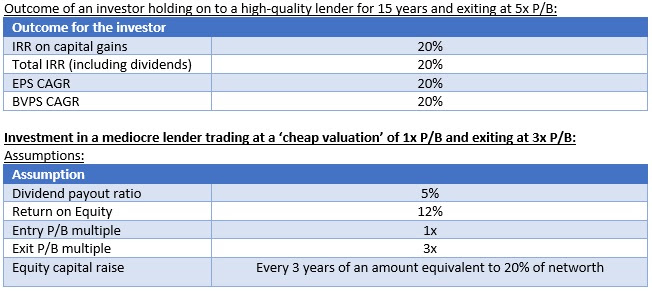
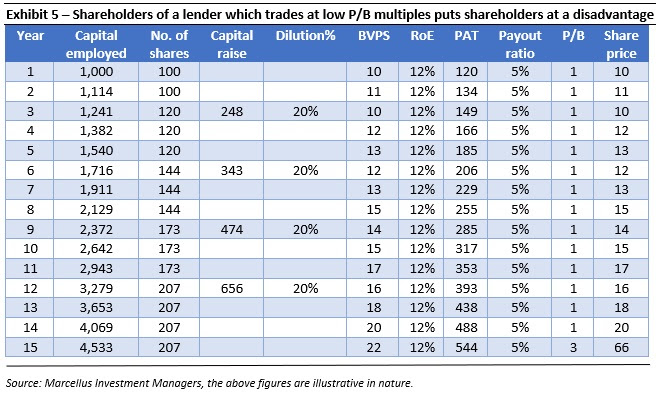
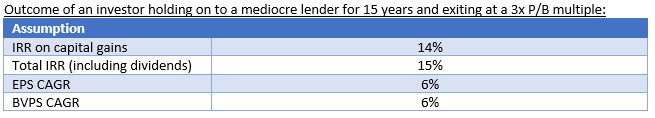
From Exhibits 4 and 5 above we can conclude that:
- Even if an investor is able to enter a mediocre Financial Services business at a low valuation (1x P/B in Exhibit 5) and exit at a high valuation (3x P/B in Exhibit 5), his returns will be significantly lower (15% vs 20%) than the investor who invested in a high-quality business at a 5x P/B multiple and also exited at a 5x P/B multiple.
- Even if it so happens that at the end of 15 years, the valuation multiples of the mediocre business and high-quality business somehow converge at 3x P/B i.e. the investor who entered the high quality business at 5x P/B exits at a 40% lower valuation of 3x P/B, his IRR on the investment will still be higher than the investor who invested in the mediocre business.
- The dilution for shareholders of mediocre quality businesses will be higher than shareholders of high-quality businesses – because higher the P/B multiple, lower the dilution. Astute management teams of high-quality lenders are also able to time equity raises such that it results in a minimum dilution for their shareholders. In our blog on Uday Kotak (click here to read) we had illustrated how Kotak Bank has timed QIPs properly to ensure minimum dilution for their shareholders.
The reasons for the strong fundamental performance of KCP portfolio companies:
The healthy performance of KCP companies and the numbers illustrated above are just an outcome of the following common traits of KCP companies:
-
Conservative underwriting:
The average Gross Non Performing Assets (GNPAs) ratios of the KCP lenders over the past 3/5/10 years has been 2.7%/2.8%/2.2% vs. the banking industry average of 8.3%/9.2%/6.3%. This differential implies that the KCP lenders have had a ~70-80% better underwriting experience than the banking industry across time periods. While a large part of the NPAs of the banking system have been on the balance sheets of PSU banks, the GNPAs of private banks during the same period have also been higher than the KCP lenders at 5.1%/4.8%/3.4%. Thus, KCP lenders have seen the asset quality differential even versus the private players only increase over time.
-
Focus on segments with deep expertise and measured experimentation in new segments:
Apart from the larger banks, specialized lenders in the KCP portfolio such as AU, Chola or Aavas have focused on the segments where they have developed a deep expertise in understanding the customer, underwriting and collections. These lenders operate in markets which are large enough for them to continue growing for many years and have prudently not indulged in unnecessary diversification and have therefore been able to avoid any asset quality accidents. Even HDFC Bank and Kotak Bank stayed away from infrastructure financing during 2004-13 while many other large banks were aggressively growing their loan book in the segment. Any experiments in new segments by KCP lenders such as HDFC Banks’ foray into retail lending is generally done through small pilot projects without taking substantial balance sheet risk. For eg. recently for the first time Bajaj Finance has opened branches in geographies where neither a SBI branch nor a HDFC Bank branch is present. However, these branches will initially be only deposit accepting branches with only one lending product – gold loans which are a secured, low risk product.
Clean and able management teams:
7 of the 12 KCP portfolio companies (~60% of portfolio weight) have CEOs who have been leading the company for at least the past decade and have therefore been responsible for the healthy fundamental performance of these companies discussed earlier in the newsletter. In addition to these 7 companies, HDFC Life and HDFC Bank have CEOs who had been with the company in senior leadership roles for more than a decade before taking up the CEO role. We are therefore backing high quality management teams who have been able to deliver outstanding results in the past and have skin in the game in the form of substantial value of company ownership or ESOPs.
Changes made to Marcellus KCP Portfolio
Last month, we replaced City Union Bank with Cholamandalam Investment and Finance Company (‘Chola’). Over the past decade, Chola has emerged as one of the leading vehicle financiers with consistent growth, stable asset quality and healthy return on equity. The core business segments of Chola include vehicle finance and home equity. Over the years, Chola has diversified its loan book to include products across the vehicle financing sector and has expanded to the home equity segment which has enabled it to counter the cyclicality of the vehicle finance business. The company has gained market share in vehicle financing by growing its book at a CAGR of 20% over FY16-21 which is much higher than its peers who have grown in the mid to early teens. With a robust sourcing and collections model, Chola has been able to maintain its asset quality with GNPAs consistently below 4.0% and spreads at ~7% over the years. Chola’s Murugappa Group parentage and access to funding has helped it grow through the past few years despite the macro headwinds faced by the NBFC sector.
In addition to Chola’s sound financial performance, our decision was also prompted by the recent appointment of Vellayan Subbiah – Chola’s Managing Director during the 2010-17 period – as the Chairman of the company. Given the low business overlap with banks, the expected recovery in the CV cycle and Chola’s ability to straddle across business segments, we believe that Chola can deliver healthy earnings growth and RoEs over the next few years. While we continue to believe that City Union Bank is a well managed, conservative lender with a loyal customer base in Tamil Nadu, we expect its earnings growth to be lower than that of Chola. Given the availability of Chola as a substitute with higher earnings growth expectations, we have decided to make space for Chola by exiting from City Union Bank in the Kings of Capital portfolio.
All of the companies mentioned above are a part of Marcellus’ Kings of Capital Portfolio.
|
|
Disclaimer: Copyright © 2026 Marcellus Investment Managers Pvt Ltd, All rights reserved
Note: the above material is neither investment research, nor investment advice. Marcellus does not seek payment for or business from this material/email in any shape or form. Marcellus Investment Managers Private Limited (“Marcellus”) is regulated by the Securities and Exchange Board of India (“SEBI”) as a provider of Portfolio Management Services. Marcellus is also a US Securities & Exchange Commission (“US SEC”) registered Investment Advisor. No content of this publication including the performance related information is verified by SEBI or US SEC. If any recipient or reader of this material is based outside India and USA, please note that Marcellus may not be regulated in such jurisdiction and this material is not a solicitation to use Marcellus’s services. This communication is confidential and privileged and is directed to and for the use of the addressee only. The recipient, if not the addressee, should not use this material if erroneously received, and access and use of this material in any manner by anyone other than the addressee is unauthorized. If you are not the intended recipient, please notify the sender by return email and immediately destroy all copies of this message and any attachments and delete it from your computer system, permanently. No liability whatsoever is assumed by Marcellus as a result of the recipient or any other person relying upon the opinion unless otherwise agreed in writing. The recipient acknowledges that Marcellus may be unable to exercise control or ensure or guarantee the integrity of the text of the material/email message and the text is not warranted as to its completeness and accuracy. The material, names and branding of the investment style do not provide any impression or a claim that these products/strategies achieve the respective objectives. Further, past performance is not indicative of future results. Marcellus and/or its associates, the authors of this material (including their relatives) may have financial interest by way of investments in the companies covered in this material. Marcellus does not receive compensation from the companies for their coverage in this material. Marcellus does not provide any market making service to any company covered in this material. In the past 12 months, Marcellus and its associates have never i) managed or co-managed any public offering of securities; ii) have not offered investment banking or merchant banking or brokerage services; or iii) have received any compensation or other benefits from the company or third party in connection with this coverage. Authors of this material have never served the companies in a capacity of a director, officer or an employee.
This material may contain confidential or proprietary information and user shall take prior written consent from Marcellus before any reproduction in any form.
Regards, Team Marcellus
If you want to read our other published material, please visit https://marcellus.in/pms-investment-blog/
Copyright © 2026 Marcellus Investment Managers Pvt Ltd, All rights reserved

