Forecasts of the growth prospects of any business are based on several factors, many of which are qualitative in nature, such as management quality, capital allocation discipline, the ability to disrupt rather than be disrupted by unforeseeable events, etc. Investors who arrive at these decisions based on their personal beliefs or myths expose themselves to subjectivity in their stock selection and portfolio construction. Such subjectivity often weakens the risk-reward outcomes of their portfolio due to biases, inability to scale up research efforts, and inability to forecast the risks (rather than just returns) of the portfolio. At Marcellus, our ‘Longevity Framework’ quantifies the qualitative aspects of the companies under our coverage to make investing a more scientific process which can be improved over time.
Performance update – as on 31st August 2021
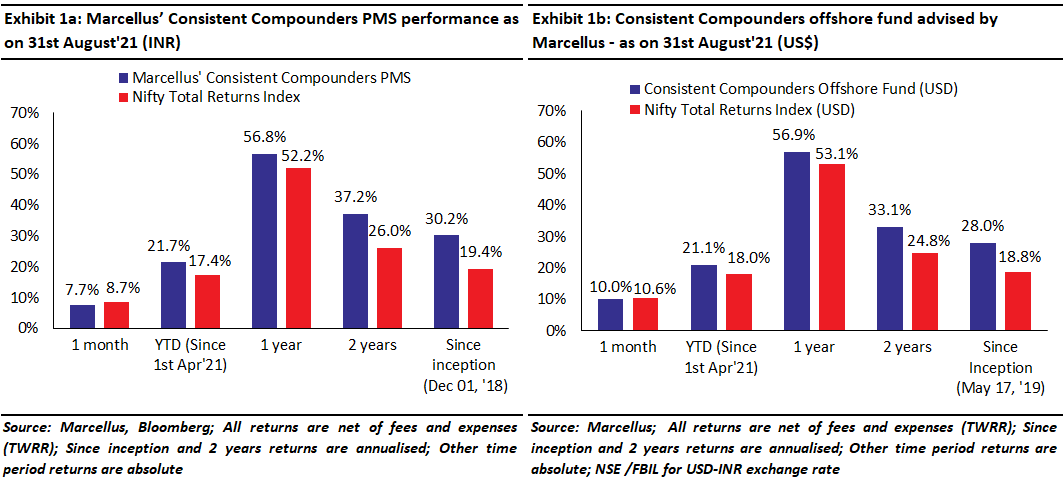
We have a coverage universe of around 25 stocks, which have historically delivered a high degree of consistency in ROCE and revenue growth rates. Our research team of eleven analysts focuses on understanding the reasons why companies in our coverage universe have consistently delivered superior financial performance. Based on this understanding, we construct a concentrated portfolio of companies with an intended average holding period of stocks of 8-10 years or longer. The latest performance of our PMS and offshore fund (USD denominated) portfolios is shown in the charts below.
Subjectivity in decision making – one of the biggest risks faced by equity investors
“The evidence from more than fifty years of research is conclusive: for a large majority of fund managers, the selection of stocks is more like rolling dice than playing poker… The fact that the future is unpredictable is undermined everyday by the ease with which the past is explained… The illusion that we understand the past fosters overconfidence in our ability to predict the future.” – Thinking, Fast and Slow by Daniel Kahneman (Chapter 20, The Illusion of Validity).
Since history of a company is factual, historical data points are reasonably objective and quantifiable. However, equity investments require an investor to ‘forecast’ the future share price progression of a company. Such forecasting is based on decisions made around qualitative factors like:
- How good is the management team of the company?
- What is the risk to the forecast of profits or free cashflows from a disruption from a competitor or a black swan event?
Furthermore, after having selected the list of stocks an investor intends to purchase in her investment portfolio, she also needs to compare the selected companies against each other around these factors, in order to position-size the stocks relative to each other in the portfolio. For instance, if an investor is convinced about the quality of management of two portfolio companies – Company A and Company B, then how does the investor compare the quality of the two management teams against each other? How does the investor compare the pricing power of the two companies against each other? Which of the two is more susceptible to the risk of disruption in future? Quantification of answers to these questions becomes even more important if the businesses of Company A and Company B are not comparable with each other in their shape & size and their business models.
Often investors answer these questions subjectively, based on their personal experiences, feelings, or beliefs. Listed below are some of the disadvantages of building a portfolio based on subjective answers:
Cognitive biases:
In any profession, the well qualified professional is likely to have biases. In Chapter 20 of ‘Thinking, Fast and Slow’ Daniel Kahneman says, “The person who acquires more knowledge develops an enhanced illusion of her skill and becomes unrealistically overconfident.”. Biases in investing due to subjectivity of assumptions and forecasts could result in avoiding stocks that should have been included in the portfolio, delaying the decision to exit from a portfolio holding, or sub-optimal position sizing to get the desired balance of risk-return from the portfolio.
The need to forecast risks (not just returns):
There are several risks which cannot be forecasted using standard measures such as beta or Sharpe ratio or standard deviation. For instance, risk of the CEO’s succession cannot be measured by any such ratio which are based on historical data especially if the event of CEO’s succession has never occurred in the past. Such risks need to be quantified at a stock level to optimize the interplay of risks and rewards of various stocks. This helps meet the overall portfolio’s desired objectives, which cannot be achieved using subjectivity.
Working across a team of analysts at a point in time:
A portfolio constructed after considering several diverse sectors and stocks within those sectors requires a team effort, rather than an individual investor. It is difficult to harness the research efforts of such a team efficiently if the decisions being made by the team are subjective in nature. In specific, it will be difficult to compare the efforts and opinions of different team members on a like for like basis without letting the decision-making get biased. As a result, such teams lack sustainability and scalability in their efforts across stocks / sectors and over time.
Staying disciplined during challenging periods:
There are always going to be times when an investor’s conviction gets challenged either due to a black swan event in the external environment (macro, regulatory, etc), or an unexpected development within a company. It is hard to maintain discipline during such times through subjective decision-making. In fact, the clarity of thought provided by objective decision-making during challenging times is most rewarding for an investor in the long term.
Outcomes must be quantitative!
No matter how qualitative the characteristics of an investment philosophy are, the end result of all research efforts has to be quantifiable – a risk-reward outcome through a portfolio with position sizing and portfolio concentration which are representative of the gradient of these characteristics.
Investment implications for Marcellus’ portfolios
In our 1st December 2020 CCP newsletter we had highlighted that whilst investing decisions based on myths or one’s personal beliefs expose an investor to more luck than skill, a rigorous hunt for mathematical and scientific tools helps the investor reduce the contribution of luck and enhance the probability of success.
Marcellus’ investment philosophy seeks characteristics such as a high-quality management team, decentralized and institutionalized execution of strategy and execution, disciplined capital allocation, high pricing power, etc. These characteristics not only drive the rate of growth of free cashflows of our portfolio companies, but they also determine the risks involved in the ‘sustenance’ or ‘longevity’ of free cashflow compounding. Quantifying the prevalence of such qualitative characteristics is integral to our investment philosophy because longevity of free cashflows (rather than just the rate of growth of free cashflows) is the most undervalued aspect in the share price of any ‘consistent compounder’.
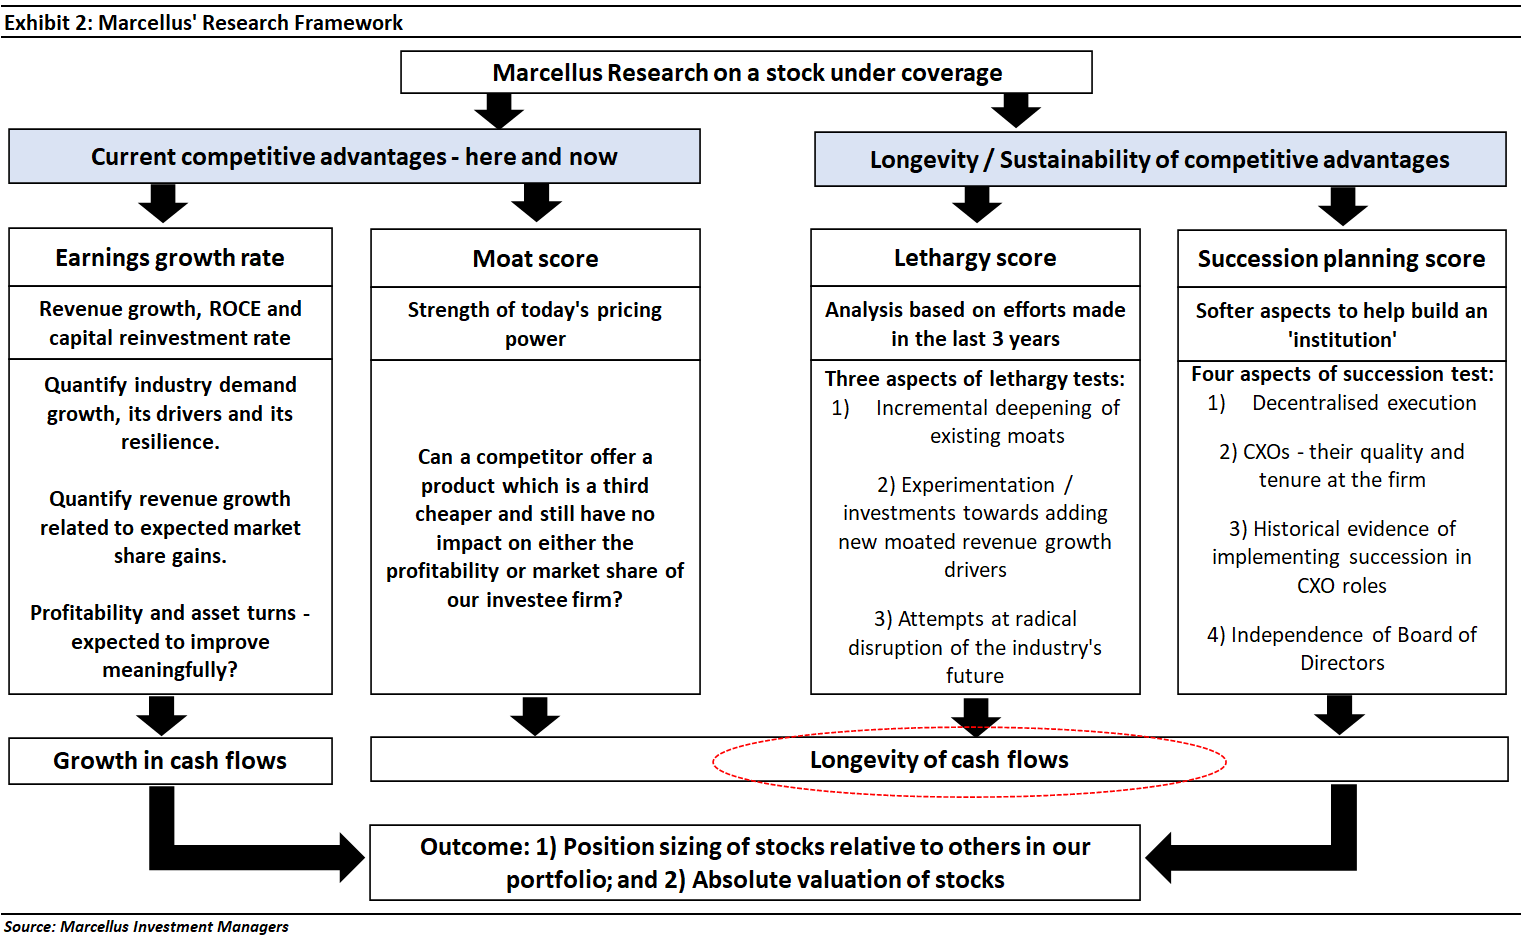
Our investment process (see exhibit 2 below) includes, amongst other things, breaking down all such qualitative characteristics into granular measurable attributes. Companies in our coverage universe are then scored on these parameters. Finally, an interplay of the scores across various risk and reward parameters is then established so that critical risks are treated differently from not-so-critical risks compared to the expected rewards / returns. This exercise optimizes the risk-reward of the overall portfolio, and it scientifically drives position sizing (which stock should get how much allocation in the portfolio). Moreover, it also drives the concentration of our portfolios, as we had explained in our 5th April 2021 newsletter.
These scores are periodically updated as research on stocks in our coverage universe progresses, thereby driving rebalancing of position sizing or decisions around entry / exits in our portfolios.
The table below will help our clients understand why the Longevity Framework outlined above allows us to manage well over US$1 billion now without losing sleep about questions which trouble other investors eg. Should I increase the portfolio’s weight in Industrials or Financials or FMCG or IT Services? How can I compare L&T with Nestle? How can I compare Nestle with HUL? When should I increase or decrease my position size in HDFC Bank?
For the team at Marcellus, all of the above questions are answered – systematically and rigorously – by our proprietary Longevity Framework. The exhibit below summarises some of key differences between conventional investing and Marcellus’ Longevity Framework.


Team Marcellus

