Marcellus’ Global Compounders Portfolio (GCP) invests in 25-30 deeply moated global companies (listed on developed countries’ stock markets) based on rigorous bottom-up research around moats, capital allocation and sustainability of cash generation into the long term future. Consistency of free cashflow compounding of GCP companies is an outcome of: (a) the nature of products and services – ‘pick and shovel’ to the global economic megatrends, utilities and consumption; and (b) moats built around process capability, R&D and capital allocation. GCP companies have historically grown their free cashflows per share at about 20% (USD) annually over last decade vs. S&P 500’s 6-7% (USD). With average age of the portfolio companies being more than 6 decades, with more than 20 years of greatness and dominance in their present lines of businesses, GCP companies display the characteristics of exceptional resilience while delivering compelling growth. Besides fundamental research, position sizing in GCP also includes our proprietary quantitative tools for style-based position sizing (‘Torque’) and managing valuation extremities. Investment in Marcellus’ GCP is through Separately Managed Accounts (i.e., SMAs, just like a PMS) via GIFT City (regulated by IFSCA) with a minimum investment amount of USD 150,000. Marcellus went live with GCP on 31st October 2022.
Over 80% of GCP’s allocation is in stocks listed in USA with businesses spread across Asia, Europe and the North America. The top 13 stocks in the portfolio contribute to more than 75% of total portfolio allocation.
Why should one look at the US stock market for long term wealth compounding?
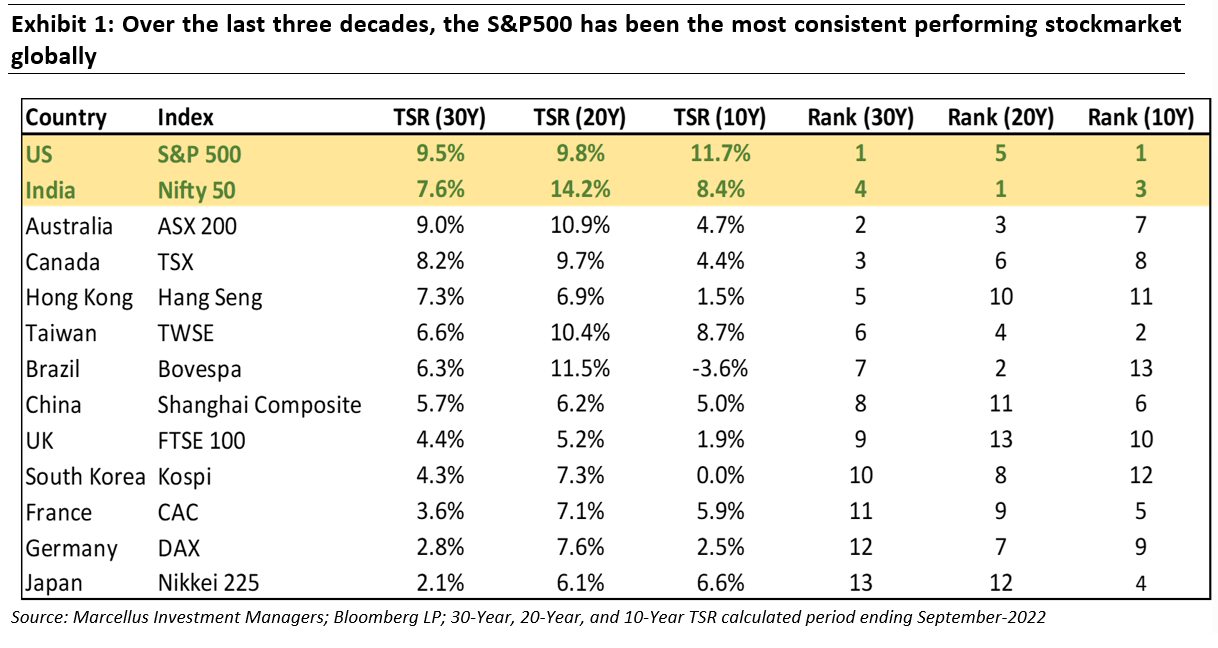
Reason #1: S&P 500 has delivered the highest total shareholder return in the last 30-years & 10-years
The S&P 500 index has been the most attractive market for long-term wealth creation. The US is home to some of the most innovative companies in the world with global scale of operations. The presence of these global leaders has enabled the S&P 500 to consistently give attractive return over multiple decades.
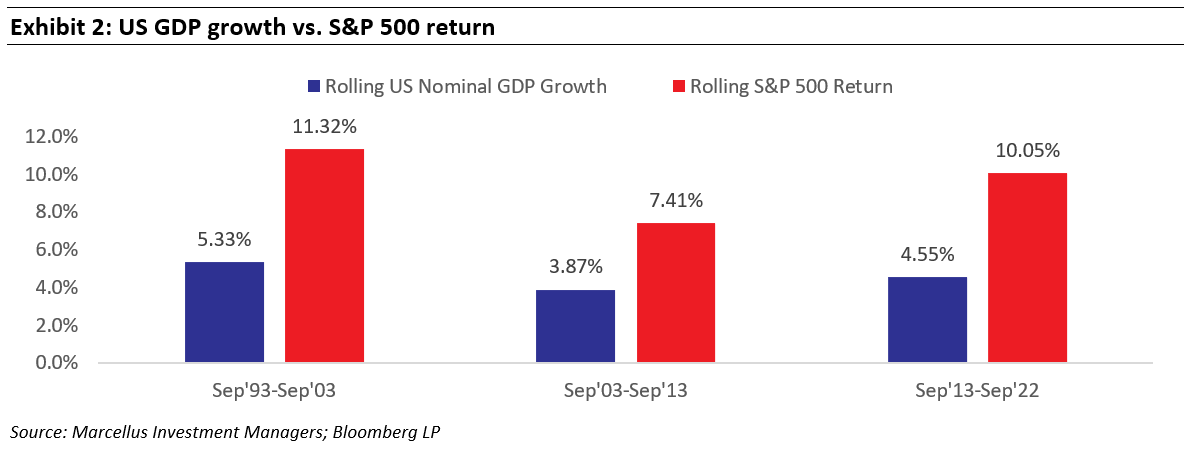
Reason #2: S&P 500 Index returns are disassociated with nominal US GDP growth
Even though the nominal US GDP growth has been 4-5% CAGR over last 30-years, the S&P 500’s returns have been considerably higher (see exhibit below). One of the reasons for this is that most S&P 500 companies have global presence and this helps them to grow much faster than the US economy.
Global Compounders (GCP) Portfolio
Global Compounders Portfolio is a selection of 25-30 companies selected from the S&P 500 and developed European markets.
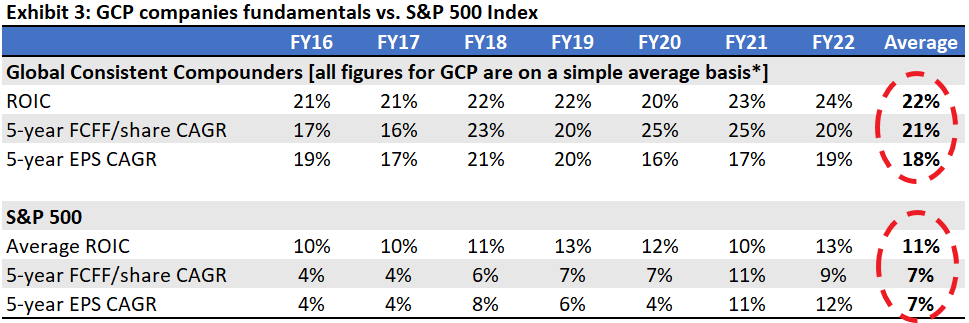
Fundamentals of GCP companies significantly outperform those of the S&P 500 Index
The deeply moated dominant global franchises of GCP have grown their free cashflow per share at about 20% (USD) annually over last decade vs S&P 500’s 6-7% (USD). This in turn has led to outstanding compounding compared to benchmark indices like the S&P500 – see the exhibit below. GCP companies score much higher than an average S&P 500 company on fundamental parameters. The average ROIC of GCP companies at 22% is 2x that of the S&P 500. The superior fundamental performance of GCP companies comes from deep competitive advantages, efficient operational execution, and superior capital allocation.
GCP companies can be classified into 3 categories which provides consistent growth through three global megatrends – ‘Pick & Shovel’, Utility and Consumption
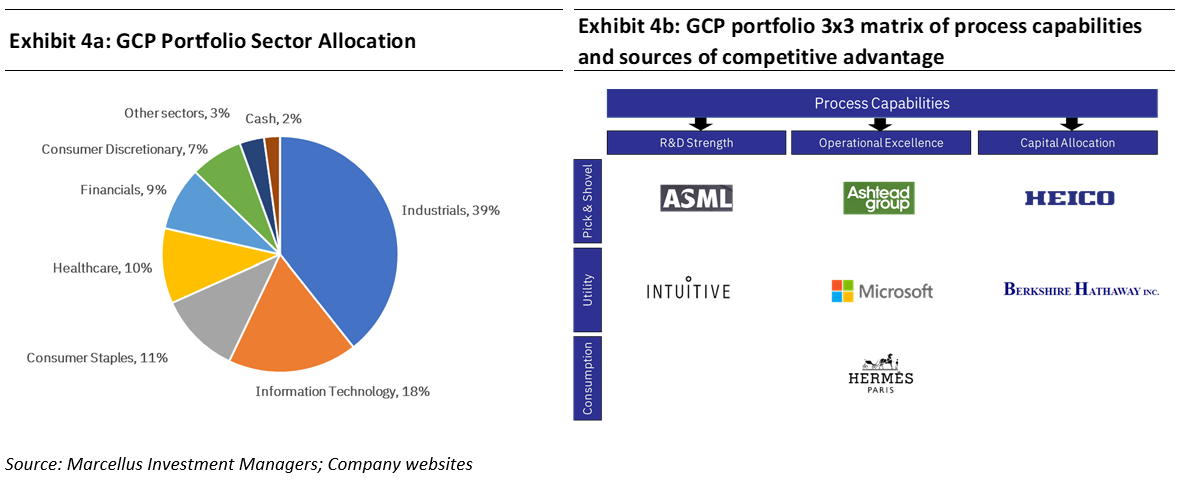
The sectoral allocation of the GCP portfolio (see chart on the left above) is in businesses which feed into global megatrends such as digitisation, re-industrialisation, productivity and consumption.
The nature of products and services provided by the GCP companies allows them to: (a) generate consistently healthy growth revenues & profits thanks to strong growth in underlying demand, and (b) gives them opportunities for capital allocation to drive growth in peripheral industries. We divide our portfolio companies into three buckets (as shown in the exhibit on the right above).
1. Pick & Shovel (40%-45% of GCP Portfolio allocation):
Pick & Shovel companies provide necessary tools or services for an industry to produce products. The name originates from the 19th century “Gold Rush” mania where companies providing tools for mining gold made much more money than those that were mining gold. Pick & Shovel companies form the backbone of industries they support. Moats built by Pick and Shovel businesses benefit from the growth of the industry, regardless of which of the customers of these companies gain market share at the ‘front-end’.
For instance, ASML manufactures Extreme ultraviolet (EUV) machines used for lithography on silicon for chip production. These chips are eventually used in electronic devices such as mobile phones, laptops, etc. ASML is the only company in the world with the technological capability to manufacture EUV machines. These machines project extremely short wavelengths to print circuit patterns on silicon wafers. The process is an essential step in manufacturing complex integrated chips. They also control (through equity stakes), the supply of core components used to manufacture these machines, making it extremely difficult for competitors to develop these machines. ASML has over 90% market share in the overall lithography market. As a result, regardless of who wins market share in mobile phones Apple / Samsung / others, and regardless of who wins market share in laptops (Lenovo / Dell / others), ASML’s free cashflows keep growing through its R&D capabilities and supply chain dominance.
2. Utility (35%-40% of GCP Portfolio allocation):
Traditionally utility companies provide everyday necessities such as electricity, water, and gas etc. With the passage of time, the necessities of humans have evolved and hence we have also expanded our definition of everyday necessities to include companies whose product have become essential part of their end users.
For instance, Microsoft sells software that are used in our offices and homes – MS Office, Windows, LinkedIn, Bing, etc. These products are utilities in the context of our day-to-day lives, and it is hard to imagine a day that goes by without using them. Microsoft Azure is the global #2 player in cloud computing with a particularly strong market position in the enterprise business (i.e. the business of selling cloud solution to firms like Marcellus). The strength of Microsoft’s franchise – with households and with businesses – enables the firm to generate significantly higher and more sustainable free cashflows as compared to its competitors.
3. Consumption (20%-25% of GCP Portfolio allocation):
Consumption themed GCP portfolio companies are a play on the increase in spending capacity of the population as well as a play on premiumization.
For instance, Hermes is a global luxury brand which offers a combination of rich heritage, exquisite craftsmanship, and high-quality products. These factors enable Hermès to have a super-premium aspirational brand recall amongst wealthy customers. Hermes’ products (such as its handbags) are a monopoly at those price points (no other company sells handbags priced $20-60k per bag), offering a value add to its customers that is difficult for any competitor to build over a short period of time. Whilst the world’s population is growing at 1% CAGR, the number of millionaires are growing at 13% CAGR and Hermes’ target customer base is growing at an even faster rate.
GCP companies’ moats arise from their R&D capabilities, Operational Excellence and Capital Allocation
In addition to moats built around attributes such as operational excellence and reputation, most GCP companies have also built their moats around attributes such as R&D capabilities and capital allocation, fortifying their dominance and driving outstanding cash generation.
1. R&D (research and development) capabilities:
Deep competitive advantage through ownership of proprietary technology or capabilities with heavy R&D investments (as high as 5%-10% of revenues for some GCP companies and amounting to R&D spends running into tens of billions of dollars).
For instance, Intuitive Surgical is a manufacturer of robotic surgery related devices called Da Vinci systems.Intuitive owns a technology patent essential for performing robotic surgery and aggressively invests in R&D thus maintaining its technological lead over competition. The firm consistently spends 9%-10% of its revenues each year in research and development (R&D)
2. Operational Excellence:
Processes which are part of a company’s DNA and are hard to copy. These processes are a combination of scale advantages, working capital automation, asset turn expansion, focus on only cash generative areas of the business, etc. Through these processes, such firms add value to their end consumer which is difficult for competitors to replicate.
For instance, Costco is a large, big-box retailer in the US. Costco’s competitive advantage comes from the ability to identify a narrow range of SKUs relevant for its customers, negotiate downwards the procurement prices of these products and offer high quality private label products (at price points that competitors simply cannot match). Costco’s ability to deepen such process oriented moats stems from its superior incentivisation, its culture, its ability to motivate of high-quality retail talent which then maintains the discipline of retail execution.
3. Capital Allocation:
The ability of companies to redeploy operating cashflows both to deepen their core as well as go beyond their existing core businesses through M&A is an essential part of franchise strengthening. Additionally, highly cash generative GCP companies execute share buybacks and give special dividends to enhance total shareholder returns.
For instance, Heico is a generic parts supplier for the aviation industry. The company follows a disciplined M&A approach by acquiring businesses which complement its existing product portfolio. Over the past 15 years, Heico has grown its Free Cash Flow to the Firm (FCFF) per share at 16% CAGR. Approximately 40% of this compounding has come from organic growth (growth in aviation industry, market share gains, premiumisation and price hikes). Another 40% of the FCFF per share growth has come from acquisitions executed by Heico during the period. The final 20% of the FCFF per share has come through consistent share buybacks and dividends.
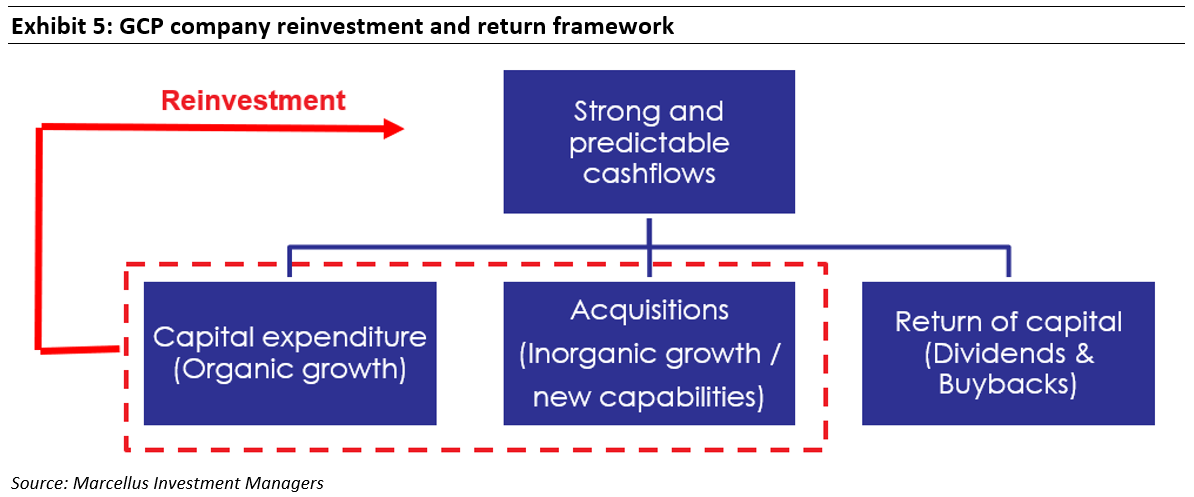
High cash generation by GCP companies leads to long-term shareholder wealth creation
We prefer to invest in companies with high cash generation ability as this allows them to invest in organic and inorganic growth opportunities and return excess capital to shareholders through dividends and buybacks. The high ROCE of GCP companies enables them to grow faster organically with lower reinvestment. This allows GCP companies to have excess capital which can be used for acquisitions and for the return of capital.
GCP companies have a long track record of operational excellence
All GCP companies have a long operational history. These businesses have endured over multiple business cycles thereby underscoring the high level of durability of these businesses. The long history of GCP companies gives us confidence in the ability of these companies to navigate future challenges that can range from changes in economic cycle to technological disruption. The youngest company in GCP portfolio is Intuitive which is 27 years old while the oldest company is Hermes which is more than 180 years.
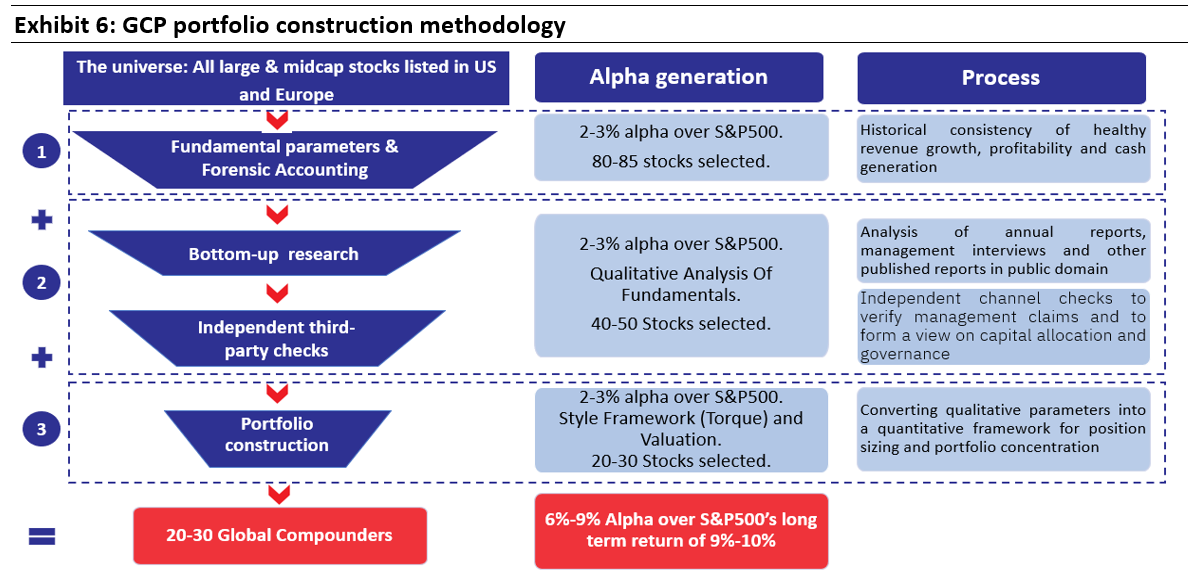
After the initial filters highlighted in the exhibit above have narrowed down the overall stock universe to define our coverage universe, we use two separate set of frameworks to build the GCP portfolio.
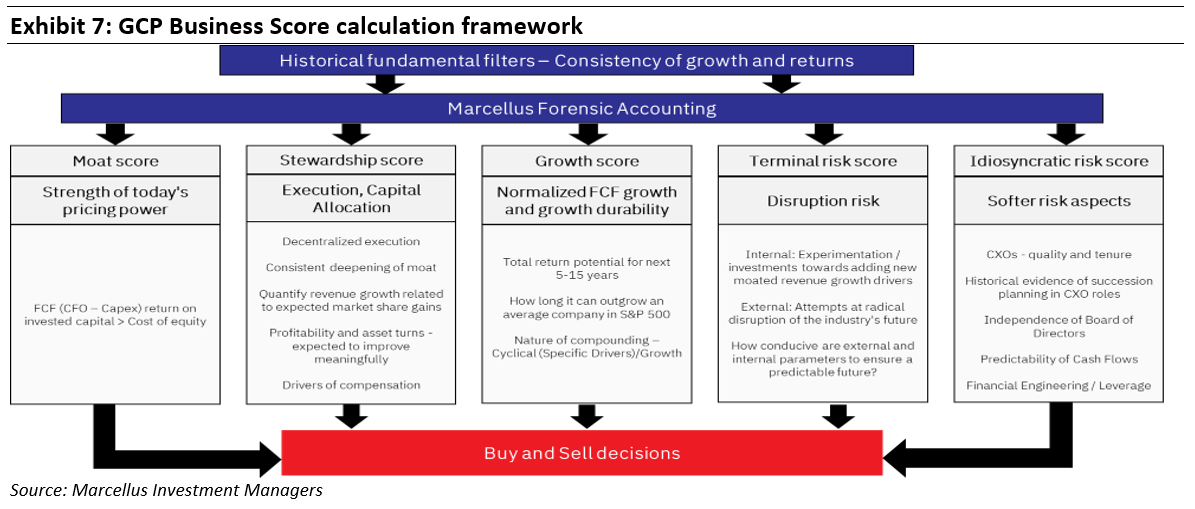
Business Score (outcome of the bottom-up research process)
For each GCP company a composite score is calculated through an interplay of the factors highlighted in the exhibit below. We call this the ‘Business Score’. Based on this Business Score, portfolio weights are assigned for the stock. A company getting a higher business score will have a higher weight in the portfolio.
Portfolio Management Tools – Torque (style framework) and Valuation Extremities
The top 13 stocks in the GCP portfolio contribute to over 75% of the total portfolio allocation. Hence, in keeping with Marcellus’ house style, GCP is a very concentrated portfolio of high quality stocks.
On top of the business score, Marcellus’s proprietary style framework (Torque) and valuation framework is used to determine the final weights of companies. The style framework (Torque) uses quant factors & macro indicators to generate signals for position size adjustments. The valuation framework uses valuation bands of companies to identify periods of extreme exuberance or pessimism on the stock to adjust position size.
Performance Analysis
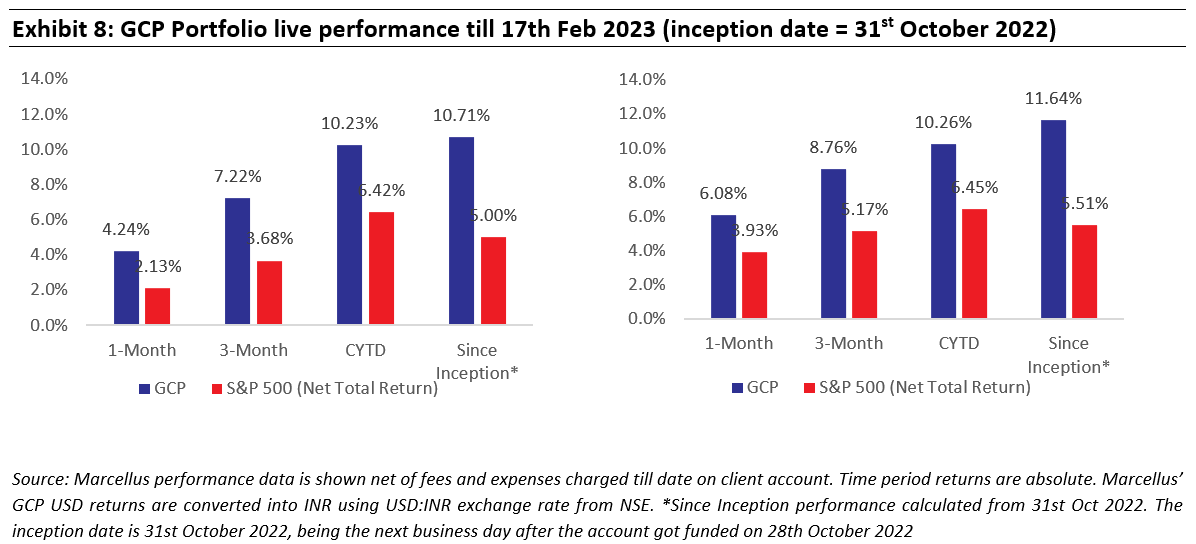
Live GCP portfolio performance since inception (31st October 2022)
GCP portfolio was launched on 31st October 2022 with the first few clients being employees of Marcellus. The exhibit below shows the performance of the live portfolio since inception.
Back-test analysis shows strong alpha over S&P 500 index
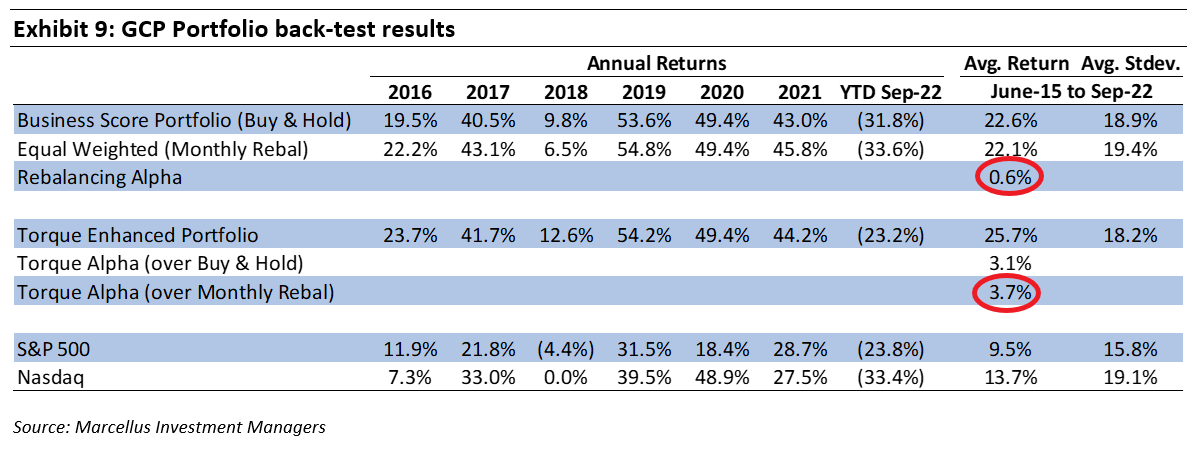
Back-testing of portfolio from June-15 to Sep-22 period gave the below results using the list of stocks from the current GCP portfolio:
- Both Equal Weighted (with monthly rebalancing) and Business Score (i.e. Buy & Hold) based portfolios have outperformed the S&P500 index and generated an alpha of by 8.5% and 9% respectively over the past seven years.
- The Torque enhanced portfolio created an additional alpha of 3.7% over Equal Weighted (Monthly Rebalancing) portfolio and alpha of 3.1% over Business Score (Buy & Hold) portfolio.