Marcellus’ Global Compounders Portfolio (GCP) invests in 25-30 deeply moated global companies listed mostly in developed countries and other global markets. These companies have dominant franchises which benefit from global economic megatrends and rational capital allocation by the management teams running these firms. These elements help the GCP companies drive an annual increase of approximately 20% (USD) in free cashflows per share. In this note we delve into the pivotal role of capital allocation as a cornerstone of our investment philosophy, underscored by pertinent examples, several of which are key components of the GCP portfolio.
Portfolio Fundamental Characteristics:
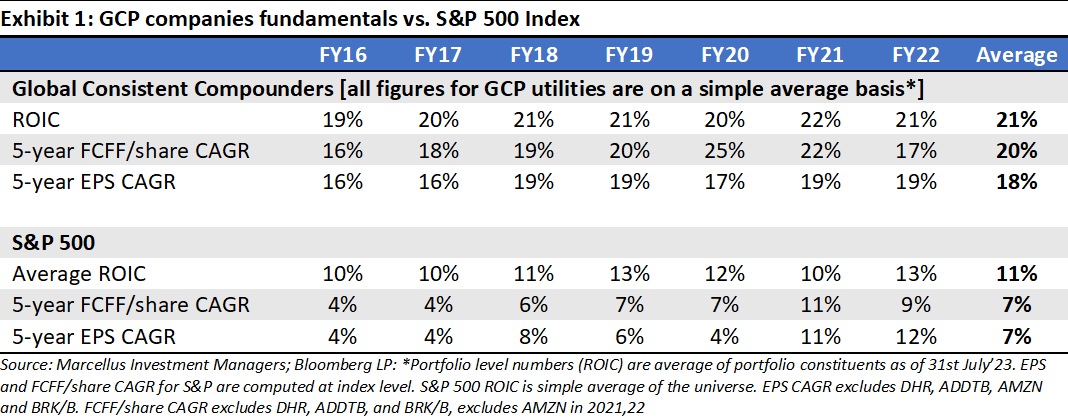
Investment in Marcellus’ GCP is through Separately Managed Accounts (i.e., SMAs, just like a PMS) via GIFT City (regulated by IFSCA) with a minimum investment amount of USD 150,000. Marcellus went live with GCP on 31st October 2022.
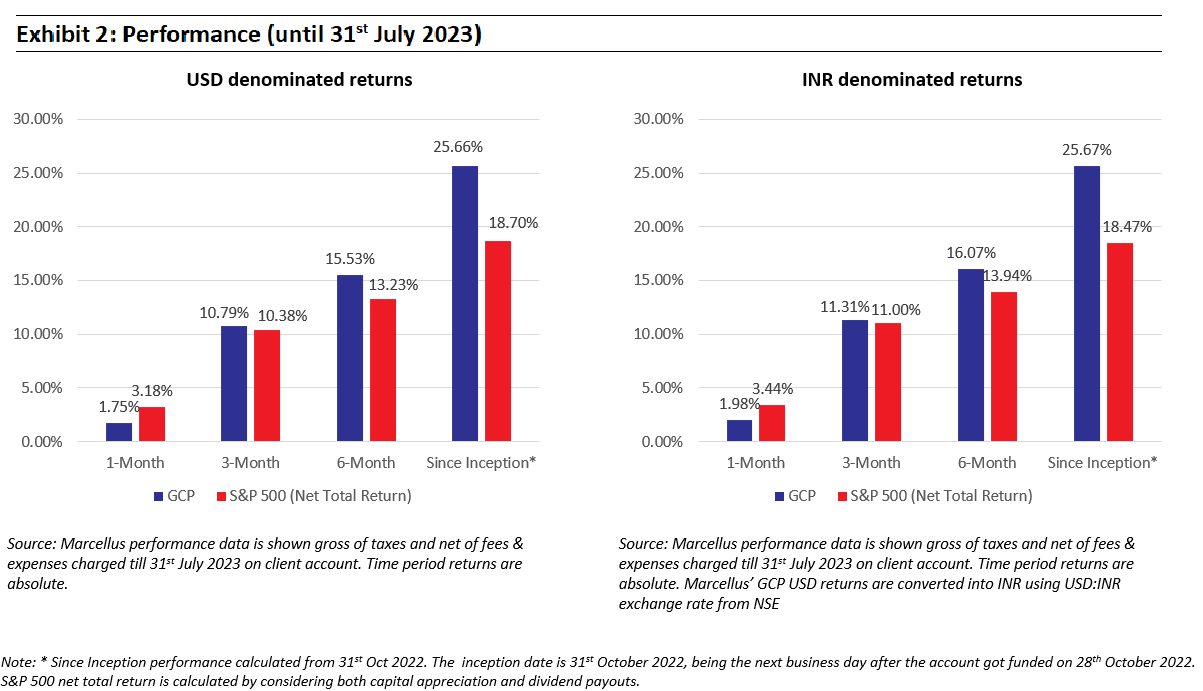
The GCP Introductory newsletter delves deeply into the conceptualization and construction of Marcellus’ GCP. This newsletter primarily focuses on our insights regarding efficient capital allocation, particularly spotlighting those adept at creating value through M&A activities. Notable examples of such capital allocators within the GCP portfolio encompass companies like Danaher, Constellation Software, Heico, and Amphenol, to name a few.
MS Dhoni: Masterful Capital and Resource Allocator
MS Dhoni’s leadership prowess is perhaps more remarkable than his cricketing excellence, even considering his status as one of the finest wicketkeeper-batsmen in cricket history. His extraordinary leadership shines brighter when analysing the unparalleled success of the Chennai Super Kings (CSK) in the Indian Premier League (IPL): 5-time champions, 10-time finalists, and 12-time playoff qualifiers out of 14 IPL participations. Notably, all IPL franchises started with equal resources (same wallet size or capital); yet Dhoni leveraged those resources ingeniously, optimizing them to yield unbelievably exceptional results. This success is remarkable, especially given that Dhoni rarely had the biggest stars of the game in his team, excluding himself.
Just as he maximizes his resources on the cricket field, adept corporate management teams allocate capital astutely. Dhoni’s resource allocation, focused on the performance of the 11 players in his team, mirrors the balancing act of three key aspects of cricket – batting, bowling, and fielding. Similarly, proficient management teams juggle four key areas: investing for growth, asset acquisition/divestment, dividends/buybacks, and debt repayment. Those who excel in this endeavour become legendary.
Significance of Capital Allocation
“Capital allocation is the CEO’s paramount responsibility.” – William Thorndike Jr in his bestselling book ‘The Outsiders’
It’s quite paradoxical that amidst the extensive literature on various business facets such as strategy and marketing, there exists a paucity of discourse on Capital Allocation, considering its paramount importance. While mega-mergers and ambitious target addressable markets (TAM) draw attention, the subtle yet potent prowess of capital allocation often remains overshadowed.
Wall Street’s relentless adoration for companies achieving 15-20% organic revenue growth, the resulting hyperinflation of valuations for these “beloved” and “well-known” stocks can disrupt shareholder value creation. This cycle is observable when “growth” stocks command exorbitant valuations (sometimes exceeding Price to Sales ratios of 25x), only to experience a sobering correction. This process invariably erodes shareholders’ hard-earned investments.
Interestingly, within this intricately “efficient” world, where instantaneous value discovery is presumed, certain enterprises have orchestrated a symphony of shareholder prosperity. They achieve impressive compounded annual growth rates (CAGR) significantly higher than the market (USD terms) over decades through exceptional capital allocation involving serial M&A, process excellence, and strategic share buybacks. Notably, these accomplishments transpired within industries exhibiting mid to high single-digit “predictable” growth rates – casually termed as “unexciting and boring”. Astonishingly, these gems have remained unnoticed by the valuation radar of the ostensibly “efficient” market for years, trading in line with market multiples.
This intriguing pattern caught our attention almost a decade ago as we started to delve into one of history’s most remarkable capital allocators: Danaher Corporation, a company also counted among GCP’s investments. Despite boasting an impressive track record of capital allocation and unmatched process excellence, propelling its EPS to compound at more than double the market’s rate, Danaher’s valuation multiples remained on par with those of the broader market (S&P) for an extended period. It wasn’t until 2016, with Danaher’s strategic spin-off of its slower-growing business, Fortive, that the company’s organic growth trajectory soared 200bps above the market average (before that it was in line with S&P’s organic growth). This underscores a noteworthy observation: the market tends not to reward outstanding capital allocation unless it has a substantial impact on a company’s organic growth outlook. When capital allocation decisions contribute to both strategic value and fundamental per-share compounding, it creates a market inefficiency that savvy shareholders can and should capitalize on. This dynamic naturally establishes a safety net for valuation.

Here, we endeavour to unveil the DNA underpinning their extraordinary value creation and elucidate how investors, like us and you, can harness market inefficiencies to forge substantial wealth.
Capital Allocation’s Growing Importance in a Slower-Growth Environment
The importance of effective capital allocation becomes even more pronounced in the context of global economic growth, which is gradually tapering due to profound demographic changes such as aging populations and diminishing birth rates on a global scale. Short of envisioning a reality where technological breakthroughs enable the creation of humans, the notion of achieving accelerated real GDP growth seems challenging. It’s noteworthy that this scenario doesn’t constitute our fundamental premise. Consequently, the pool of companies capable of consistently generating a compounded shareholder value significantly exceeding the market remains limited. Thriving under these circumstances necessitates the exceptional prowess of capital allocators who can achieve more with less – a “Dhoni”-esq task which few would be able to match!

Traditional DCF: Fails to Differentiate Between Exceptional and Subpar Capital Allocators
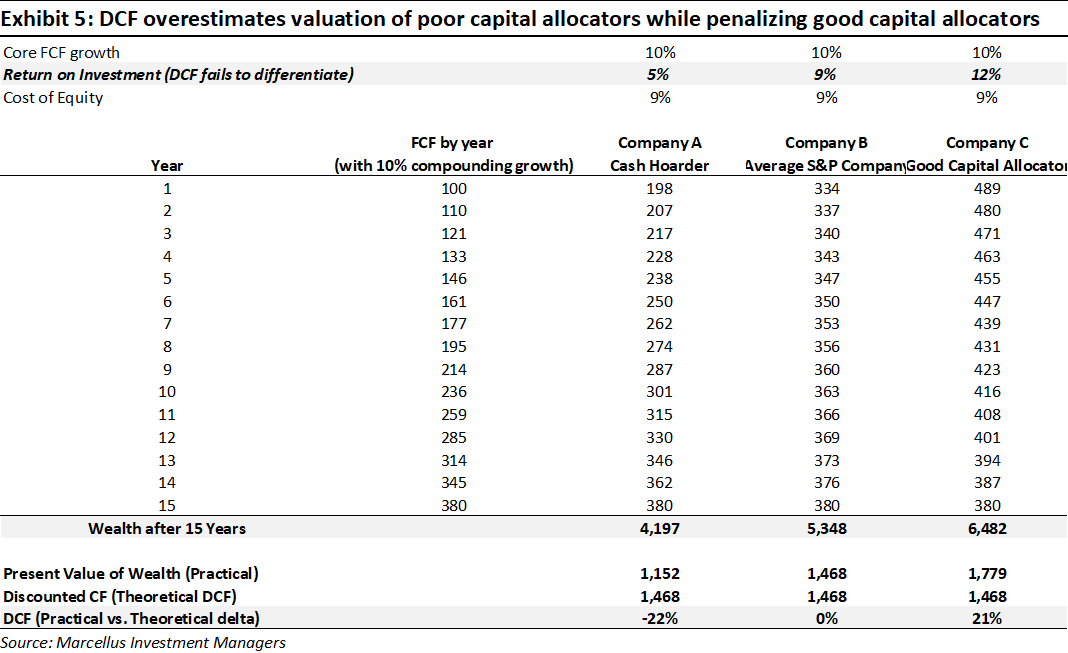
To delve deeper into this notion, let’s explore it further. As we’re aware, a Discounted Cash Flow (DCF) framework involves discounting future cash flows at a specified rate. For the sake of simplicity, let’s assume the company in question is debt-free. Therefore, the Cost of Capital equals the Cost of Equity, essentially representing the opportunity cost. For this illustration, we’ll consider a 9% Cost of Equity/Capital, equivalent to the long-term total return of the S&P 500.
When conducting a DCF analysis, our goal is to estimate the present value of future free cash flows (FCF) discounted at the Cost of Equity. The fundamental premise of DCF assumes that FCFs will be invested at the Cost of Equity. To illustrate, let’s contemplate the cumulative value of free cash flows in a future timeframe (say, 15 years from now). For instance, if a company generates $100 in free cash flow in Year 0 (the current year), its value in Year 15 would be $100 multiplied by (1 + Cost of Equity)^15, assuming the FCF is invested at the Cost of Equity. The subsequent year, if the company generates $110, its value in the 15th year would be $110 multiplied by (1 + Cost of Equity)^14, and so forth. This concept is reflected in Company B. However, this scenario inherently assumes that the company is distributing its entire FCF to shareholders – a premise implicit in DCF.
In actuality, this assumption often falls short. Companies frequently choose to retain cash on their balance sheets rather than distribute it to shareholders. These funds are commonly invested in low-yield money market instruments, generating returns (as low as 5% in the following example) considerably below the Cost of Equity. This practice gradually erodes value over time, as exemplified by Company A. However, the intricacies of this process elude a DCF analysis. Moreover, a skilled capital allocator might opt not to directly allocate funds to shareholders, instead preferring strategies like M&A or buybacks that hold the promise of higher returns (12% in the example below). A DCF analysis lacks the capacity to capture the excellence of such decision-making (Company C). All else being equal, envision a firm commencing with a $100 free cash flow, growing FCF at 10%, and having a 9% cost of equity. According to a 15-year DCF valuation, the firm would be valued at $1468. However, in reality, the company leaning toward hoarding cash (Company A) should be valued at a 22% discount, while a proficient capital allocator (Company C) should merit a 21% premium. Traditional DCF analysis is inadequate in encapsulating these nuances.
Prominent Japanese companies, often familiar to us, would have qualified as “Company A” in our framework. Over the years they have faced criticism for hoarding cash and subsequently eroding shareholder value. This cash-hoarding issue has significantly impacted Japanese firms, evident in their main stock markets yielding a mere <2% USD CAGR over the past 30 years.
GCP Companies: Steering Clear of Cash Hoarding
Within the GCP framework, we prioritize companies with robust and predictable cash flows. Equally important is the strategic utilization of these cash flows. Proficient capital allocators adeptly reinvest these funds, whether through organic means like capital expenditures (Internal), strategic inorganic approaches (External) such as acquisitions, or by returning capital to shareholders (External). Notably, debt repayment doesn’t take precedence among GCP companies, largely due to the favourable debt profile of our invested companies.
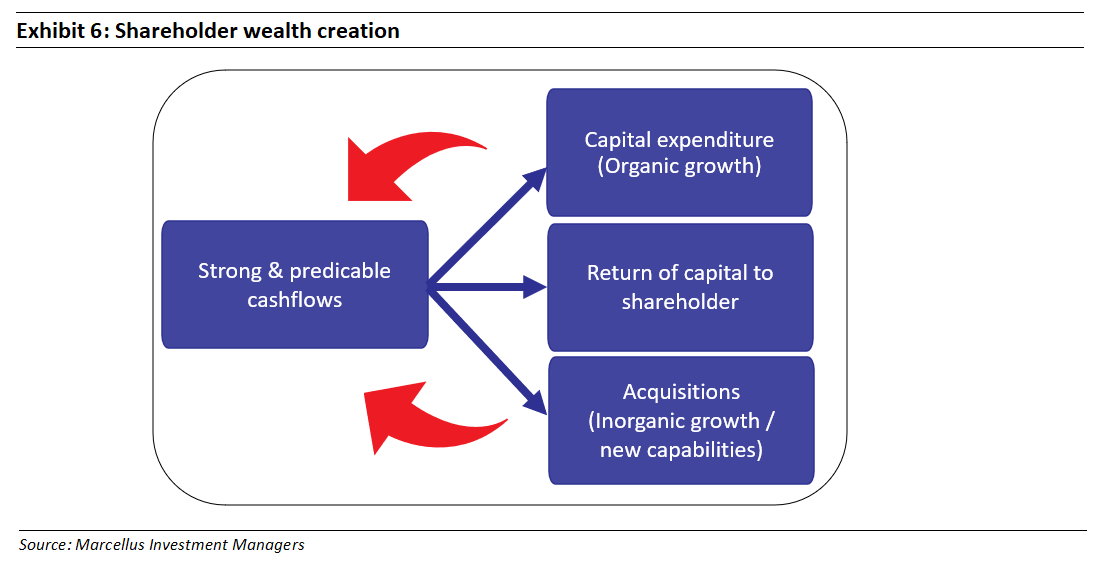
Interestingly, businesses that generate substantial value through external capital allocation share remarkably similar attributes, regardless of whether their value creation stems from capital returns (such as buybacks or dividends) or through M&A activities:
- Moderate Growth (Mid Single Digit+) Industry with high predictability: These businesses operate within industries characterized by moderate yet consistent growth, typically around the Mid-Single Digit (MSD) range. Such industries, with their steady but not rapid growth, tend to be less attractive for new capital inflow.
- Oligopolistic Pricing Power in a fragmented market: These entities secure a position among the top three competitors within a fragmented industry, without significant disparities in market share among them. This situation creates opportunities for industry consolidation, bolstered by their collective pricing influence.
- Limited structural risk: Businesses in this category mitigate substantial structural risks, ensuring the existence of a terminal value for their underlying operations.
- Asset Light: They adopt an asset-light approach, leaving a significant pool of capital available for deployment.
- Astute management team: With a clear focus on value-added services/products, these businesses aim to maximize shareholder value by strategically leveraging all the aforementioned attributes.
These shared characteristics form the bedrock of businesses that excel in external capital allocation, underpinning their ability to create substantial value irrespective of their chosen avenue – whether it’s capital returns or M&A activities.
External Capital Allocation: Buybacks
Marcellus’ GCP portfolio has invested in stocks that added significant value with buybacks (MSCI) – but to understand the real impact of buybacks and market’s inability to capture the arbitrage – let us briefly discuss into AutoZone, a company which we have a high respect for capital allocation.
Exemplifying Value Creation Through Buybacks: AutoZone’s Masterclass (Not in GCP – Yet!)
Originated from Malone & Hyde, Inc., led by J.R. Hyde, diversified into retail. Transitioned to specialized retail under Hyde’s leadership, expanding to various stores. Privatized in 1984 by Hyde and KKR, shifted focus to automotive parts. Rebranded as AutoZone in 1991, re-entered public markets, led by Pitt Hyde until 1997.
AutoZone Today:
- Operates 7,000+ stores across the US, Mexico, and Brazil.
- ~75% B2C (DIY customers), ~25% B2B (garages serving motor vehicle repairs).
- Notable personalized service model for DIY customers, leading to strong Net Promoter Score.
Checks all the boxes of a great capital allocator framework:
- Moderate Growth (Mid Single Digit+) Industry with high predictability: The auto aftermarket’s growth hovers around mid-single digits. Miles-driven and vehicle age are the key growth drivers—both slow-moving variables, ensuring high predictability.
- Oligopolistic Pricing Power in a fragmented market: AutoZone and its three largest competitors (O’Reilly, Advance Auto Parts, and Genuine Parts) collectively claim less than half of the domestic market. This share gain is a function of strong moats built around supply chain, customer service, private labels, and capital allocation. It can be expected from these 4 to continue to chip away at the remaining share over time.
- Limited structural risk due to focus on used cars, even amid potential EV challenges.
- Capital-light model, requiring only 20% of cash flow for internal capex.
- Astute Management Team, enhancing EPS growth through margin improvement, balance sheet optimization, and share repurchases. Share buyback contributed ~50% of the EPS growth.
The discourse regarding potential structural challenges wasn’t part of the narrative until a decade ago. Nevertheless, what’s truly striking is that most of the time in its ~25 years of trading history, AutoZone traded at a cheaper valuation than the market, even as it consistently achieved EPS compounding rates surpassing twice those of the S&P 500. This scenario truly questions the concept of an “Efficient Market”!

External Capital Allocation: Mergers and Acquisitions (M&A)
Mergers and acquisitions (M&As) represent one of the most widely recognized forms of capital allocation, with companies annually investing over $2 trillion in these ventures. However, a staggering 70% or more of M&As fall short of achieving their intended outcomes. To illustrate further, for every triumphant large-scale deal like Microsoft’s acquisition of LinkedIn (where Microsoft’s $26 billion investment catapulted LinkedIn’s revenue from $4 billion to $14 billion within five years), there are three deals that miss the mark in delivering their desired results. Those who recall the dotcom era’s apprehensions might remember the colossal $350 billion AOL and Time Warner merger that disastrously eroded most of the combined value over time. This debacle is only one example among a lengthy list of megamergers that tanked, including the likes of Sprint – Nextel and Microsoft-Nokia.
Nonetheless, as is often the case in investing, there are exceptions to the norm. While the spotlight frequently shines on high-profile acquisitions, a parallel realm of “programmatic acquirers” exists, operating as outliers to the standard narrative.
Programmatic Acquirers:
- These are high performing conglomerates exhibiting remarkable investment capabilities. They operate with decentralized structures and adhere to the characteristics we laid out above – Moderate Growth (Mid Single Digit+) Industry with high predictability, Oligopolistic Pricing Power in a fragmented market, Limited structural risk, Asset Light, Astute Management Team – allowing for both organic and inorganic growth through multiple small private investments. Importantly, they don’t engage in “transformative” acquisitions involving integrations and ambitious synergy goals in public markets.
- These companies function as vehicles for capital allocation, homing in on smaller-sized private businesses through a data-driven approach to acquisitions. They serve as a reinvestment engine, filling the void left by limited organic reinvestment opportunities. Essentially, they bridge the gap between top-level capital allocation and entrepreneurial autonomy within the group. This approach adds diversity, resilience, and scale, ultimately derisking the conglomerate’s overall foundation.
- A McKinsey report underscores this significance. The study highlights the importance of building organizational structures and best practices across all stages of the M&A process. The core lesson from the McKinsey study emphasizes the value of practice and frequency. Establishing a dedicated M&A function, codifying insights from past deals, and adopting a comprehensive transaction perspective can enable businesses to replicate the success of programmatic acquirers. This underscores the notion that success in M&A can be achieved similarly to sales, R&D, and other disciplines that drive outperformance.
A significant part of Marcellus’ GCP portfolio is invested in stocks that continues to add significant value through programmatic M&A. One of the most notable standouts in our view is Constellation Software.
Epitome of Decentralized Capital Allocation: Constellation Software
After obtaining his MBA from the University of Ontario, Mark Leonard, who had experience in Venture Capital (VC), observed a recurring pattern in the VC world. This pattern showcased an overemphasis on achieving extraordinary growth and targeting extensive addressable markets (TAMs). Companies not poised to serve a massive market or disrupt established incumbents found it challenging to secure VC funding. Recognizing that numerous fundamentally sound businesses existed that could not source funding, Leonard identified an opportunity to invest in such enterprises at the right price. He believed that pursuing these businesses could yield significant results, offering a compelling alternative to the TAM-focused VC landscape. His focus shifted toward an underserved sector with a promising business model: Vertical Market Software (VMS). Over nearly a decade in the VC realm, Leonard nurtured this idea, eventually leading to the creation of Constellation. The company went public in Canada in 2006, primarily to facilitate liquidity for VC investors, rather than raising capital.
Vertical Market Software (VMS): A Strategic Fit for Astute Capital Allocators
VMS specializes in crafting tailored, industry-specific software solutions that share the enticing attributes of Horizontal Market Software (HMS), except for one key aspect – an expansive Total Addressable Market. Unlike HMS products like Microsoft Office, which cater to a broad spectrum of industries, each VMS company targets a niche market. This unique positioning results in minimal competition within each vertical, creating an oligopolistic structure and substantial pricing power. With countless such niche verticals available (think of something like poultry management software for a specific region), Constellation operates across 100+ of these niches, presenting ample room for growth. Recurring revenue and high switching costs further bolster the industry’s appeal. The VMS Industry ticks all the boxes we prioritize in an industry:
- Moderate Growth (Mid Single Digit+) Industry with dependable recurring revenue streams
- Oligopolistic Pricing Power (within each niche) in an expansive yet fragmented market (with an unlimited number of niches)
- Limited structural risk, given the niche nature of Constellation’s businesses, making them less susceptible to disruption by larger software entities.
- Asset Light – requiring minimal investment for organic growth.
Mark Leonard’s construction of the fifth pillar of our framework, the Astute Management Team, has resulted in an organizational structure, including a well-crafted compensation system, that stands as its most formidable moat. Constellation Software exemplifies an extreme level of decentralization, boasting approximately 200 remarkably empowered Business Unit leaders. These leaders are steadfastly committed to delivering value to shareholders, strategically deploying free cash flow with high hurdle rates of 20%+ ROIC for smaller deals and 15-20% for larger ones, all while achieving an impressive organic growth rate of 5%+. This approach has yielded remarkable results: the company has executed around 900 acquisitions, all while maintaining a robust return. Despite its substantial size, Constellation’s organizational structure has enabled it to source smaller and higher value-accretive deals (with a median size consistently below $10 million – mostly unchanged in last 10 years despite market cap expanding 10x during this timeframe) and conduct more effective due diligence compared to its private equity counterparts. Most notably, throughout its illustrious history, Constellation Software has rarely traded significantly above the market multiple, underscoring its exceptional value proposition of growing EPS/FCF at >2x that of S&P 500s!

The opportunities such companies present:
“The best capital allocators are practical, opportunistic, and flexible. They are not bound by ideology or strategy.” – William Thorndike in ‘The Outsiders’
Despite the consistent and tangible growth achieved through buybacks and strategic acquisitions, the market often overlooks this trajectory due to prevailing uncertainty surrounding capital deployment. This uncertainty applies a uniform discount to both smaller, well-executed deals and larger, attention-grabbing ones.
At Marcellus, our commitment lies in delving deep into the intricate mechanics of capital deployment within these companies. Our rigorous process involves conducting due diligence comparable to that of private equity firms, entailing meticulous primary data checks for each individual company. This comprehensive approach unveils opportunities that often elude the broader market, thereby fortifying our portfolio with an additional layer of valuation safety.
The outcomes of astute “capital allocation” are nothing short of magical and well worth the effort invested. This aspiration, to achieve exceptional outcomes for ourselves and our valued investors, serves as our driving force.

