The terms ‘quantitative’, ‘systematic’, and ‘rules-based’ are often used interchangeably as representing an investment approach that is perceived to be in direct opposition to what a ‘fundamental’, ‘discretionary’ or ‘stock-picking’ approach may be. While both quantitative and discretionary strategies can pursue the same objective and both can be fundamentally oriented, quantitative strategies are different from their fundamental counterparts, in that they are better suited to exploit the breadth of investment opportunities. In this context we discuss how MeritorQ’s portfolio size and rebalance frequency allows investors to take advantage of this breadth while keeping portfolio turnover under control.
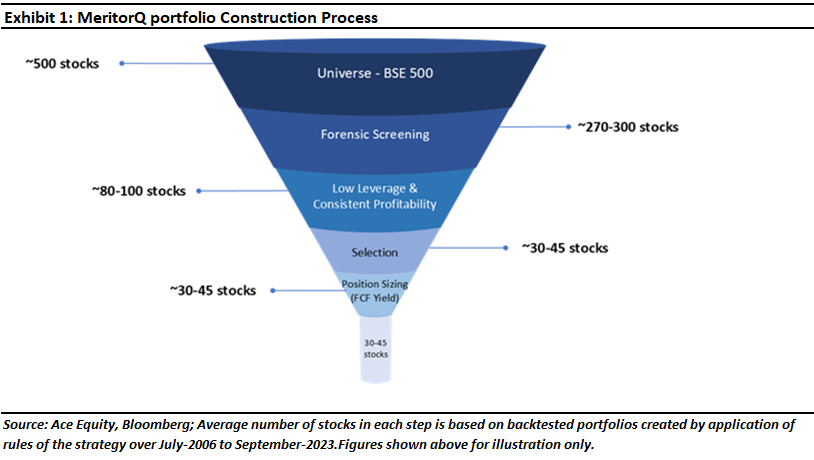
In the MeritorQ, we start with a wide selection universe consisting of stocks across large mid and small cap stocks, which would be equivalent to the BSE 500 or Nifty 500 universe We then weed out companies which we deem not having clean accounts according to Marcellus forensic accounting framework. Companies with high financial leverage and inconsistent profitability are also removed. As we have discussed before, the primary function of these screening steps is to avoid wealth destroying companies and reduce risk. After screening, we select 30-45 stocks which are on both profitable and undervalued at each rebalance. Finally, companies which are undervalued basis price to free cash flow, get a higher allocation in final portfolio. These steps illustrated in Exhibit 1.
Why a concentrated portfolio is not necessary for Quantitative strategies to work
Discretionary managers tend to spend considerable time learning about a handful of companies that they know well. They typically follow a ‘best ideas’ – “kicking the tires”- investment approach among this subset and tend to build concentrated portfolios.
In contrast, a systematic manager typically evaluates every stock in the investment universe, over hundreds of companies. A repeatable process enables much greater breadth: applying similar ideas across many stocks. This is an advantage if the ideas are repeatable and effective: applying a good idea to more investment opportunities can improve outcomes.
Consider a fund manager whose selected stocks’ “hit rate” (or the probability of an individual stock outperforming the market) is on an average 53% – better than a random coin toss. Portfolio ‘success rate’ is evaluated as the probability that more than half the stocks in the portfolio outperform.
Now, what if a concentrated manager picked fewer stocks with a higher level of skill, perhaps by studying fewer companies in greater detail? How good would that manager have to be to match the benefits of a systematic manager with a larger number of stock picks? Exhibit 2 shows the breakeven level of ‘skill’ or ‘hit rate’ required for a concentrated manager who picks only 10 stocks to match the overall portfolio success rate for the systematic manager who picks 30 or 100 stocks with a smaller 53% accuracy.
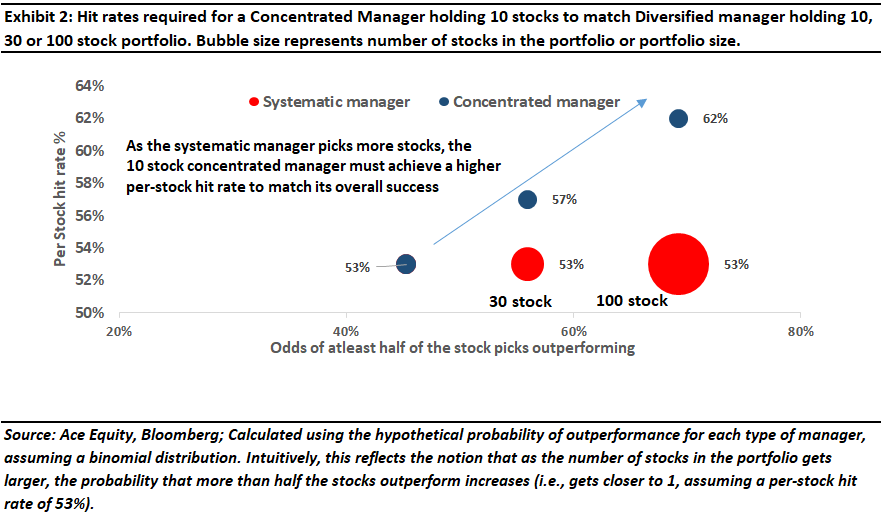
The 10-stock concentrated manager must be much more skilful, requiring a 62% per-stock hit rate to match the overall portfolio success of the diversified manager holding 100 stocks with 53% accuracy. While these conclusions are based on simplistic assumptions, the general point is that if the process of a systematic investor has an edge in stock selection, then it should select often to consistently succeed.
Because of data driven, repeatable process employed by quantitative strategies it is more efficient for them to increase breadth (or simply, the number) of investment opportunities. Hence a larger breadth – loosely translated to larger portfolio size and frequent rebalancing is an advantage for quantitative managers rather than a handicap, as long as returns can survive transaction costs from higher turnover (or churn) and stock picks are not highly correlated.
Having said this, discretionary managers have their own edges over quantitative peers, for example appropriately position sizing their high conviction ideas (i.e., knowing when they are right and wrong, and in both cases acting with conviction by running with winners and cutting losers) and the ability to also use non-quantifiable information, forward looking information, among others (so can identify stocks with higher probability of future outperformance versus systematic managers).
Concentration versus Diversification in MeritorQ
The investment universe in MeritorQ is restricted to the top 500 stocks in India (equivalent to Nifty 500 or BSE 500 index) as trading liquidity drops rapidly beyond the largest 200-250 names. As discussed in previous newsletters, the screening steps are essential to avoid investing in wealth-destroyers (these would be stocks with very low hit-rates or likelihood of future outperformance as discussed in the previous section). In MeritorQ, we are left with ~80-90 companies on an average after the screening steps. The selection step, in which we select profitable, undervalued stocks furthers tilt the odds of outperformance.
Whilst MeritorQ’s checklist of investment rules filters the investment universe to a set of stocks with best odds of future performance, the portfolio size (30-45 stocks) and semi-annual rebalancing frequency allows investors to benefit from breadth of investment opportunities keeping turnover under control. Also, note that, selecting more than 40 stocks would mean including stocks whose profitability and valuation is inferior compared to the average stock in the post-screened universe, hence diluting the efficacy of the selection step (as post screened universe has only ~80-90 companies on an average).
Exhibit 3 compares the 3-year rolling returns, risk adjusted returns, and average turnover of the strategy. Clearly, a portfolio of around 30-40 stocks (which selects ~40% of stocks available from post-screened universe) on an average achieves the best trade-off between risk adjusted returns and turnover.
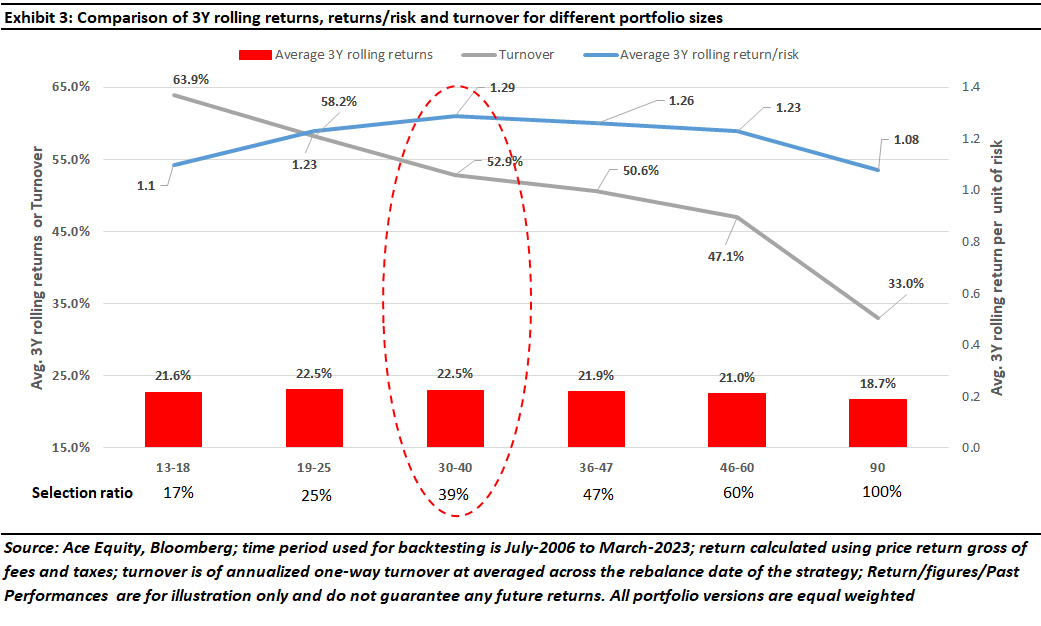
Exhibit 4 shows the average and maximum allocation to any single stock across the backtest. Note that these are allocations based on position sizing based on relative price to free cash flow ratio (that is, more undervalued stocks get higher allocation).
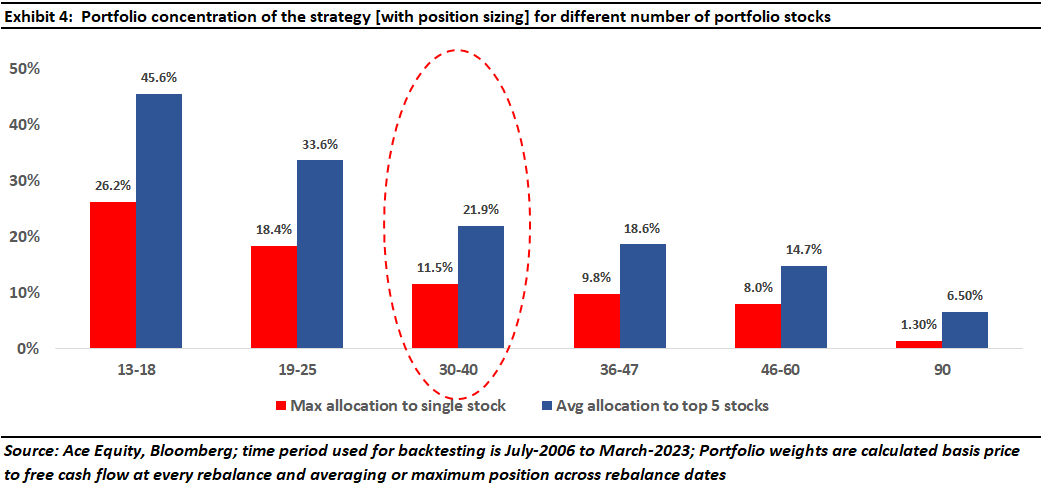
Unsurprisingly, smaller portfolio sizes lead to more concentrated portfolio. Given that the strategy is semi-annually rebalanced with no intervention between the rebalance dates, it is important to manage the risk of drawdowns from large portfolio positions in the six-month interval between successive portfolio rebalancings.
Portfolio size between 30-45 stocks in MeritorQ helps in managing this drawdown risk by keeping portfolio concentration within manageable levels. As exhibit 4 shows, we have not seen allocations exceed 12% in any single stock and 22% on an average in the top 5 positions over backtested strategy history spanning from July-2006 to March-2023.
To invest in MeritorQ through Smallcase, please visit MeritorQ Advisory – Marcellus
If you would like to know more about MeritorQ, please write to help.ia@marcellus.in
* The securities quoted are for illustration only and are not recommendatory

