
Marcellus’ Global Compounders Portfolio (GCP) strategically invests in 20-30 deeply moated global companies aligned with megatrends, fostering a consistent mid to high teens compounding of free cash flow/earnings.
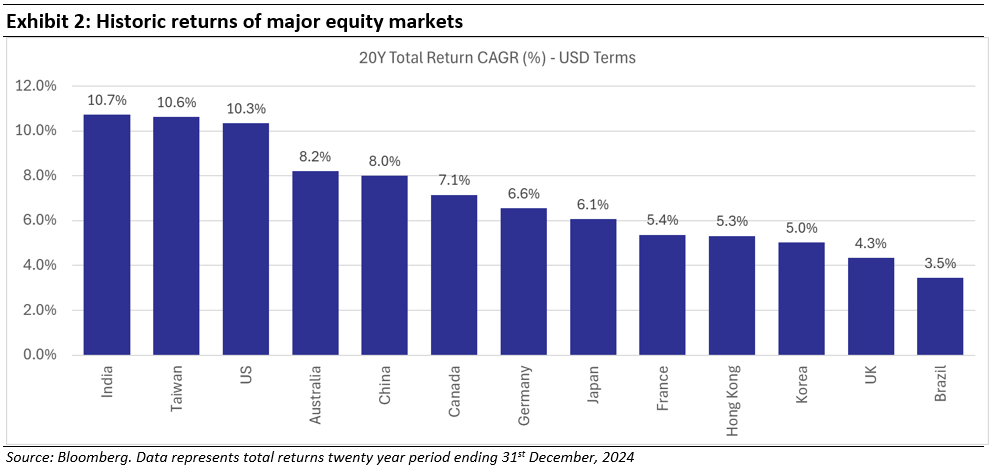
The US market has a track record of strong, earnings led returns despite modest GDP growth. This places it among the top performing markets globally over a 10 & 20 year period with returns comparable to India. Despite this, correlation between the two markets is relatively low. The combination of high returns and low correlation between the two markets means that Indian investors may significantly reduce their risk without sacrificing returns. Effectively, diversification would provide a free lunch for such investors.
Portfolio Fundamental Characteristics:
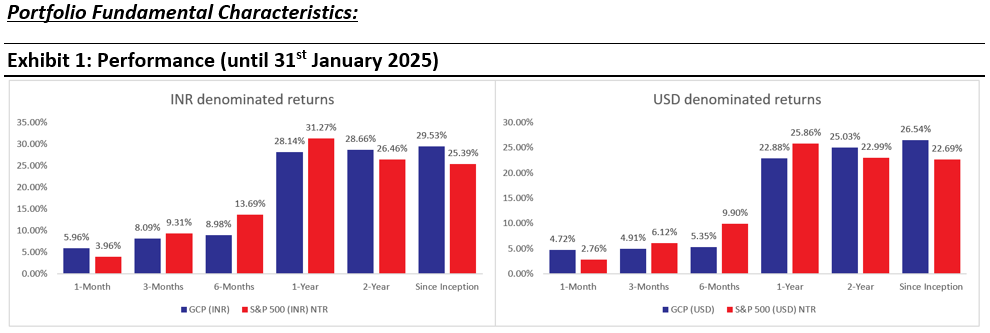
Marcellus performance data is shown gross of taxes and net of fees and expenses charged until 31st Jan 2025. Performance fees are charged annually in December. Returns for periods longer than one year are annualized. Marcellus’ GCP USD returns are converted into INR using exchange rate published by RBI. Source: https://www.rbi.org.in/scripts/ReferenceRateArchive.aspx
Source: Marcellus Investment Managers Note: * Since Inception performance calculated from 31st Oct 2022. The inception date is 31st October 2022, being the next business day after the account got funded on 28th October 2022. S&P 500 net total return is calculated by considering both capital appreciation and dividend payouts. The calculation or presentation of performance results in this publication has NOT been approved or reviewed by the IFSCA or US SEC. Performance is the combined performance of RI and NRI strategies.
Permissible Accredited Investors* can now invest in GCP Strategy with minimum ticket size USD 25,000. For non-accredited investors, Investment in Marcellus’ GCP is through Separately Managed Accounts (i.e., SMAs, just like a PMS) via GIFT City (regulated by IFSCA) with a minimum investment amount of USD 75,000.
*Accredited Investors shall qualify eligible criteria as defined under IFSCA-IF-10PR/1/2023-Capital Markets dated January 25, 2024. This circulation is not intended for US clients.
US market returns are de-linked to American GDP growth
The US has been among the best performing equity markets over the past three decades. This is despite the fact that the US is a mature, developed economy. Experience elsewhere in the world (for example, UK and the EU) suggests that this maturity is associated with weaker equity returns. The performance of US equity markets is therefore an outlier and not the rule. We have explored some of the drivers behind this dynamism in an earlier newsletter published on May 9th, 2024: (The Four Pillars of American Capitalism).
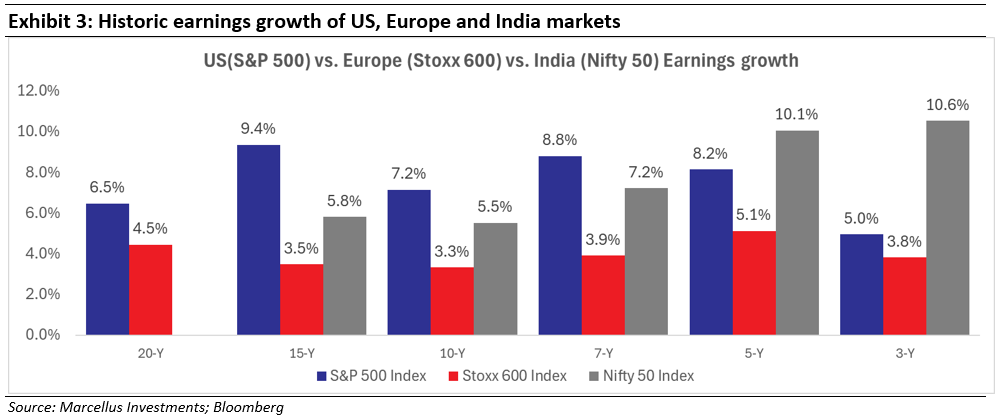
America’s equity market performance is backed by fundamental factors, reflecting in superior American earnings growth. This earnings growth has been significantly superior to other developed markets and comparable to that of the Indian market (on a currency adjusted basis).
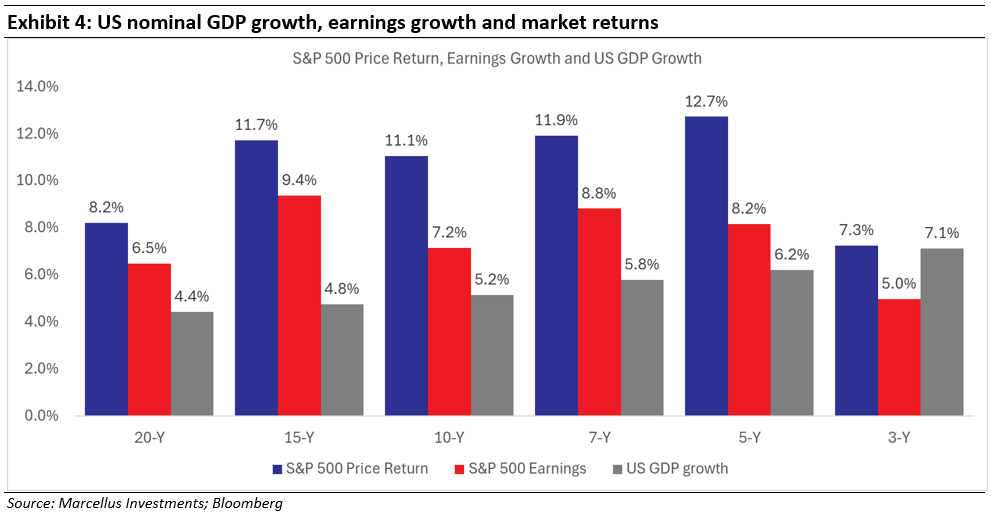
What’s really interesting is that this strength in American earnings growth is significantly higher than American GDP growth. Historic data shows that share price returns are driven by earnings, and not by GDP. Total return for the market for the US market is even higher (than share price returns) due to steady, strong dividend payments. This disconnect between earnings growth and GDP growth is unique to America with other countries often seeing close ties between the two.
Low correlation between US and India markets
As you can see in exhibit 2, India ranks alongside the US when it comes to returns in recent decades. While returns in rupee terms would be higher still, this is offset by rupee depreciation when comparing in dollar terms. On the face of it, this similarity in returns would suggest that there is little benefit from owning both India and the US. However, a look at correlation between the two markets suggests something different. This correlation is relatively low with five year rolling correlations generally in the 40-70% band.
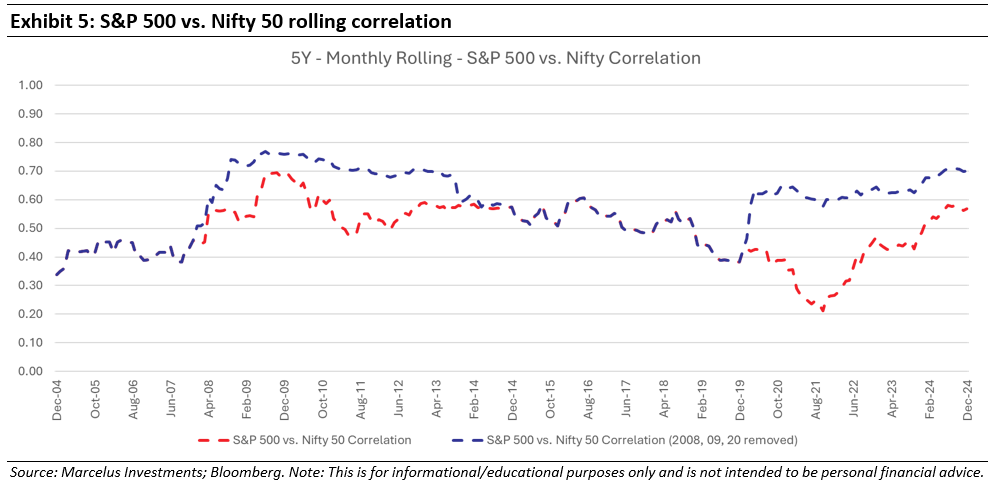
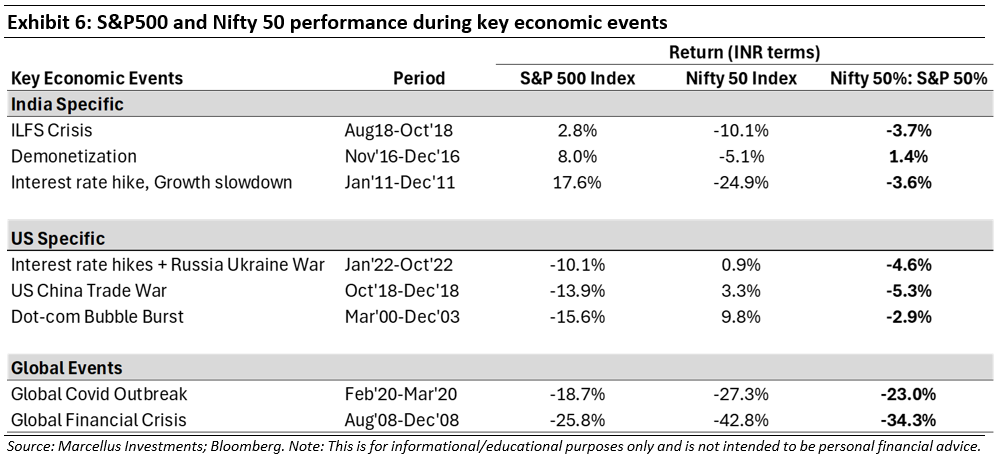
In practical terms, this low correlation shows up as differing market behaviour in different periods. While a global crisis like Covid hurt both markets, India tends to do worse in such periods (with India’s underperformance being compounded by rupee depreciation). More importantly, the periods of volatility unique to each market (for example, the IL&FS crisis in 2018 or the US rate hike cycle in 2022) – India and America – significantly increase in divergence in performance. In such periods, the benefits of diversification are clearly visible.
Diversification leads to lower volatility resulting in better returns
This combination of similar long term returns and low correlation is unique to the India-US combination of markets. While Indian investors can find low correlation with a range of other markets (e.g. Europe and China), the US is the only overseas market with sufficient depth and similar returns to India.
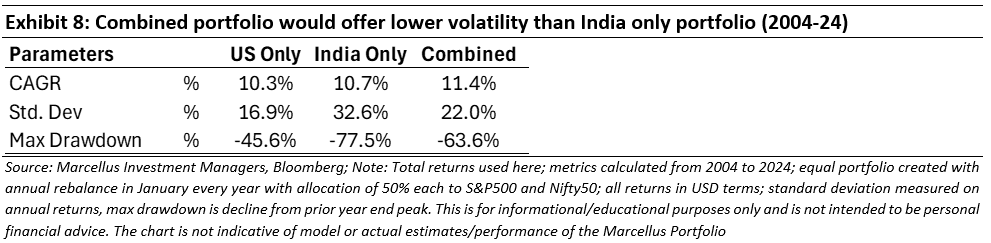
A portfolio combining the two markets (as represented by the S&P 500 and Nifty 50) would demonstrate the benefits of diversification clearly. Assuming an annual rebalancing cycle, such a portfolio would have higher returns than an India only market as it would effectively force allocation into the market going through a period of weakness. Such a portfolio would also have lower volatility than a pure India portfolio.
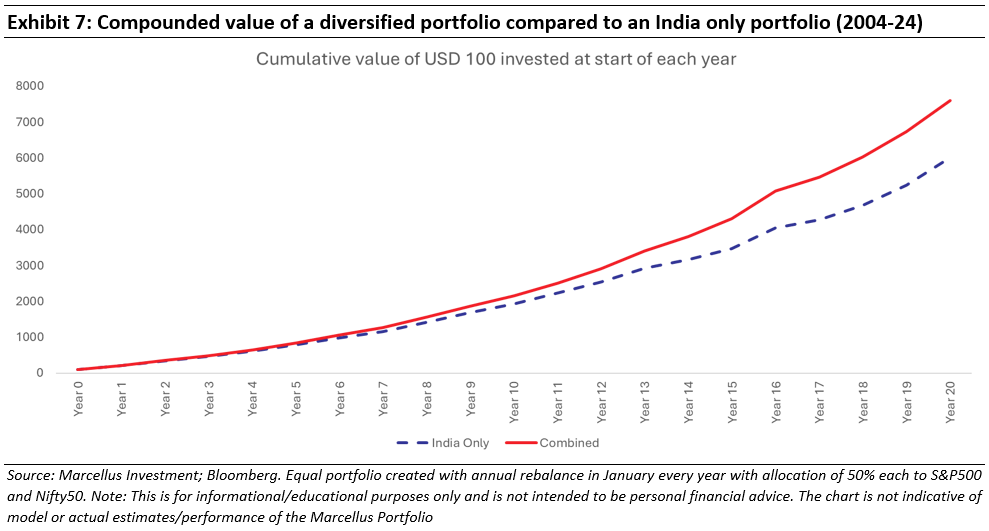
Historical data shows global diversification can help investors achieve better returns over over long-term periods. However over short-term period there is a possibility that India market could outperform diversified portfolio.
The GCP approach
The Marcellus Global Compounders Portfolio has holdings in 20-30 high quality companies, listed in the US, Developed Europe or Canada markets. Given the focus on growth and longevity, the portfolio naturally gravitates towards US listed companies (over 80% of the portfolio), complemented by high quality compounders from Europe (eg Hermes) and Canada (eg Constellation Software). Since inception, the portfolio has delivered returns superior to the S&P 500 Net Total Return Index. At the same time, the correlation with the NIFTY for weekly returns stands at 40%. This suggests that GCP may offer significant diversification benefits for Indian investors.
Regards
Team Marcellus
If you want to read our other published material, please visit https://marcellus.in/

