Marcellus’ CCP Portfolio has delivered 17.8% EPS CAGR over FY19-24 (computed using reported earnings of annual rolling portfolio cohorts), which is the primary driver of the portfolio’s 17.4% (pre-fees) portfolio performance over FY19-24 (15.35% net of fees and expenses). The changes made to the portfolio over time have enhanced its earnings profile. Additionally, in early 2022, had we reduced positions in Dr. Lal, Asian Paints and Bajaj Finance by half on a timely basis, CCP’s (pre-fees returns) would have been 80-100bps higher since inception. Through this journey, there have been several learnings that have been implemented around widening of portfolio coverage to identify ‘enterprising compounders’, thereby enhancing the portfolio’s earnings growth, and avoid valuation risks. With the portfolio continuing to report healthy profit growth in 9MFY25 despite a weak macro environment and given our expectations of healthy EPS growth for the portfolio over the next 3-5 years, we expect the recent drawdown to be a temporary phenomenon.
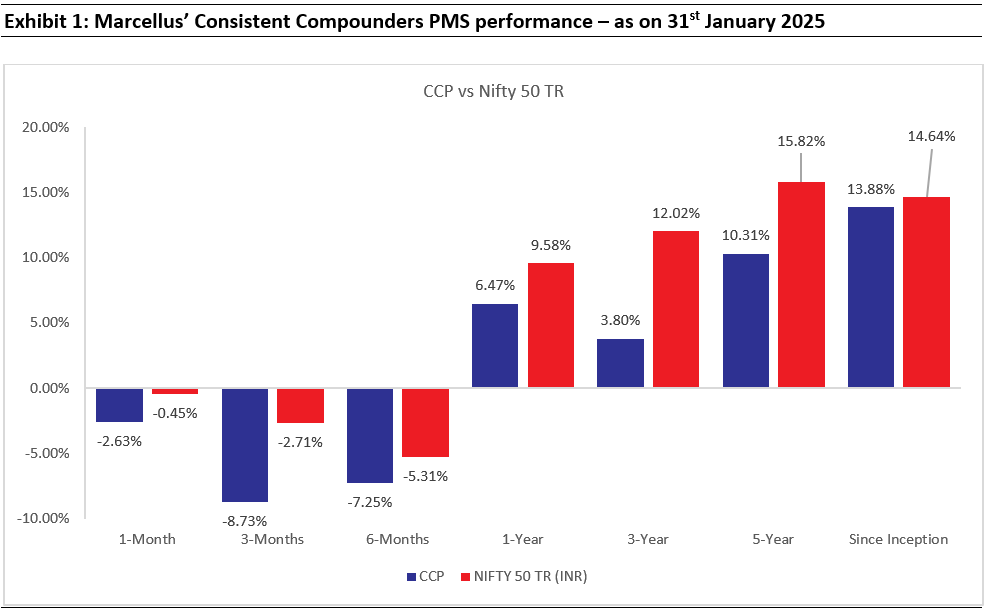
Source: Marcellus Investment Managers; Marcellus Performance Data shown is net of fixed fees and expenses charged till 30th Sept 2024 and is net of Performance fees charged for client accounts, whose account anniversary / performance calculation date falls upto the last date of this performance period; since inception & 3 years returns are annualized; other time period returns are absolute. For relative performance of particular Investment Approach to other Portfolio Managers within the selected strategy, please refer https://www.apmiindia.org/apmi/welcomeiaperformance.htm?action=PMSmenu, Under PMS Provider Name please select Marcellus Investment Managers Private Limited and select your Investment Approach Name for viewing the stated disclosure. The calculation or presentation of performance results in this publication has NOT been approved or reviewed by the SEC, SEBI or any other regulatory authority.
CCP portfolio has delivered EPS growth of 18% CAGR over FY19-24
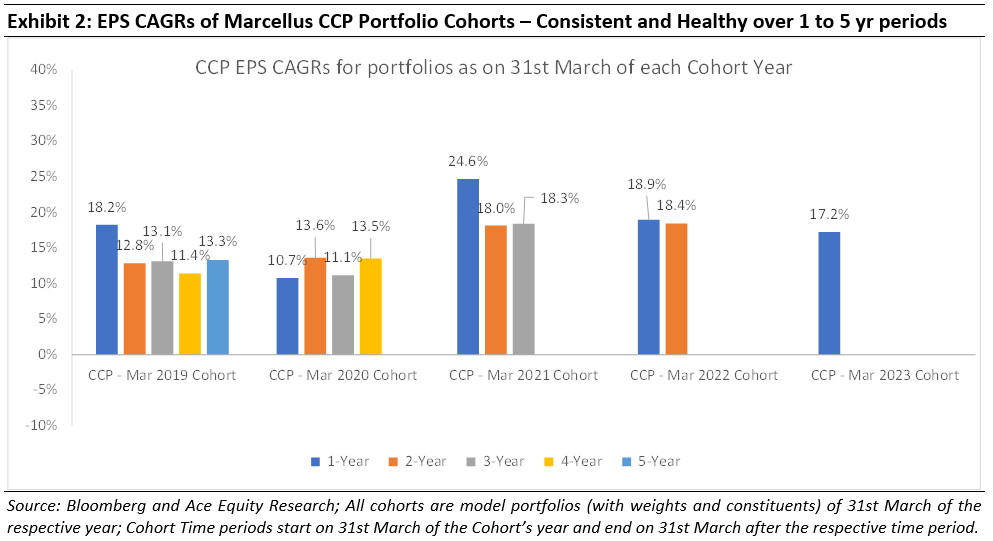
In a low churn, concentrated portfolio, with long holding periods, earnings are the predominant source of performance contribution over the long term. The other factor – the one that most investors obsess about – P/E multiple change, is a more meaningful contributor over the short term but a relatively small contributor over the longer term (because in the long term P/E multiples mean revert).
The chart above shows CCP Portfolio constituents’ earnings growth on two dimensions:
- Each ‘Cohort’ represents the portfolio allocations as on 31st March of that year
- Time period (1 year or 2 year or 3 year) related colour codes represents the future reported EPS CAGR of the respective Cohort over time, starting with the date of formation of the Cohort. These EPS CAGR are weighted by the portfolio allocations as on the start date of the respective Cohorts. So, for example, for the ‘CCP – March 2019 Cohort’, the 1-year EPS growth pertains to growth in FY20 whereas the 3-year EPS growth for that cohort is from FY19-22
Some observations/questions related to the CCP EPS CAGR chart above:
- 17.8% is the EPS CAGR over FY19-24, of a 12-month sequential roll of the portfolio (i.e. a combination of 18.2% for Cohort 2019, 10.7% for Cohort 2020, 24.6% for Cohort 2021, 18.9% for Cohort 2022 and 17.2% for Cohort 2023).
- FY19-24 EPS CAGR of 17.8% is similar to the portfolio performance (pre-fees and expenses) of 17.4%: Marcellus CCP’s five-year portfolio performance CAGR until 31st March 2024 was 15.35% net of fees and expenses. Adding back fees and expenses, this performance was 17.4% CAGR – not dissimilar from the EPS CAGR of 17.8% over the same period.
- Changes to the portfolio have helped enhance the EPS CAGR of the portfolio: The 2019 and 2020 Cohorts had weak earnings growth rates from FY20 onwards (as you can see in the chart above). This changed from the 2021 cohort onwards. Specifically, the 2021, 2022 and 2023 Cohorts have demonstrated strong earnings growth (as you can see in the chart above). For instance, had we left the 2019 or 2020 Cohorts unchanged, the subsequent EPS CAGR of the portfolio constituents would have been around 11%-13% instead of the 17.8% highlighted in the preceding bullet point.
- Nifty50’s EPS CAGR has been 16.4% over FY19-24, and 24.3% CAGR over FY21-24 – a run rate higher than long-term averages due to tailwinds for cyclical sectors such as commodities and government capex oriented industries. This has driven Nifty50’s benchmark performance of 13.9% over FY19-24 and 15.0% over FY21-24.
Could we have done better than 17.8% EPS CAGR over FY19-24?
Yes. Quoting from our July 2024 newsletter – “ As highlighted in our blogs over the past year, the nature of the Indian economy has changed post-Covid. A combination of superior physical and digital infrastructure, the benefits of economic integration in the wake of GST and a structural drop of the cost of capital (as 100mn+ Indian families shifted their savings from physical to financial assets) resulted in two different effects kicking-in: (a) smaller companies started pushing aggressively into the territory hitherto dominated by larger players eg. Astral Poly entering the paints industry; and (b) well-managed large companies realised that it is time to spread their wings and enter new industries…As we saw these changes take place in the Indian economy, we realised that by increasing allocation to ‘Enterprising Compounders’, CCP could benefit from the shape-shifting of the Indian economy.”
We realized this about 12-18 months later than we could have. These enterprising compounders have had, and are likely to have, higher growth rates compared to the ‘linear compounders’ (i.e. companies focused towards driving growth only in the core business) that we used to invest in prior to Covid. However, having made the corresponding changes to our portfolio constituents over the past 12 months, we are well positioned to benefit from the accelerated growth rates of ‘enterprising compounders’.
Could our portfolio performance (pre-fees) have exceeded the EPS CAGR by a reasonable margin?
Yes. Besides earnings growth, the other important short-term factor contributing to the share price performance of a stock is changes in its valuation multiple (P = P/E * E). There are a few learnings around valuation changes which we could have incorporated sooner than we did e.g. de-rating of quality lenders over the last 3 years as their ROEs moderated amidst changes in the regulatory environment (discussed in our 14th Dec 2024 KCP newsletter) and the risk of an unwind of peak valuations of quality businesses in general from their 2021 highs. In particular, with the benefit of hindsight, there are three instances where if we had taken profits sooner, we could have reduced the NAV drawdown in CCP over 1st Jan 2022 to 31st March 2023 from 14% to 10-11% (i.e. 300-400bps better performance over the 15 month period), and hence added 80-100bps to the CCP’s since-inception gross returns. These three instances are:
· Dr. Lal Pathlabs – had we cut our position by half on 1st Jan 2022, we would have avoided the 52% drawdown over the next 15 months on an 8% allocation in our portfolio
· Asian Paints – had we cut our position by half on 1st Jan 2022, we would have avoided the 18% drawdown over the next 15 months as the largest allocation in our portfolio
· Bajaj Finance – had we cut our position by half on 1st Jan 2022, we would have avoided the 19% drawdown over the next 15 months as the second largest allocation in our portfolio
Churn in FY25 – have these changes helped further enhance the portfolio’s expected EPS CAGR? Have they made the portfolio more volatile in the short term?
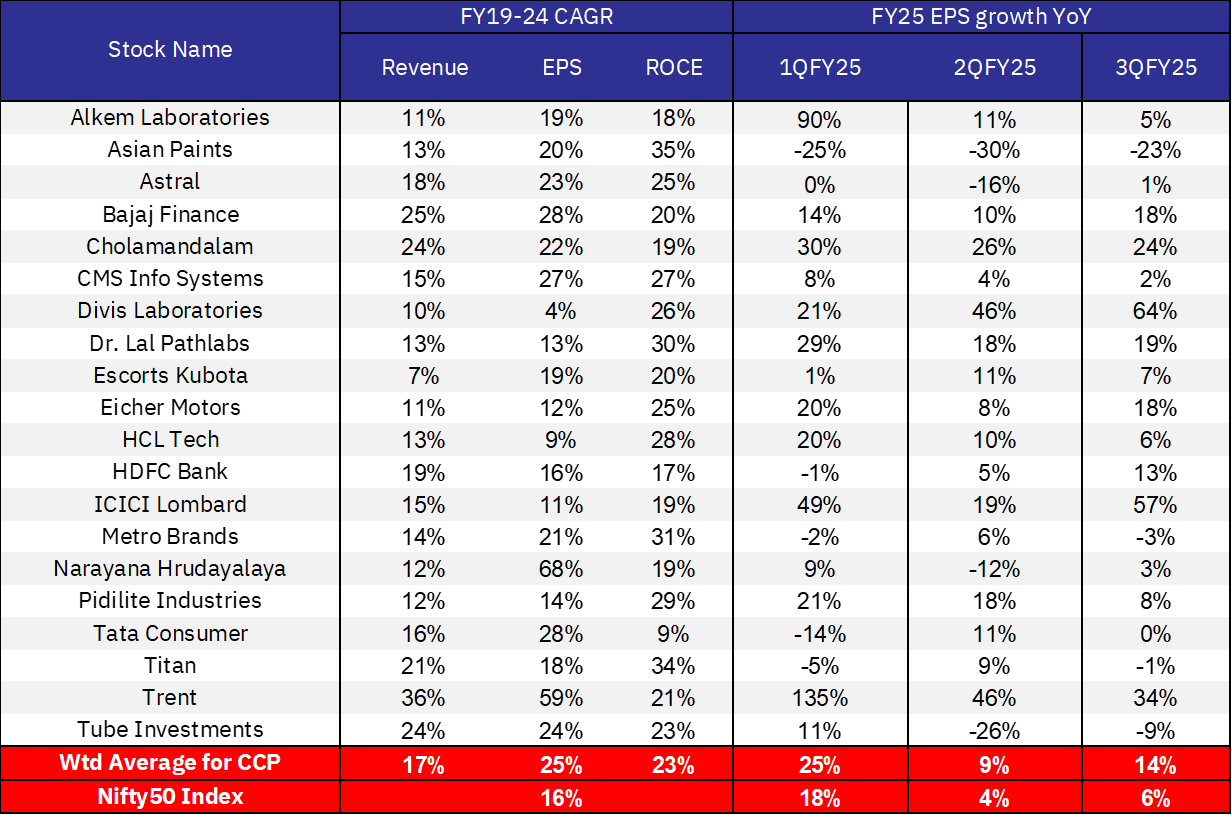
Yes. As highlighted previously, expected earnings growth of ‘enterprising compounders’ which have entered the portfolio is higher than the expected earnings growth of linear compounders which have been exited from the portfolio. This is mainly due to the high reinvestment rates of the ‘enterprising compounders which are focused on the addition of new growth drivers whilst also driving growth in their core businesses. The table below highlights how the EPS growth of our current portfolio has been in FY25 so far – healthy and consistent despite a weak external macro environment (reflected in the Nifty50’s weak EPS growth during FY25). Whilst portfolio performance was tracking this earnings growth till Sept 2024, we expect the drawdown of the last three months to be temporary in nature with prospects of reversal in future. Given the non-linearity in the profit growth expectations of the ‘enterprising compounders’ compared to the ‘linear compounders’, we have witnessed greater volatility in the stock prices of these companies over the past 3 months.
Is Nifty50’s EPS CAGR over FY19-24 and the index’s performance over this period sustainable over the long term?
Unlikely. With India’s nominal GDP growth rate hovering around the 10-12% mark, fundamentals of the broader stock market (and hence of the Nifty50 Index as a benchmark) are not likely to be more than 2-3% points higher than the economic growth rate. Hence, after delivering an EPS CAGR of 24.3% over FY21-24, we expect mean reversion for the Nifty50’s EPS growth in future. We continue to remain quality oriented and absolute return oriented – hence we will continue to avoid exposures to certain sectors which don’t meet our stock selection criteria, even if they are a meaningful part of the broader benchmark indices and/or might generate healthy share price returns in the short term for the index.
Regards
Team Marcellus
If you want to read our other published material, please visit https://marcellus.in/
The mentioned stocks form part of Marcellus portfolio thus Marcellus clients, Marcellus employees and their immediate relatives may have interest in. The described stocks are for illustration & education purpose only and not recommendatory.

