In Little Champs’ third anniversary newsletter, we dissect the portfolio’s performance and the key drivers thereof. On the whole, our stock selection – including the calls on exits and fresh additions – appear to have been on the mark. However, there are important learnings over the last three years around: (1) more robust evaluation of the portfolio companies’ bargaining power in the value chain (drawing from our auto ancillary holdings’ experience); (2) giving due regard to potential disruptions (something we underestimated in case of Music Broadcast); and (3) sticking to our philosophy of investing in market leaders (deviating from this in case of DCB Bank did not work out). The culmination of these learnings resulted in the creation of Marcellus’ longevity framework which has given us important tools to plug the above loopholes.
Performance update for the Little Champs Portfolio
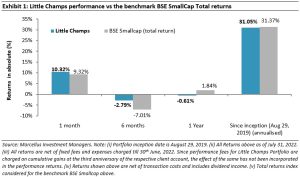
At Marcellus, the key objective of our Little Champs PMS is to own a portfolio of about 15-20 sector leading franchises with a track record of prudent capital allocation, clean accounts & corporate governance and at the same time healthy growth potential. While we intend to fill our portfolio with companies having the above attributes, we want to stay away from names where we are not convinced about the cleanliness of accounts or the integrity of the promoters (even though the business potential may sound promising) as the fruits of company’s performance may not get shared with minority shareholders. We intend to keep the portfolio churn low (not more than 25-30% per annum) to reap the benefits of compounding as well as minimize trading costs. The Little Champs Portfolio went live on August 29, 2019. The performance so far is shown in the below table.
Dissecting the portfolio performance
The Little Champs portfolio was launched three years ago on 29 August 2019. Over the course of the last three years, we have discussed extensively the investment philosophy and fundamentals of the portfolio/portfolio stocks through our monthly newsletters, periodic webinars etc. In this third anniversary newsletter, we focus on dissecting the portfolio’s performance and highlighting the key learnings from our experience of managing the portfolio over the last three years.
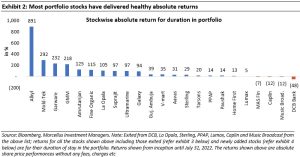
- Stock-wise performance:The chart below shows the absolute share price performance of the portfolio stocks for their duration of stay in the portfolio. As can be seen in the below exhibit there has been substantial contribution to overall portfolio returns from some of the stocks like Alkyl Amines, Mold-Tek Packaging, Garware Technical Fibres and GMM Pfaudler. A few stocks like Home First, Tarsons, Gujarat Ambuja have been relatively recent entrants in the portfolio and absolute share price performance shown in the below exhibit for these stocks should be viewed in the context of their relatively shorter duration in the portfolio (as mentioned in the note below the returns shown below are since their entry into the portfolio). On the other hand, there have been a few misses like DCB Bank, Music Broadcast, Caplin Point and MAS Financial. Except for MAS Financial, we have exited all the other three stocks over the last three years.
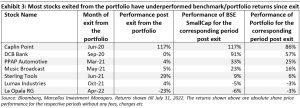
- Contribution to returns from portfolio additions/exits: The portfolio allocation towards equity (as opposed to cash) reached 90%+ levels in February 2020 with 14 stocks. Since then, there have been a total of seven exits from the portfolio and nine additions to the portfolio (rationales for additions and exits from the portfolio have been explained in our monthly newsletters over the past three years). Currently there are 16 stocks in the portfolio.
Of the seven stocks exited, four stocks have since underperformed both the portfolio returns as well as the benchmark BSE Smallcap since the exit thus suggesting that generally the SELL decisions have contributed positively to the portfolio returns.
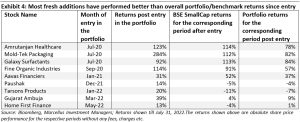
Similarly, as shown in below exhibit, most of the new additions have delivered better than overall portfolio returns as well as benchmark BSE Smallcap returns since their entry in the portfolio indicating the decision to BUY these stocks has helped enhance portfolio returns.
Key learnings from last three years of managing the Little Champs portfolio
As shown in the preceding exhibits, the portfolio churn as far as exits and additions are concerned appears to have contributed positively to the portfolio returns. However, what is not captured in the above exhibits is the additional returns that could have been generated had: (1) we not invested in the stocks that we exited; and (2) we made the fresh additions to the portfolio earlier than they we actually did.
Some of the learnings/lessons from our exits are highlighted below:
- Importance of assessing a company’s bargaining power in industry ecosystem (i.e. with suppliers and customers) as much as advantages over peers: As can be seen in exhibit 3 above, there has been a spate of exits from the auto ancillary names (Sterling Tools, PPAP, Lumax Industries) over the last couple of years. All the auto ancillary companies in the portfolio have been market leaders in their respective product segments for long periods of time with well entrenched competitive advantages over peers. However, for these companies in hindsight we overestimated their bargaining power vis-à-vis their much larger customers (i.e. the auto OEMs). While a prolonged slowdown in the auto sector (due to the broader economic slowdown, Covid-19 impact and supply chain issues surrounding semi-conductors) impacted their earnings in recent years, more importantly the heavy dependency of the auto ancillaries on auto OEMs has posed structural restraints on the ability of these firms to generate returns on capital significantly above the cost of capital. A few points that corroborate this are:
- The prerequisite for an auto ancillary company to have a plant in the vicinity of the OEM customer for being awarded the business. This means that if a customer (auto OEM) opens a new plant in other geography, notwithstanding the existing relations, a vendor has to follow suit and open a new plant in its vicinity instead of servicing the new auto OEM plant from its existing locations. This entails increment investments/capex and thereby restricts the operating leverage benefits, return on capital employed and free cash generation that could have otherwise emanated from utilising existing facilities. For instance, despite adequate capacities at in its existing plants, Lumax Industries had to set up new plant in Gujarat to cater to Maruti’s (through Suzuki Motor Corporation) new Gujarat plant. Amidst the automobile slowdown of recent years, Lumax Industries incurred a cash capex of close to Rs6 bn over FY18-22 (57% of its FY22-end gross block) taking a severe toll on its Pre-tax RoCE (which declined from 21% in FY17 to 12% in FY22).
- Another pitfall of the heavy dependency on a single or a very narrow set of customers, irrespective of the share of business in those customers, is the risk of fortunes tied with such customers(s). We learnt this the hard way through our position in PPAP Automotive which derived 48% of its revenues from Maruti Suzuki and 31% of its revenues from Honda Cars in FY19. PPAP’s second largest customer viz. Honda Cars India Limited has gone through a rough patch in India in recent years with its market share in the domestic passenger vehicle market plummeting from 5.4% in FY19 to 3.0% in FY21 and absolute sales volumes declining from ~183k units in FY19 to about ~82k in FY21 prompting Honda to stop car manufacturing at one of its plants (Greater Noida) in India. Obviously, this has had an impact on PPAP with its revenues from Honda Cars declining sharply over FY20 and FY21 and significant underutilisation of plant meant for servicing Honda Cars.
Currently we own only one auto ancillary company in the portfolio viz. Suprajit Engineering which has significantly diversified its customer, product and market bases over the years through an effective capital allocation and customer acquisition strategies. More details on our investment thesis on Suprajit can found in our December 2020 newsletter.
- Assessing the pace of and impact from disruptions: Disruption due to changing industry dynamics and technology evolution is a key risk for an incumbent company. In India this type of disruption can be seen in many sectors like media, transportation (from electrification), energy (from renewables) and retail (from e-commerce). Hence, it is of utmost importance to be able to factor in such a risk for our portfolio companies. We were rather slow in anticipating the extent and pace of disruption in case of a portfolio company viz. Music Broadcast Limited (MBL), a leading radio broadcaster in India. While globally online music streaming apps have been successful in making rapid strides at the cost of traditional media like radio, we believed the adoption will be relatively slower in India, especially in tier 2, tier 3 cities/towns and rural areas. However, the onset of Covid-19 proved us wrong. Given that the majority of people prefer listening to radio while commuting, the emergence of Covid-19 led to a decline in radio listenership due to a fall in overall commuting. Simultaneously, the adoption of OTT apps providing free access to music shot up, resulting in a structural shift of listenership from radio to digital platforms. Following this trend, advertisers too reduced their allocation of advertising budget towards radio preferring to advertise on other mediums like digital platforms. This besides the other challenges (eg. a drop in advertising by its largest customers like the Government of India, a failed attempt to acquire Reliance Broadcast Network Limited due to lack of approval from the Ministry of Information & Broadcasting) resulted in MBL’s revenue declining sharply between FY19 and FY22.
- Pitfalls of deviating from our philosophy of investing in niche market leaders: In most industries in India, the top players command disproportionately higher volumes, pricing power and thereby industry profit share. This explains the significant gap between the market leaders and tail-enders in key metrics like margins, return on capital and debt. By virtue of the above advantages, market leaders are able to withstand the stress market conditions much better than weaker peers. In large markets like the Indian financial services industry, the only way to invest in small caps is to invest in companies which are focusing on niche segments and not in lenders which are competing with the large banks. However, we made an exception to this while investing in DCB Bank, a relatively small bank with slim margins and operating in segments with stiff competition from the large banks. When compared to the well run larger banks, DCB Bank lagged in terms of cost of funds, margins and cost to income. Our investment thesis was around its stable management team, its conservative lending practices and expectation of increasing RoE through improved productivity at its newly opened branches (DCB had invested heavily in expanding its branch network between FY15-18). However, the onset of Covid-19 exposed DCB’s weaker metrics resulting in significant stress on its balance sheet, slowdown in growth and resultantly a much longer route to RoE recovery.
While we continue to hold lending stocks in the Little Champs portfolio viz. Aavas, Home First and MAS Financial, unlike DCB, these companies, though smaller in size, focus on niche segments within the lending industry and do not see significant competition from the larger banks. This enables these NBFCs to generate superior net interest margins (5%+) while keeping credit costs under control. As a result, while DCB Banks’ RoA was ~1%, these three NBFCs generate a RoA of ~3%.
Incorporating the above learnings in our research process
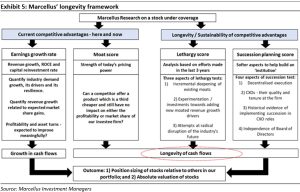
In the last two years, we have implemented Marcellus’ Longevity Framework (summarised in the exhibit below) as a tool to drive our stock selection and position sizing process.
Some of the ways through which this framework is helping us avoid the mistakes described in the preceding section are:
- The competitive advantage (populated through moat score) requires analysts to assess a company’s competitive advantages through not only the lens of its strengths over its peers but its bargaining power over customers/vendors etc through industry analysis like Michael Porter’s five forces or Hermann Simon’s Hidden Champions framework where smaller B2B companies have a hammerlock on their much larger customers (see our Nov’19 Little Champs newsletter for more on Herman Simon’s framework).
- The lethargy pillar of the Longevity framework requires an assessment of a management/company’s thought process towards disruption and steps taken by the company towards mitigating the same. In fact, companies which themselves disrupt the industry get relatively higher scores in our framework and thus end up with higher position sizes in our portfolios.
Furthermore, the Longevity framework is not just used for stock selection and position sizing but also to continuously evaluate the portfolio companies in order to detect any signs of lethargy and enhance our understand using the key value drivers of the portfolio companies. Armed with this framework our research team hopes to deliver even better years for our clients in the years to come.

