The rate at which fundamentals of a company compound (and hence its share price) over the long term is inversely correlated with the quantum of benefit that an investor can achieve by perfectly timing her purchases at the bottom of the share price trajectory. Moreover, for a portfolio consisting of high-quality companies, benefits from a fully invested portfolio’s rebalancing in the aftermath of a share price dislocation far outweigh the small potential benefits related to perfect timing of entry and exits in such high-quality stocks. Hence, an investor seeking to invest in companies with high quality fundamentals should neither wait for ‘mean reversion’ in her existing portfolio, nor should she wait for a market correction before “topping up” her investment.
Performance update – as on 31st December 2021
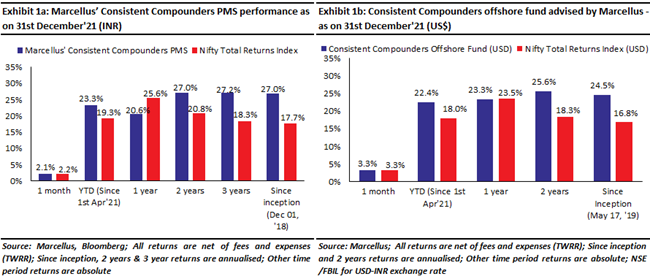
We have a coverage universe of around 25 stocks, which have historically delivered a high degree of consistency in ROCE and revenue growth rates. Our research team focuses on understanding the reasons why companies in our coverage universe have consistently delivered superior financial performance. Based on this understanding, we construct a concentrated portfolio of companies with an intended average holding period of stocks of 8-10 years or longer. The latest performance of our PMS and offshore fund (USD denominated) portfolios is shown in the charts below.
Inverse correlation between fundamental quality and benefits of timing entry/exits
One of the most frequently asked questions that we encounter is “Is this the right time to invest in the stock market?” The answer to this question needs a degree of clarity of thought around which type of stocks should be timed and for which type of stocks this question is irrelevant.
The exhibit below shows an inverse correlation between the rate of compounding of share prices with the quantum of benefit derived from perfectly timed purchase of these equities on an ongoing basis. This analysis has been carried out on a combination of Nifty50 constituent stocks (as they stood in 2008) and the current Marcellus’ CCP portfolio constituents (some of which were also part of Nifty50 in 2008).
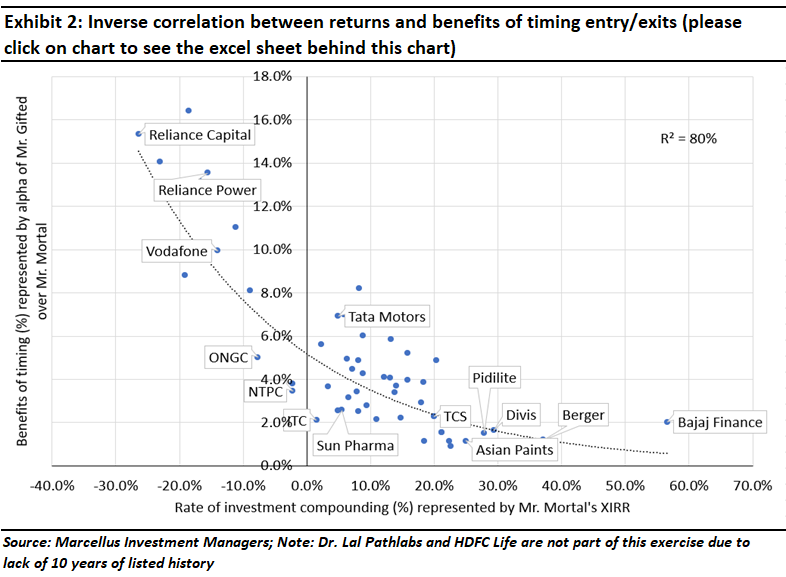
For every stock analysed in this exhibit, we have taken 11 sets of 10-year periods of investment starting with 1st April 2000. For example, for L&T, the first 10-year period starts on 1st April 2000 and ends on 31st March 2010. The second set starts on 1st April 2001 and ends on 31st March 2011. The eleventh set starts on 1st April 2011 and ends on 31st March 2021. In each of these 11 sets, ‘Mr. Mortal’ and ‘Mr. Gifted’ receive Rs. 1 crore of cash inflow into their bank accounts. Mr. Mortal invests Rs. 1 crore annually on 1st April of each financial year whilst Mr. Gifted invests Rs. 1 crore annually at the 52-week low price of each financial year. XIRRs are then computed for all the sets of 10-year periods are then averaged to get Mr. Gifted’s and Mr. Mortal’s average XIRR comparison for each stock.
Effectively, the scatter chart is suggesting that:
· For companies whose share price compounds at a high rate of more than 15-20% CAGR (represented by Mr. Mortal’ investment performance), even perfect timing of entry points (i.e. investing every single year at the year’s lowest share price) does not generate more than 2-3% alpha (represented by Mr. Gifted’s outperformance over Mr. Mortal).
· For companies whose share price compounds at a weak rate (say less than 10% CAGR), perfect timing of entry points can generate 5-10% alpha compared to lack of any timing.
The primary reason for this inverse correlation is that weaker the fundamentals of a company, the greater the uncertainties from competition, macro-economic variables, disruptive evolution, black swan events, internal factors etc. These uncertainties then get reflected in the volatility of the respective share prices. Such high levels of volatility in the share prices of companies with weak fundamentals results in greater alpha for Mr. Gifted over Mr. Mortal through perfect timing of the entry points (lowest point of every year).
Moreover, the weaker the fundamentals of a company, the weaker will be its long-term rate of share price compounding (since over the long term, rate of growth in fundamentals is the primary driver of growth in share prices), and weaker will be Mr. Mortal’s rate of compounding (buy and hold, without any ability to time entry points).
A cricketing analogy helps convey this point more clearly. A technically sound batter like Rahul Dravid averages over 50 in Test cricket regardless of whether India is playing or abroad, on spinning tracks or on bouncy tracks, in hot conditions or in cold & overcast conditions. Hence if you are betting on Dravid playing well (and let’s define playing well as at least scoring 50 runs), your chances of winning the bet are equally high regardless of where India is playing.
On the other hand, for batters who are less technically sound than Rahul Dravid (i.e. the majority of batters who have played Test cricket for India), their batting average at home will be much higher than their batting average abroad and they will be averaging more on spinning tracks than on bouncy tracks and they will be averaging more if the Test match is played in hot conditions. So with these sorts of batters, you will be more inclined to bet on them playing well if India is playing at home and in spinning conditions. This is the cricketing equivalent of trying to time your investment in L&T.
For high quality companies, portfolio rebalancing benefits far outweigh benefits related to timing of entry and exits.
After the reading about the analysis highlighted above, some investors seeking to invest in high quality companies (like those in the CCP Portfolio) might say that “Even though the gap between XIRRs of Mr. Mortal and Mr. Gifted is as low as 2-3% for Bucket C and CCP Portfolio, I want to benefit from this gap and be like Mr. Gifted”.
In our 1st October 2021 newsletter, we had highlighted that – “Every stock market crash causes a dislocation in a portfolio of high-quality companies, due to differential drawdowns in the share prices of constituent stocks. Rebalancing such a portfolio in the aftermath of the crash not only generates additional returns, it also crushes the risk of being left with uninvested cash.”. In order to carry out such rebalancing exercise, the investor should stay fully invested at all times and rebalance her portfolio in two ways to benefit from a stock market crash. Firstly, after a crash, she should rebalance the portfolio to increase allocation to companies that have undergone high drawdowns in the crash (and finance this investment by shaving off allocations to companies that have NOT undergone high drawdowns). Secondly, after the share prices of the portfolio companies have recovered, she should again consider rebalancing the portfolio to sell some allocation in companies that have seen a sharper recovery than the rest of the portfolio. Such rebalancing should also be carried out if share price dislocations happen without a broader stock market crash.
The quantum of benefit from such rebalancing of portfolios with high quality stocks is as high as 5-10% per annum, and hence it far outweighs the potential benefits of perfect timing of entry points in such stocks.
Investment implication #1 (applicable for existing investments): Unlike the broader market, mean reversion after a rally does NOT happen for share prices of high-quality stocks (making it futile to wait for mean reversion in CCP)
Given that the last 18 months have witnessed a strong rally in the broader market and in share prices of most companies, investors might have a temptation to wait for some ‘mean reversion’ before making incremental investment. This approach might make sense for the broader market, but it has a very high probability of failure for Consistent Compounders.
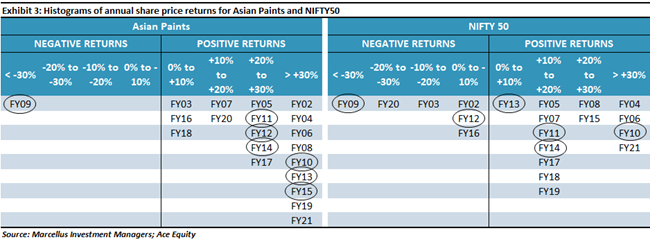
To understand this from empirical evidence, consider the two histograms shown below and observe what happens after the drawdown related to the Global Financial Crisis and the very sharp stockmarket recovery thereafter:
· Both Nifty50 as well as Asian Paints delivered less than -30% performance during FY09.
· Both Nifty50 as well as Asian Paints delivered more than +30% performance during FY10.
· Asian Paints’s consistently delivered high share price performance in the years after the FY10 recovery i.e. +20 to +30% in FY11, FY12 and FY14, and more than +30% in FY13 and FY15.
· Nifty50 demonstrated the concept of ‘mean reversion’ as it delivered weak returns in the aftermath of the recovery witnessed in FY10 i.e. +10 to +20% in FY11 and FY14; 0% to +10% in FY13 and negative returns (0% to -10%) in FY12.
Replacing Asian Paints with any other company possessing high quality fundamentals would produce the same conclusions as highlighted above.
Hence, even though FY21 and 1HFY22 has seen a strong recovery in share prices of several companies in the stock market, the concept of mean reversion will not apply on companies with high quality fundamentals that are expected to continue delivering strong fundamentals which are likely to support their share price performance in the years to come.
Investment implication #2 (applicable for investment of fresh income generated through salary / dividend / rentals etc): Periodic topups in CCP add more value than lumpy topups after a correction in the market.
In our 1st Jan 2021 newsletter, we had quantified that investors who waited for a market correction before deploying top-ups from their recurring income into Marcellus’ CCP PMS would have experienced a significant drag (of at least 3-5% on annualized returns, if not more) vs SIP based investments i.e. systematic monthly or quarterly top-up investment in CCP PMS. This is due to a combination of three factors: a) low correlation between CCP with Nifty50 during periods of weakness in the broader market; b) difficulty of predicting short term share price movements based on the expected outcome of a looming uncertainty; and c) the various psychological challenges around investing at a level higher than that of previous top-ups (eg. investing at 52-week high share prices, high P/E multiples, the boring aspect of investing in the same set of stocks repeatedly whilst all your friends are investing in the hottest IPOs/crypto/start-ups, etc). An SIP in CCP addresses these three challenges by taking away the need for the investor to make judgement-based calls around market timing.

