Share prices of CCPs often go on a ‘holiday’ for 12-24 months, delivering weak or no returns. These ‘holiday’ periods of share price are typically uncorrelated with fundamentals because during such periods these companies continue implementing initiatives to enhance the sustainability of their competitive advantages. Once the ‘holiday’ period ends, share prices of CCPs deliver strong returns to catch up with their fundamentals. Given the disconnect with fundamentals, it is incredibly difficult to time the start and end of these ‘holiday periods’. Hence, at Marcellus, we stay invested and buy more of these stocks during such periods of share price stagnation. This newsletter highlights examples of companies who have delivered impressive share price growth over the long term, despite their share prices going on ‘holidays’ from time to time.
Performance update – as on 30th April 2022
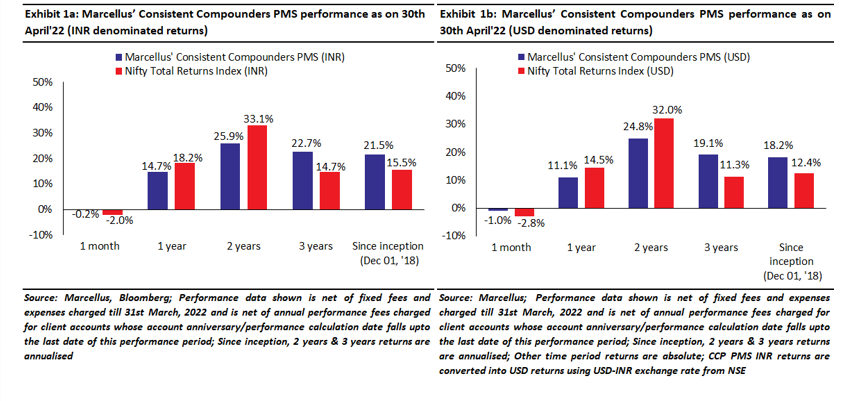
We have a coverage universe of around 25 stocks, which have historically delivered a high degree of consistency in ROCE and revenue growth rates. Our research team focuses on understanding the reasons why companies in our coverage universe have consistently delivered superior financial performance. Based on this understanding, we construct a concentrated portfolio of companies with an intended average holding period of stocks of 8-10 years or longer. The latest performance of our PMS (denominated in INR and USD) is shown in the charts below.
CCPs’ share prices go on ‘holiday’ occasionally – a few examples
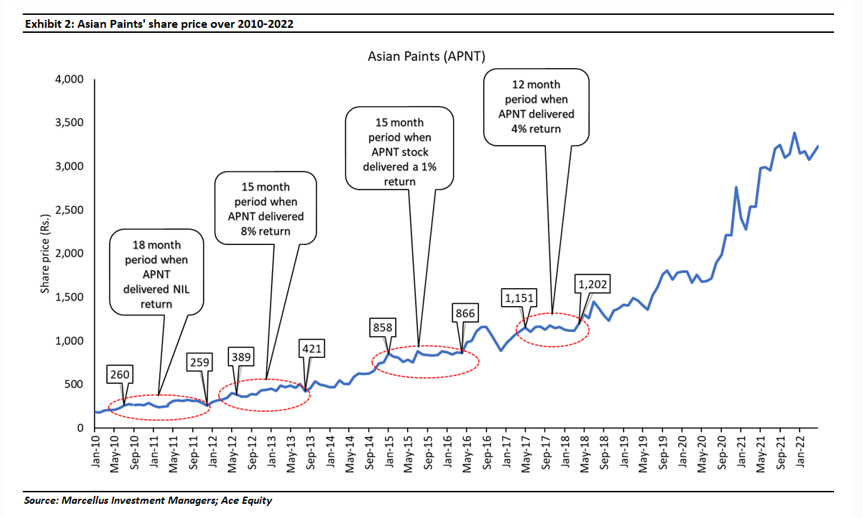
Across all our CCP portfolio companies, Asian Paints’ historical share price compounding has been one of the most consistent. It has compounded at an impressive 26% CAGR over the last decade. Yet, during this period, Asian Paints has witnessed four blocks of more than 12 months each, where its share price has delivered almost zero returns – see exhibit below.
While it is impossible to state the exact reason behind share price stagnation, there is often negative news flow during such phases around non-structural factors like raw material cost inflation, weak monsoon, GST, Demonetization, etc.
Even as the share prices went on ‘holiday’, the firm continued to work behind the scenes to strengthen its competitive advantages and add new growth drivers.
Jul’10 to Dec’11 (18-month period) – zero absolute return:
During this period, news flow was dominated by concerns around the impact of massive input cost inflation on margins, shortage of TiO2 (a key raw material for paint companies), impact of 12-15% annualized product price hikes on volume growth (due to price elasticity of demand), etc. While most investors were worried about the impact of input cost inflation and raw material availability over 2011 & 2012, Asian Paints’ business kept progressing well with examples being: (a) dealer network expansion at 18% CAGR from 15,000 to 21,000; (b) investments in plant automation; (c) upgradation & automation of warehouses; (d) tech investments around sales force automation. (Our March 2022 newsletter (exhibits 6 and 7) highlights how high pricing power of Asian Paints helps protect its margins and volume growth during such times). Once the ‘holiday’ period ended in December 2011, Asian Paints share price delivered an absolute return of ~70% over the next 12 months.
Jan’15 to Apr’16 (15-month period) – absolute return of 1%:
During this period, investor concerns were around: (a) the impact of consecutive weak monsoons on paint demand; and (b) are frequent price cuts to pass on drop in crude oil prices, an indicator of low pricing power? Behind the scenes not only did Asian Paints strengthen its business through dealer network expansion from 34,000 to 40,000 and consistent investments in tech & automation, but also seeded new initiatives such as service offerings, AP Homes stores and the Home Décor division as new growth drivers (which have been strengthened subsequently and have acted as a source of market share gains during the Covid). Between April 2016 and October 2016, Asian Paints’ share price rallied by 24%, before demonetization related concerns surfaced in Nov’16 i.e. ‘who wants to paint their homes when there is no cash lying in the wardrobe?’. The 12 months after Dec’16 saw Asian Paints share price delivering an absolute return of 30%.
May’17 to Apr’18 (12-month period) – absolute return of 4%:
Over this period, there were multiple occasions when news flow raised apprehensions amongst the investors starting with the introduction of GST in the aftermath of demonetization, rising crude oil prices, entry of JSW Paints, etc. Once again, behind the scenes, the firm continued to deliver market share gains in decorative paints, entered adjacencies like waterproofing & putty, commissioned two of its most automated plants in Vizag & Mysore. During the subsequent three years, Asian Paints share price delivered an absolute return of almost 111%!
Asian Paints
is not the only stock from our CCP portfolio which has undergone such periods of flat or NIL returns. There are several other such examples where share prices have gone on ‘holiday’ for reasons not explained by their fundamentals.
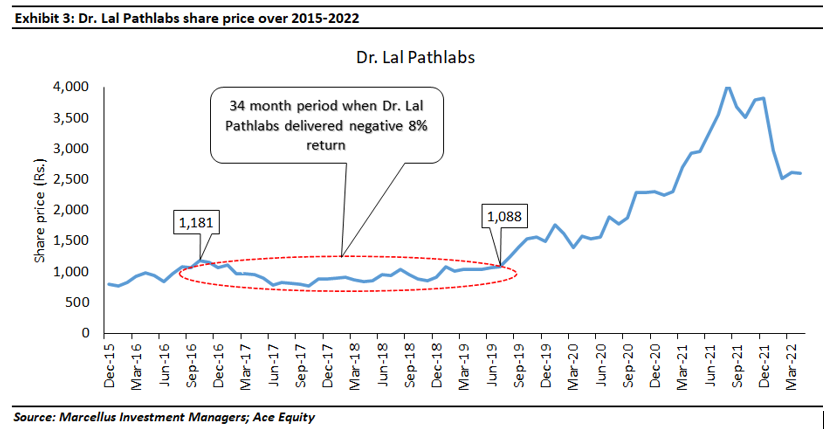
Dr. Lal Pathlabs’
share price has compounded at an impressive 20% CAGR between Dec’15 to Apr’22 – yet the stock delivered an absolute return of negative 8% over the 3 years from Oct’16 to Jul’19 Here too, there were multiple reasons for apprehension amongst investors. Firstly, Dr Lal Pathlabs faced a major price war during 2016-2017 from Thyrocare, which it was able to defend successfully due to the moats created around convenience to the customer. Secondly, commissioning of the new reference lab in Kolkata negatively impacted the operating margin by around ~100-150 bps for a period of two years due to upfronting of certain costs. Eventually, not only was Dr. Lal’s operating margin back to its historical level of ~26% by FY20, but its foray in the East region has also proved to be a success – revenue from the Eastern region has grown at ~26% CAGR over the last 3 years. Over subsequent two years from Aug’19 to Aug’21, Dr. Lal Pathlabs delivered share price CAGR (i.e., annualized return) of ~80% (see exhibit below), catching up with fundamental progress made over the preceding three years.
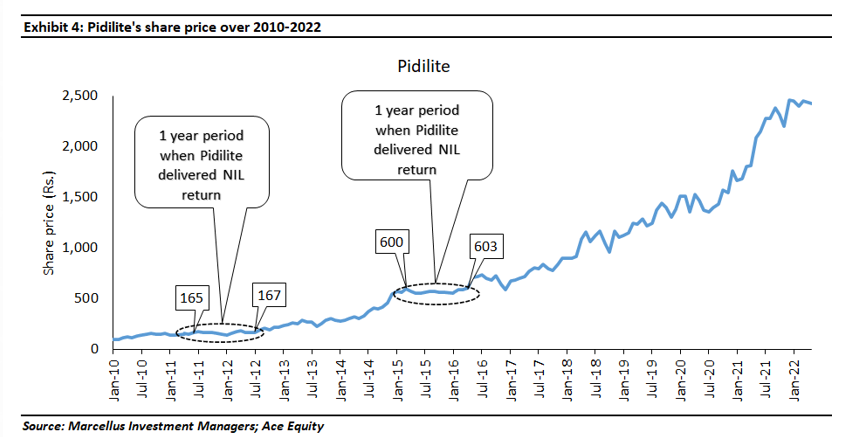
Pidilite’s
share price has compounded at 29% CAGR over the last 10 years. However, its share price delivered zero returns over Jun’11 to Jul’12 (12 months) when input prices had seen a massive inflation temporarily impacting Pidilite’s operating margins. In the subsequent 12 months, Pidilite’s share price delivered an absolute return of ~60%. Again, during Mar’15 to Apr’16 Pidilite’s share price delivered zero returns despite healthy profit growth of 60% yoy during the year. This was a period when Pidilite underwent a major transition towards professionalization of management by appointing Bharat Puri as its first non-promoter MD which was a big step towards institutionalizing the firm. Over the subsequent two years from Apr’16 to Apr18, Pidilite’s share price delivered CAGR (i.e., annualized return) of ~34% (see exhibit below).
Even two decades ago share prices of CCPs used to go on holiday. For example, HDFC Bank’s share price has compounded at an impressive 21% CAGR over Mar’00 to Mar’07. During this 7-year period, HDFC Bank’s share price delivered a negative 3% CAGR (i.e., annualized return) in the 3-year block of Mar’00 to Mar’03 inspite of extremely healthy fundamental performance of 48% PAT CAGR. Over the subsequent four years from Mar’03 to Mar’07, while HDFC Bank’s PAT grew at 31% CAGR, its share price grew at a much higher 42% CAGR, effectively catching up with the fundamental progress made during the period of share price stagnation.
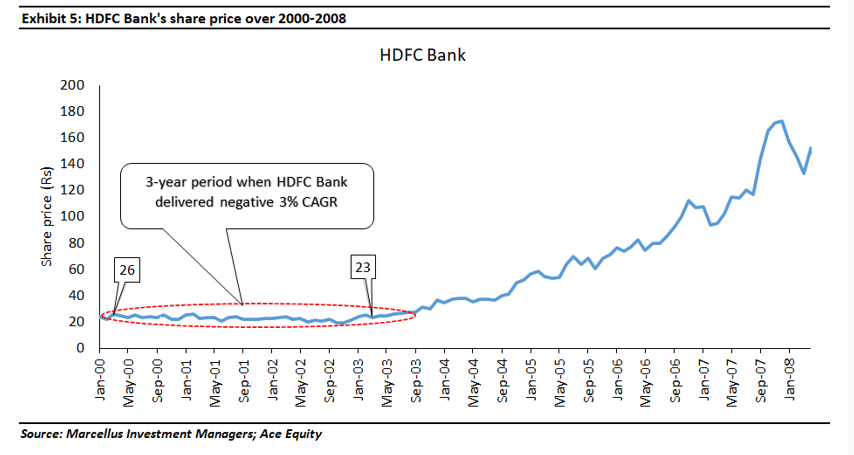
Do periods of stagnation occur due to over-valuation of share prices? This question is easy to answer with the benefit of hindsight. Had the stagnation occurred due to overvaluation, share prices would not have rallied sharply to catch up with fundamental growth of these companies immediately after the end of their ‘holiday period’.
The short term (12-24 months) share price performance of any stock, including a CCP, rarely tells the investor anything useful about how fundamentals of the company are shaping up, or how the current share price stands relative to the intrinsic value of these firms. In almost every instance when the share price growth stagnates for CCPs, the catch up is sudden & rapid, and cannot be timed easily.
Investment implications – neither fundamental weaknesses nor overvaluation justify the recent share price stagnation of some stocks in our portfolio
Nestle, HDFC Bank and HDFC Life are some of the companies in our portfolio which are undergoing a ‘holiday’ period in their share prices over the past 12 months, despite the fundamentals of these companies continuing to surge ahead. Here is how we have assessed the progress of their fundamentals over this period.
Nestle India: Nestle has delivered ~2% absolute returns over the last 24 months (from Apr’20 to Apr’22). While it is hard to pinpoint the exact reason behind this, one major apprehension amongst investors has been impact on margins due to recent input cost inflation. Nestle enjoys strong pricing power in almost every product category it operates due to moats built around regulatory barriers to entry, product differentiation & operating efficiencies making input cost inflation an irrelevant issue over long term. Over this period, the company has taken following steps to strengthen its business: (a) Expansion of distribution in rural & semi-urban areas where sales have grown by ~15% CAGR over the last 2 years; (b) Relentless focus on operating efficiencies in manufacturing, procurement, logistics, distribution and marketing, through the use of technology & automation; (c) Commissioning of their state-of-the-art factory at Sanand which is ~20% more productive compared to other similar Nestle factories due to automation.
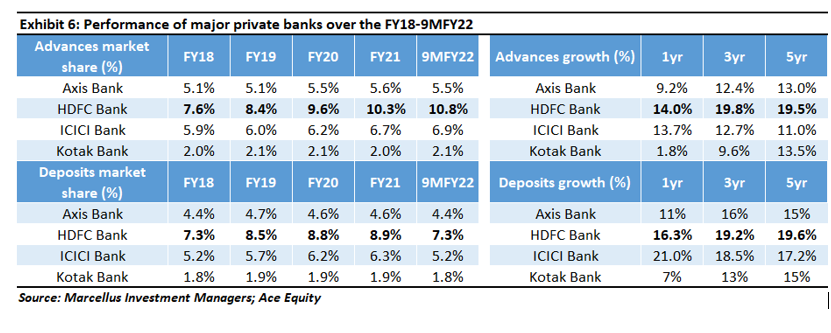
HDFC Bank: HDFC Bank has delivered absolute negative return of ~4% over the last 18 months from Nov’20 to Apr’22. Over this period, HDFC Bank has consistently gained market share on both sides of the balance sheet. Advances (loan book) market share has shot up from 7% as of Mar’17 to 11.5% as of Mar’22. Similarly, deposits market share has improved from 6% as of Mar’17 to 9.5% as of Mar’22. No other bank has been able to clock market share gains on this magnitude organically over the past five years.
One source of apprehension amongst investors has been the moderation in HDFC Bank’s NIMs due to the increase in share of wholesale business in its overall loan mix leading to Pre-Provisioning Operating Profit (PPOP) growth significantly lagging advances growth. However, we look at this differently and continue to believe HDFC Bank still is the bellwether in the Indian banking industry and the shift to wholesale banking is in-line with the bank’s overall policy of pricing appropriately for the risk. Whilst wholesale banking inherently offers low NIMs, investors need to see lower margins in conjunction with materially lower operating expenses and credit cost. Despite shift to wholesale banking, the bank delivered a healthy 2.1% RoA/16.7% RoE while PAT has grown at ~19% YoY in FY22.
HDFC Life: HDFC Life has delivered just 8% share price CAGR over the last 2 years, despite total APE/VNB/EV growth of 15%/18%/22% CAGR over FY20-22. HDFC Life has grown ahead of the industry leading to increase in its private market Individual APE market share from 14.2% in FY20 to 14.8% in FY22. Despite covid related shocks and payout of massive covid related claims, HDFC Life has posted industry leading return ratios in FY21 and FY22. Meanwhile, the company has acquired the business of Exide Life which is likely to further strengthen its agency force and help consolidate HDFC Life’s presence in Tier-III and IV cities. Product innovation at HDFC Life remains the key differentiator – the firm has continued to launch several industry first products in last 3-4 years and successfully scaled up these products which were both growth and margin accretive.
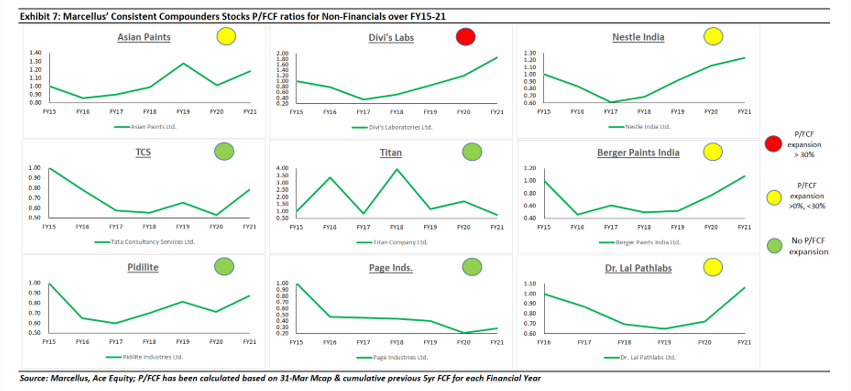
View on valuations: As explained in our 7th April 2022 webinar, and highlighted in the exhibit below, over the last several years, share prices of our portfolio companies have broadly progressed in line with their free cash flows till FY21 end (i.e. until a year ago). Their P/FCF (price to free cashflows) multiples have remained broadly unchanged over FY15-21, as highlighted in the exhibit below. Hence, the ‘holiday’ period of some stocks over FY22 cannot be attributed to any valuation related concerns that could have prevailed until 12 months ago.
At Marcellus, our research process tends to judge the long-term sustainability of competitive advantages instead of being influenced by short term noise around macro events such as raw material, cost inflation, weak monsoon, GST, demonetisation, Virat Kohli’s form, the latest news from Ukraine, etc. Investing and holding clean, well-managed companies for the long term is the most effective way of killing the noise that interferes with the rationality of investment decisions.


