Long periods of outperformance by quality firms are often characterized by intermittent periods of severe underperformance – something that has been unavoidable by even the likes of Warren Buffet. Such underperformance was especially prominent during three instances (first half of 1970s, Mar’99-Aug’00 & Nov’04-Apr’06) wherein Berkshire Hathaway’s underperformance was in high double digits even as over a 10-year period encompassing the aforementioned instances, Berkshire’s shares beat S&P500 quite handsomely. Most such short-term pain periods are driven by market ‘narratives’ that may lead to investors’ dumping tried and tested method of fundamentals backed investing, leading to correction in share prices even as fundamentals continue to compound at a heathy rate. In this newsletter, we showcase how investors would’ve been better off doubling down during these periods – something that would’ve led to rich rewards over the ensuing 3-5 year period. Our Consistent Compounders portfolio went through a major pain period during FY23 but a recovery in market prices in line with portfolio earnings has led to 23.7% returns since lowest point in Mar’23. With the divergence between CCP’s valuation premium & RoE premium (vis-a-vis Nifty50) at a decadal high, it is as good as time as any to invest in quality franchises.
*For relative performance of particular Investment Approach to other Portfolio Managers within the selected strategy, please refer https://www.apmiindia.org/
“The influence of what we call analytical factors over the market price is both partial and indirect – partial because it frequently competes with purely speculative factors which influence the price in the opposite direction; and indirect, because it acts through the intermediary of people’s sentiments and decisions. In other words, themarket is not a weighing machine, on which the value of each issue is recorded by an exact and impersonal mechanism, in accordance with its specific qualities. Rather we should say that the market is a voting machine, whereon countless individuals register choices which are the product partly of reason and partly of emotion . Hence the prices of common stocks are not carefully thought-out computations, but the resultants of a welter of human reactions.”- Ben Graham & David Dodd, Security Analysis, 1934 (emphasis added by us)
Temporary periods of underperformance are a feature of quality investing – example of Berkshire Hathaway
If there’s one investor who has been repeatedly written off by new, adrenaline filled young upstarts it’s probably the Oracle of Omaha – Warren Buffett. Almost every decade features a phase where his investing philosophy is termed as – conservative, passe and archaic among other things. However, that hasn’t stopped the man from sticking to what he knows best and choosing to invest only in the kind of companies that showcase the triple virtues of corporate governance, competitive advantages and capital allocation – virtues that are central to Marcellus’ investment philosophy as well.
Most of the flak Warren Buffett has received over the years has come during periods of underperformance – which increase in number, the shorter the time duration being considered (read our Sep’22 newsletter which discusses this). Such periods of underperformance are not limited to certain decades but are spread out over time ever since Buffett started publishing returns in 1965/66.
What’s interesting to note is that even when Buffett was beating the S&P500 index handsomely over a 10-year time frame, there were 1-3 year periods when Berkshire Hathaway didn’t just underperform the S&P500 but even gave negative absolute returns at times. To be specific, there are 3 major periods of extended underperformance in Berkshire Hathaway’s shares:
- Over 1969-1979, Berkshire’s market value increased by 22.2% CAGR vs. 5.8% CAGR for S&P 500 index. However, within this period, Berkshire underperformed S&P500 in 1970 (by -9%), 1972 (by -11%), 1974 (by -22%) and 1975 (by -35%). The underperformance was significant enough to pull down relative performance vs. S&P500 even on a 3 year and 5-year basis (At the end of 1975, Berkshire’s 5-year CAGR was 0% vs. 3.2% for S&P500 i.e. underperformance by -3.2%)
- Over Dec’93-Dec’03, Berkshire’s class A shares beat the S&P500 by ~9% p.a. (17.8% vs. S&P500 CAGR of 9.1%). Within, this period, there was an 18-month stretch (Mar’99 – Aug’00) when Berkshire’s stock price underperformed S&P500 (on 1 year return basis) quite significantly (from -9% underperformance as of month ending Apr’99 to -48% underperformance as of month ending Feb’00). Much like in the 1970s, the 3 year and 5-year relative performance also suffered (At the peak of underperformance, Berkshire’s class A shares were underperforming S&P500 by -8.5% on a 5- year CAGR basis)
- Over Dec’04- Dec’14, Berkshire’s class A shares beat the S&P500 by ~4.5% p.a. (9.9% vs. S&P500 CAGR of 5.4%). Within this, for 17 months (Nov’04- Apr’06) Berkshire’s class A shares underperformed S&P500 (on 1 year return basis, from -2% underperformance as of month ending Dec’05 to -16% underperformance as of month ending Sep’05). (At the peak of underperformance, Berkshire’s class A shares were underperforming S&P500 by -11.1% on a 3- year CAGR basis)
To understand the dynamics of what would happen during such a period of underperformance by the most famous investor in the world, we will focus on one such period – March 1999 to August 2000.
As it happens, this extended period (18 months) of sustained underperformance came in the midst of a ten-year period ending December 2003 in which Berkshire’s class A shares beat the S&P500 by 9% p.a. (17.8% vs. S&P500 CAGR of 9.1%).
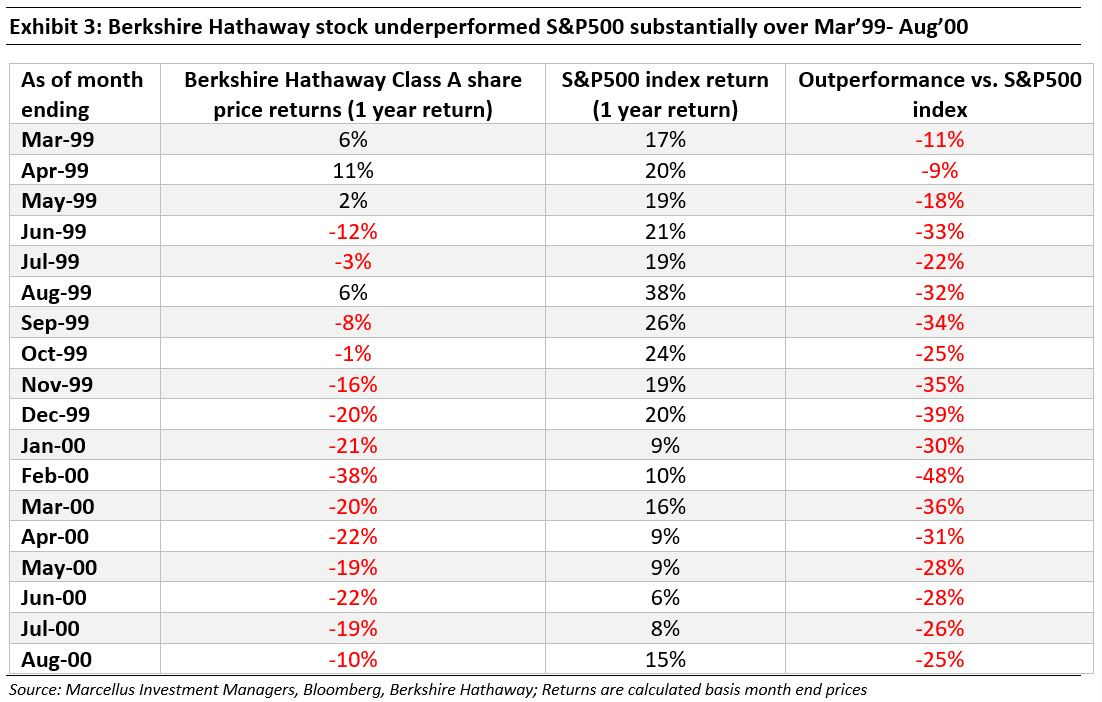
As is well known, the period shown in the table above was the height of the dot com boom. Amidst the mania of investing in the ‘tech and internet’ sector, there was no dearth of pieces predicting the demise of Buffet’s investing style.
“To be blunt, Buffett, who turns 70 in 2000, is viewed by an increasing number of investors as too conservative, even passe. Buffett, Berkshire’s chairman and chief executive, may be the world’s greatest investor, but he hasn’t anticipated or capitalized on the boom in technology stocks in the past few years.” – Barrons’s article
‘What’s Wrong, Warren’, Dec 27, 1999
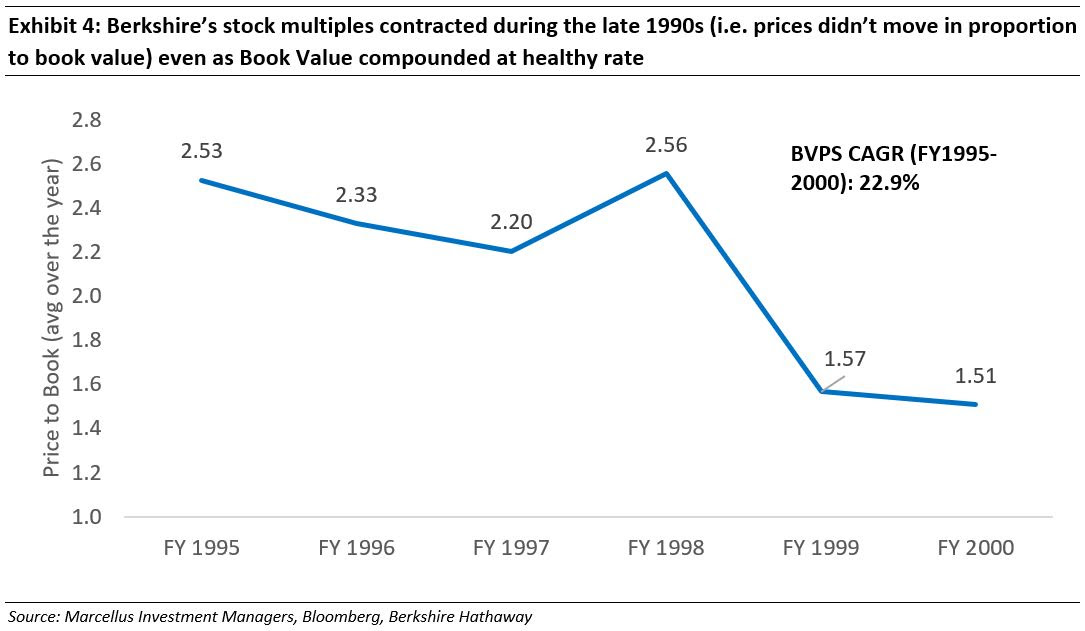
Over the 10-year period under consideration (i.e. 31st Dec’93 – 31st Dec’03) the fundamental performance of Berkshire Hathaway (as measured by Book Value per share or BVPS) compounded at an impressive 19%. Even so, within that period – especially during the late 1990s as tech mania took over the investing ecosystem, Berkshire Hathaway’s stock witnessed sharp P/B multiple compression, even though BVPS kept rising at an impressive rate [thus laying the groundwork for massive catch-up in years ahead].
What happened next is the stuff of legend. As the tech bubble burst and the S&P500 crashed, Mr. Buffett quietly notched up the kind of outperformance that made him famous in the first place. If an investor ignored the prevailing narratives around demise of Warren Buffet’s investing philosophy and stayed put (or even better deployed fresh monies) at the peak of such underperformance, the subsequent 5-year returns would’ve more than made up for the temporary period of pain.
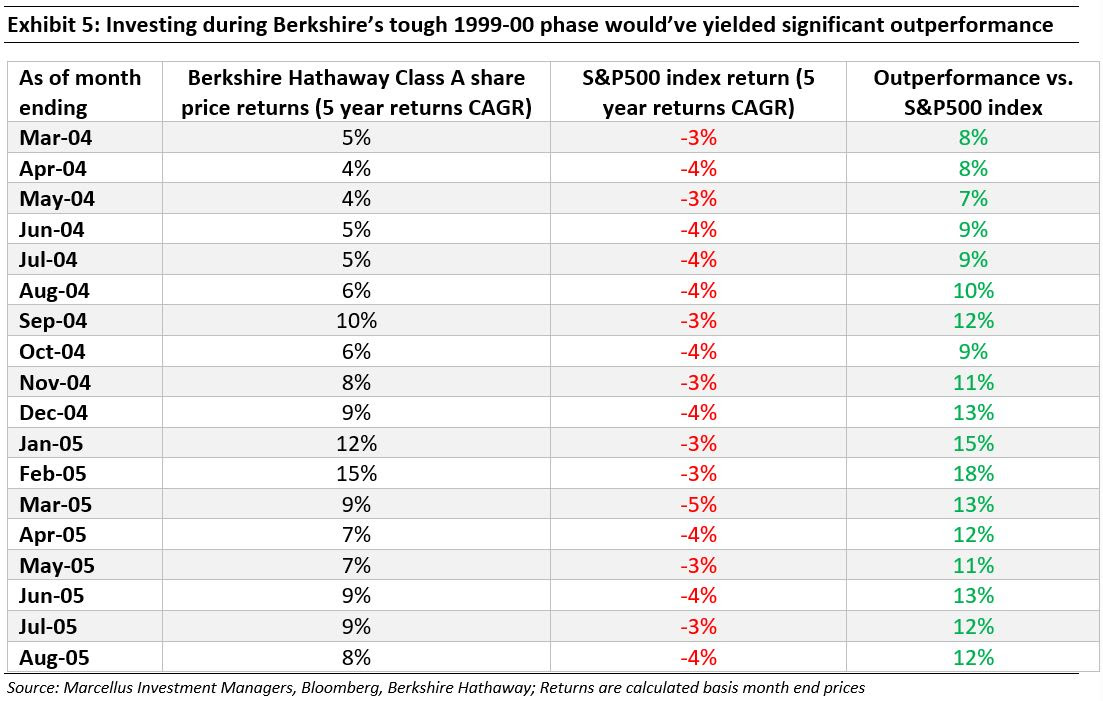
To be precise, an investor who purchased Berkshire Hathaway A shares on 1st March 1999 would have lived through the following returns (these returns are cumulative NOT CAGR):
- 1st March 2000: absolute returns -38%, underperformance relative to the S&P500 -49%;
- 1st March 2001: absolute returns -3%, underperformance relative to the S&P500 -3%;
- 1st March 2002: absolute returns 2%, outperformance relative to the S&P500 10%;
- 1st March 2003: absolute returns -12%, outperformance relative to the S&P500 21%;
- 1st March 2004: absolute returns 31%, outperformance relative to the S&P500 37%;
- 1st March 2005: absolute returns 26%, outperformance relative to the S&P500 29%;
The same holds true for investors who invested in Berkshire Hathaway A shares right at the beginning of the other extended periods of underperformance by these shares.
Let’s take the case of Nov’04- Apr’06 period of underperformance mentioned earlier.
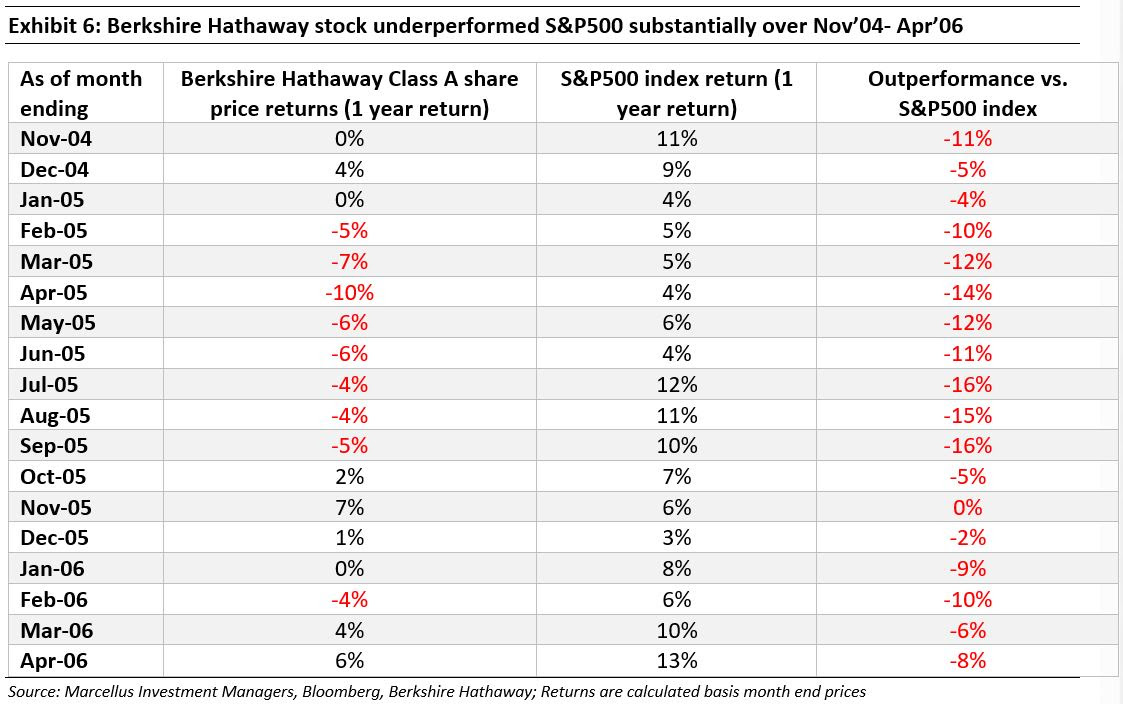
An investor who purchased Berkshire Hathaway A shares on 1st November 2004 would have lived through the following returns (these returns are cumulative NOT CAGR):
- 1st November 2005: absolute returns 2% underperformance relative to the S&P500 -4%;
- 1st November 2006: absolute returns 24%, outperformance relative to the S&P500 3%;
- 1st November 2007: absolute returns 55%, outperformance relative to the S&P500 22%;
- 1st November 2008: absolute returns 39%, outperformance relative to the S&P500 54%;
- 1st November 2009: absolute returns 17%, outperformance relative to the S&P500 25%;
- 1st November 2010: absolute returns 42%, outperformance relative to the S&P500 37%;
So why does this happen?
Why is it that even if an investor’s first couple of years as a Berkshire Hathaway shareholder yields disappointing results, by the fifth anniversary of his ownership of Berkshire Hathaway shares, the investor is almost always beating the S&P500?
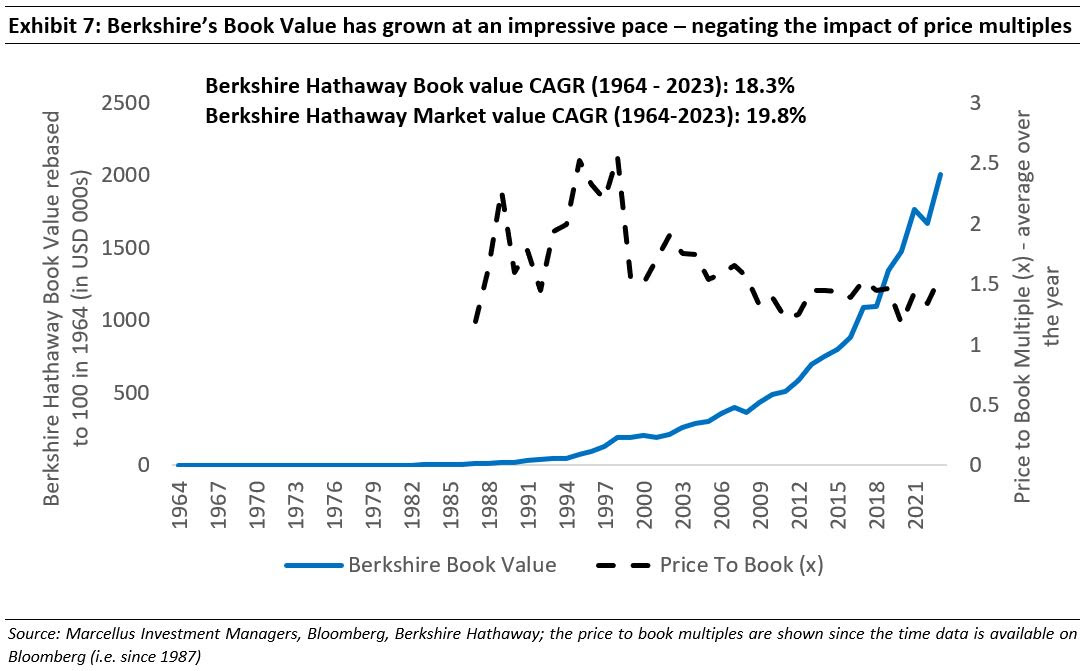
This is because the underlying compounding in Berkshire’s fundamentals – its Book Value to be precise – is so strong that over periods of longer duration they emerge more powerful than the damage inflicted by P/B compression (we discussed this point by using examples from Indian ecosystem in one of our earliest webinars).
As can be seen in the chart below, Berkshire’s returns (19.8% CAGR over 1964-2023) are driven by book value growth (18.3% CAGR over 1964-2023) – which has grown steadily, even as the P/B multiple (shown since the time its available on Bloomberg i.e. 1987) has gyrated up and down.
How is the preceding exercise relevant for Marcellus’ Consistent Compounder Portfolio?
As we saw in the case of Berkshire Hathway, during just about every instance of a ‘narrative’ driven market rally, the tried and tested model of investing in high quality franchises takes a back seat. People often become enamoured with the sharp increase in share prices of erstwhile beaten down stocks which are then taken to dizzying heights – often to massive detriment of people entering late into the buying cycle.
In India, we appear to be in the midst of a narrative driven market rally as a recent article from Bloomberg highlighted:
“In 2023, Indian investors traded 85 billion options contracts, more than anywhere else in the world. The country has topped the charts since 2019, when it first overtook the US in the volume of annual trades. (The US still buys and sells the most by dollar value.)”
- Bloomberg piece ‘>Retail traders are losing billions in India’s booming options market’, Feb, 2024
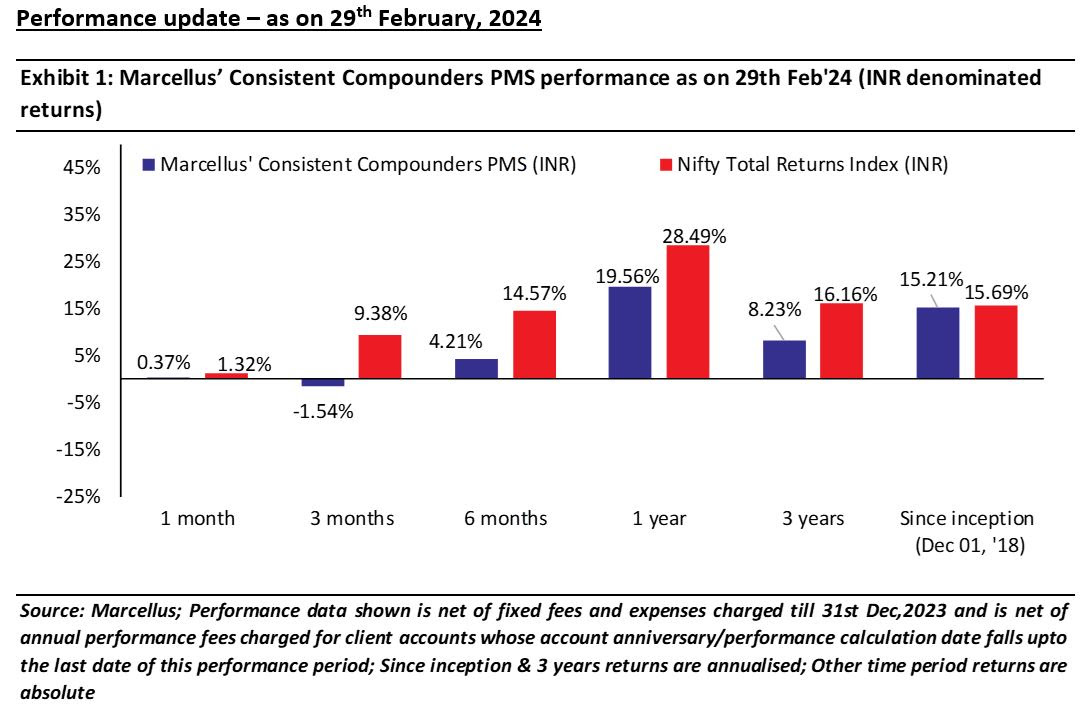
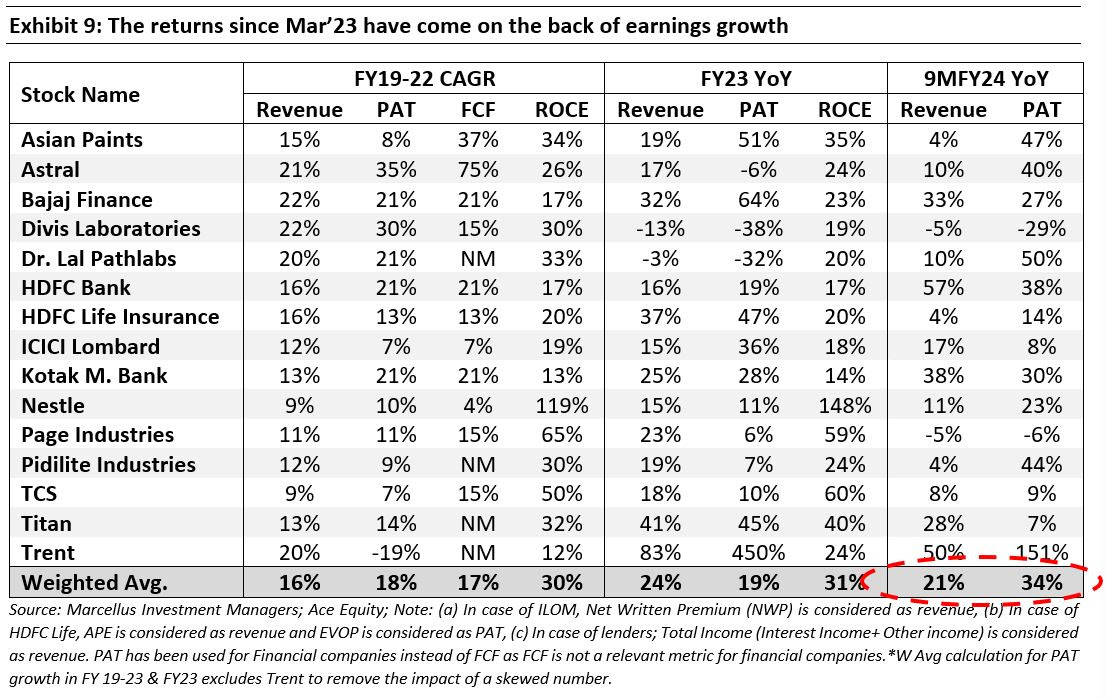
CCP’s major period of underperformance (mostly FY23) was a combination of both retail inflows backed strength of Nifty50 index as well as correction in our own investee companies (we discussed reasons for the same in our Feb’24 webinar). Since reaching the trough in the end of FY23 (14 Mar’23 to be precise), CCP NAV has recovered quite impressively to provide returns of 23.7% until February 2024 end.
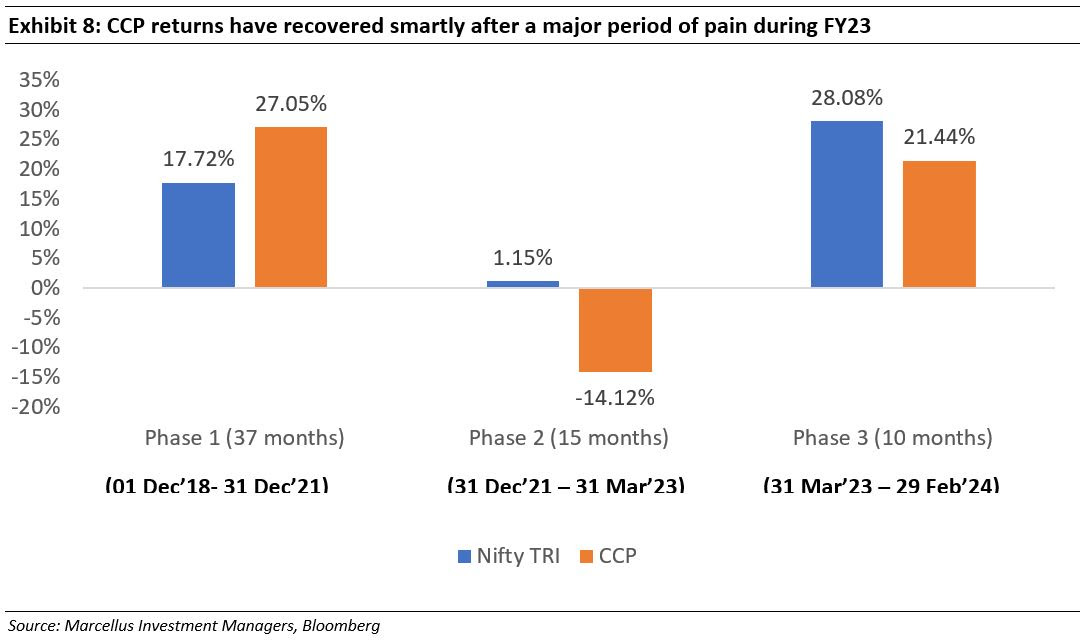
As can be seen in the table below, these returns have come on the back of healthy earnings that our investee companies have churned out over the 9MFY24 period.
In light of CCP’s heathy portfolio earnings and the prevailing market conditions, we’d urge our investors to remember the lessons from Berkshire Hathaway and how investing during the toughest phase was a much better strategy than believing the prevailing narratives around death of conservative, high quality fundamentals backed investing.
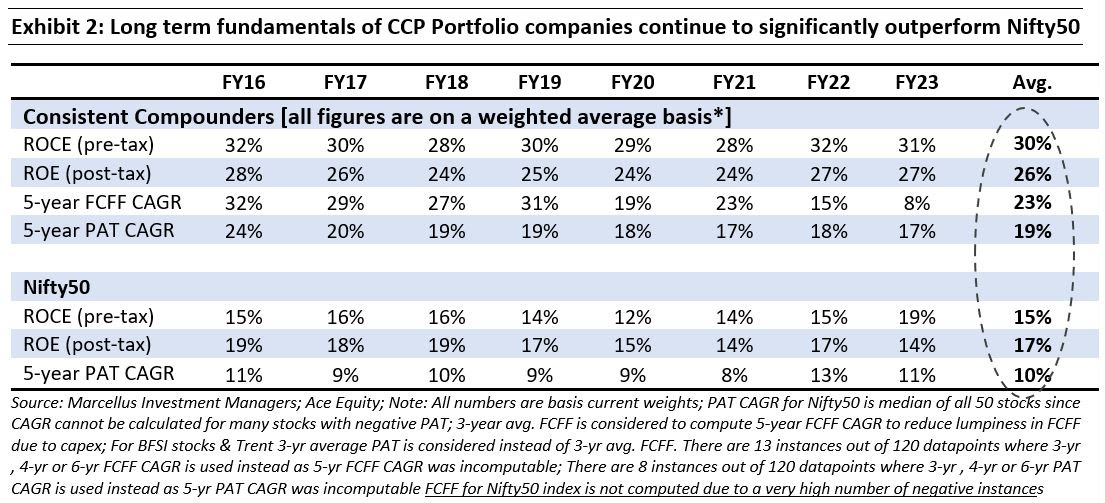
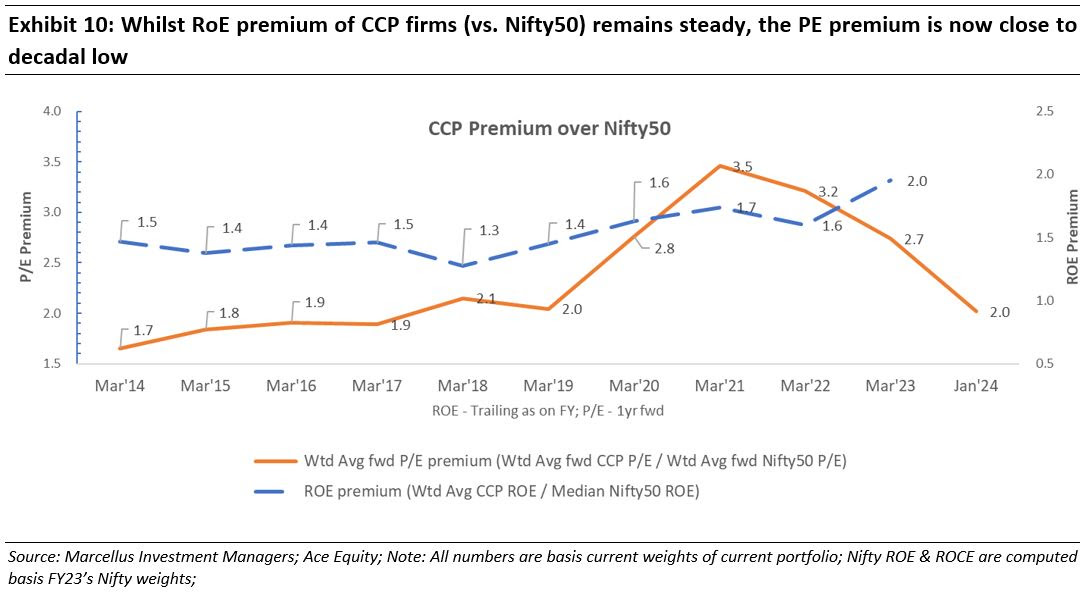
Rather than betting on market psyche and which way the investors’ fancy might swing, our focus has remained on ascertaining the profitable growth potential of our investee companies and as the chart below clearly showcases, the current disparity between our portfolio fundamentals (as measured by RoE) and valuations vis-à-vis the Nifty 50 index is as wide as it’s been over the preceding decade.
Such scenarios are few and far between in a quality investor’s journey and more often than not form the foundation for outsized returns in the years to come.
We close this newsletter by highlighting the following excerpt from Berkshire’s 1994 shareholder letter – something we believe holds true for Marcellus’ investing philosophy as well:
“Stock prices will continue to fluctuate – sometimes sharply – and the economy will have its ups and down. Over time, however, we believe it highly probable that the sort of businesses we own will continue to increase in value at a satisfactory rate.” – Berkshire Shareholder letter, 1994
Regards,
Team Marcellus

