Psychological biases tend to affect an investor’s decision making in subtle ways which are usually detrimental to long term investment returns. Several of these biases are better described as optical Illusions. Using the construct of the human brain as described by Nobel Laureate Daniel Kahneman in his book ‘Thinking, Fast and Slow’, we highlight a few common optical illusions in the investment world. These illusions provide an insight into the disconnect which is playing out in the stock market currently between business fundamentals and stock prices of CCP stocks. We remain convinced about the growth prospects, the competitive advantages and attractive valuation of our portfolio companies.
Performance update – as on 31st March 2023
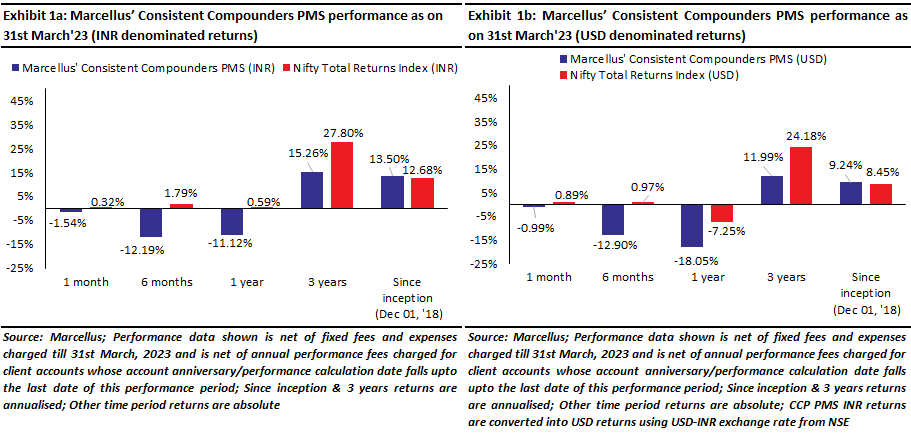
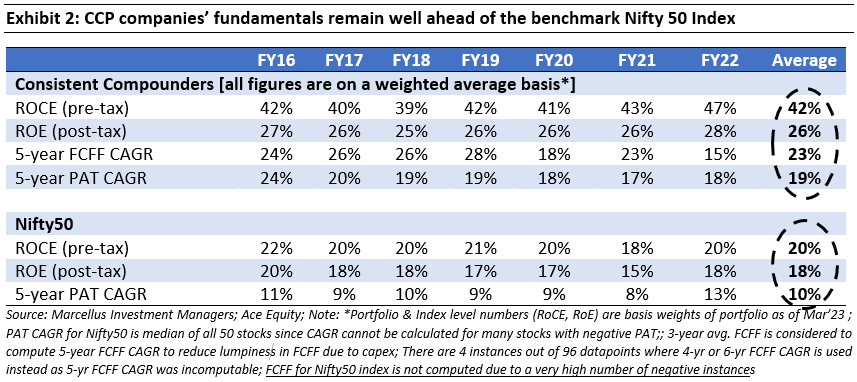
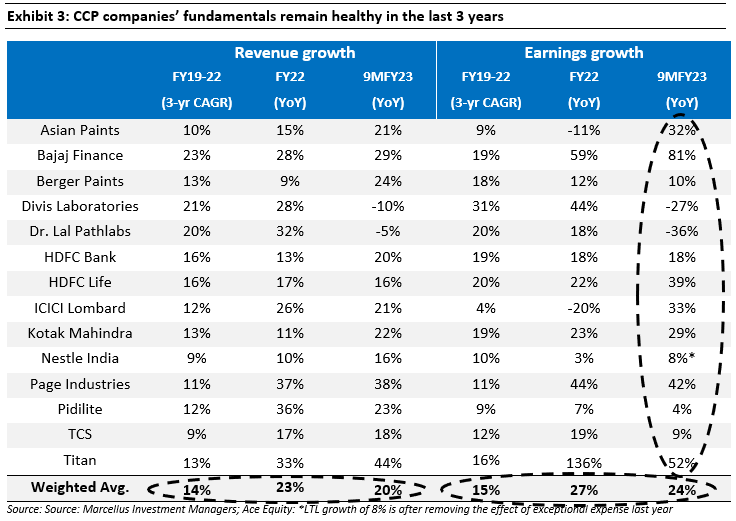
We have a coverage universe of around 25 stocks, which have historically delivered a high degree of consistency in ROCE and revenue growth rates. Our research team focuses on understanding the reasons why these companies have delivered healthy and consistent historical track record and which of these companies are likely to sustain their superior financial performance in future. Based on this understanding, we construct a concentrated portfolio of 13-15 companies with an intended average holding period of stocks of 8-10 years or longer. The latest performance of our PMS portfolio and the underlying fundamentals of the constituent stocks is shown in the charts above.
Humans have a predisposition to be tricked by optical illusions – which may lead to incorrect conclusions
“When people believe a conclusion is true, they are also very likely to believe arguments that appear to support it, even when these arguments are unsound”
― Daniel Kahneman in his bestselling book ‘Thinking, Fast and Slow’ (2011)
In this newsletter we return to one of our favourite topics – psychological biases. Our Feb’23 newsletter, covered the biases related to loss aversion and how assessment of an investment’s merit basis short term performance is detrimental to both wealth generation as well as your own happiness.
In this newsletter, we focus on another bias – the one related to optical illusions and how being aware of the trickery underlying our brains mechanics can help us all not only with regards to our investment journey but also in our normal lives.
Before we get into specific cases, it’s important to first understand how our brains perceive any given piece of information. As discussed by Daniel Kahenmann in his path breaking book ‘Thinking Fast and Slow’, our brain can be divided into broadly two parts (or systems):
System 1 operates automatically, instinctively and quickly, with little or no apparent effort on our part and with no sense of voluntary control.
System 2 allocates attention to effortful mental activities that demand it, including complex computations and difficult judgement calls.
i)Detect that one object is more distant than another, or
ii)Complete the phrase “bread and …”
i)Fill out a tax form, or
ii)Check the validity of a complex logical argument such “999 is the largest three digit odd number”.
Simply put, System 1 decides on a course of action basis a quick judgement (also called ‘heuristics’ by psychologists) – something which has helped us over many centuries in situations with simple causality. For e.g. our hunter gatherer ancestors did well to listen to their System 1 and ran when they heard the roar of a lion (rather than sit back and take a few minutes to apply System 2).
However, in situations which deserve a more calibrated approach, these System 1 heuristics can actually be detrimental for our well-being; these complex situations should actually be analysed using System 2. For e.g. if the amount of rainfall in a year is highly correlated with money in your bank account, it would be incorrect to draw System 1 led conclusion that one affects the other without going deeper (also called spurious correlation).
For our readers who’re interested in learning more about such heuristic biases, we highly recommend Michael Lewis’ book ‘The Undoing Project’ (2016).
Now, let’s see these two systems in action using some examples.
Example 1: In the exhibit below, which of the two lines is longer?
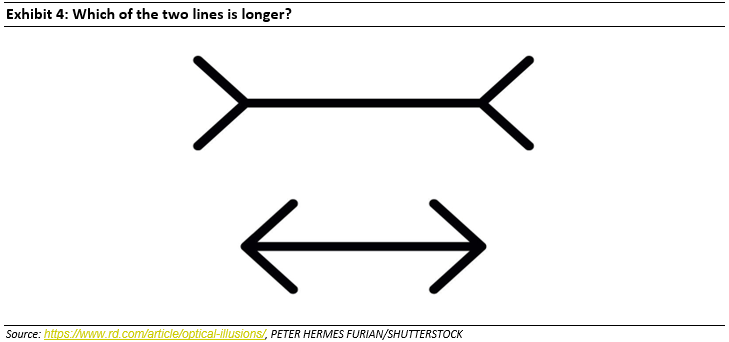
System 1 response: The line on top is longer than the one below.
System 2 response: If you confirm by measuring them with a ruler, the horizontal lines are in fact identical in length.
The first response (System 1) isincorrect. In fact, this is famously called the Müller-Lyer illusion which is caused due to the fins at the end of the lines shown in Exhibit 3. To resist the illusion, you must learn to mistrust your instinctive impressions regarding the length of lines when fins are attached to them and instead employ your rational part of the brain (system 2) to arrive at the correct answer.
Let’s see another example.
Example 2: If one was to again ask you which of the yellow lines is longer, what would be your answer?
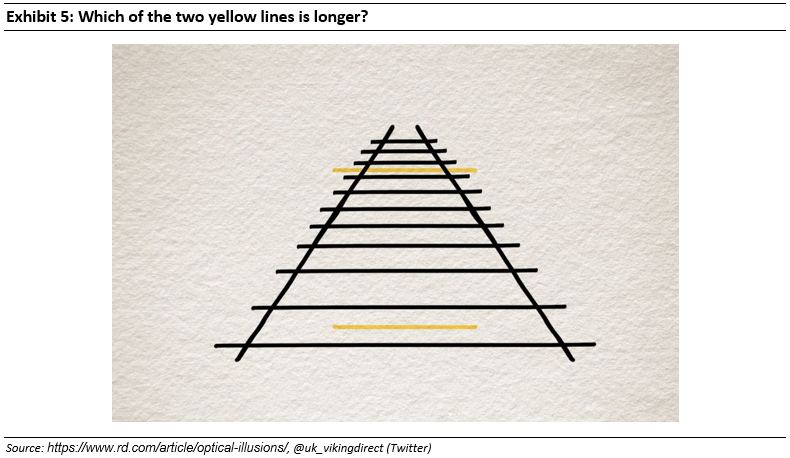
System 1 response: For many, the ‘obvious’ answer is that the line on top is longer.
System 2 response: Again, a geometric ruler breaks this mirage showing both lines are in fact of same length.
In this case the system 1 is fooled due to the impression of a depth plane. Our perceptual system automatically interprets the picture as a three-dimensional scene, not as an image printed on a flat paper surface. In the 3-D interpretation, the line above is both much farther away and much longer than the line below.
The illusion is due to a 3-D heuristic and the substitution of three-dimensional for two-dimensional size—happens automatically for most. While it’s unlikely any of us will be able to ‘unsee’ the perceptual impact, jumping to conclusion without asking the question whether the image is in 2D or 3D (system 2) would lead to the wrong answer.
Example 3: The Bat and Ball problem – Here is a simple puzzle.
The bat costs hundred rupees more than the ball.
How much does the ball cost?
System 1 response: A number comes to mind for most – Rs10. The distinctive mark of this easy puzzle is that it evokes an answer that is intuitive, appealing, and wrong (system 1).
System 2 response: Once you do the simple maths (if the price of ball is x, the equation translates to x + (x+100) =110 or 2x = 10), you will realise the correct answer is Rs 5.
Interestingly, as mentioned in the book ‘Thinking, Fast and Slow’, more than 50% of students at Harvard, MIT, and Princeton gave the intuitive, incorrect answer thus highlighting the hold system 1 has on our thinking and decision-making abilities.
Now, let’s turn towards the more relevant examples from the investment world. Optical illusions exist in the investment world as well and they can be detrimental for your wealth compounding.
Example 4: Based on their historical share price charts, which of the two stocks from the exhibit below would you say have been better investments?
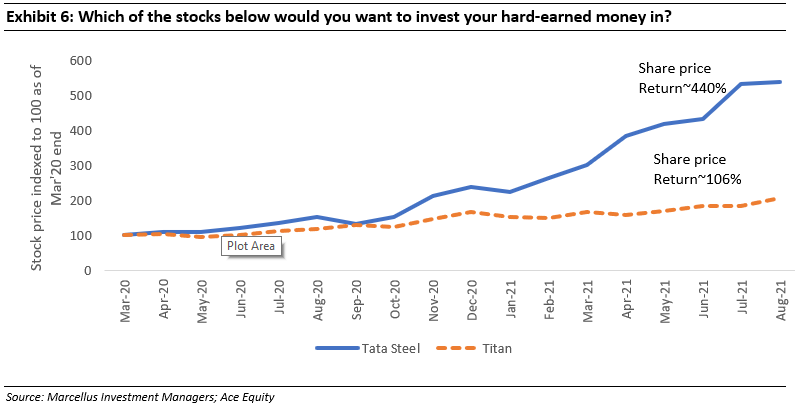
System 1 response: If one was to ask a lay investor which of the above two stocks gets you excited, chances are many (understandably) would say Tata Steel. Over the period referenced above, the returns from Tata Steel were ~4x that of Titan. This is a classic optical illusion which influences investors time and again wherein they pass judgements based on short term share price performance which has been driven by unsustainable tailwinds, rather than relying on long term structural drivers of share price performance.
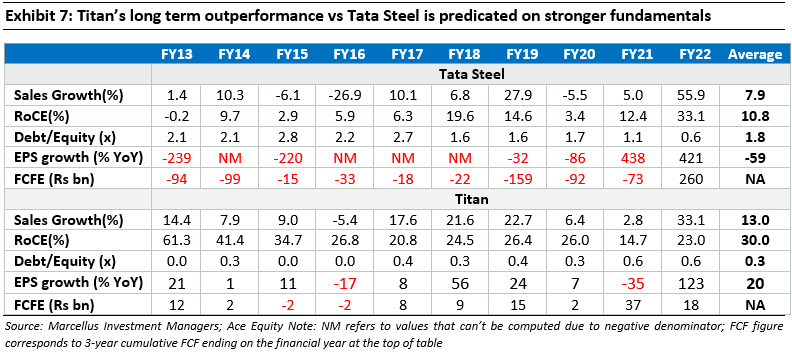
System 2 response: A savvy investor using her ‘system 2’ thinking would instead look at the underlying fundamentals in order to judge the potential for compounding of the two stocks. As can be seen in the table below, there’s a reason why Titan has done much better than Tata Steel over the last decade (stronger growth, superior capital efficiency and a better managed balance sheet).
As a result of it being a fundamentally stronger business, Titan has been able to compound earnings consistently over the years whilst producing free cash flow for the shareholders. Tata Steel on the other hand has mostlydestroyed shareholder value (only single year of positive FCFE generation over last decade)
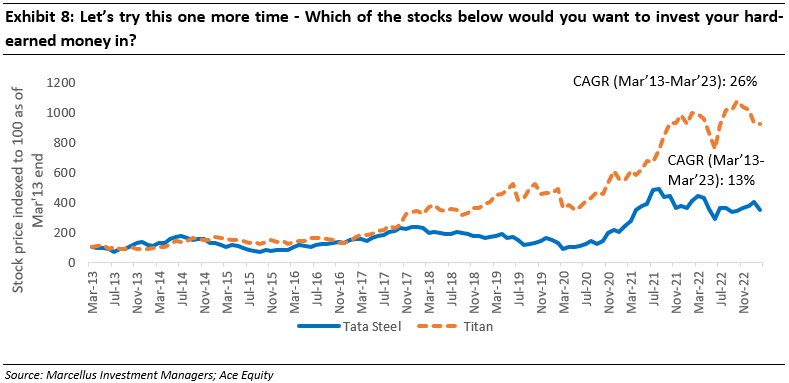
For instance, if one was to look at the above two stocks over a longer time frame of 10 years (Mar’13- Mar’23), the tables turn completely. While Tata Steel would’ve generated returns at 13% CAGR, Titan did so at 2x the rate i.e. 26% CAGR.
It is even more interesting if you overlay the share price charts of Titan and Tata Steel with their P/E multiples charts.
Example 5: The change in trailing P/E multiples during FY22 and it’s interpretation by investors!
During FY22, Titan’s trailing P/E multiple kept hovering between 100x and 180x, compared to its FY17-20 average trailing P/E multiple of 70x. On the other hand, the P/E multiple of Tata Steel compressed from ~10x (which was also its average P/E multiple during the 3-4 years prior to Covid) to ~5x in Oct’21. Does that mean Titan was twice as expensive as it was pre-Covid and Tata Steel was half as expensive as it was pre-Covid?
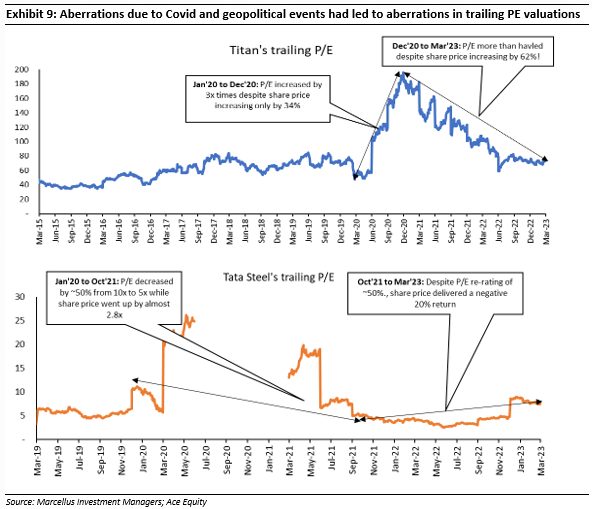
System 1 response: Yes! Titan must have become more expensive due to macroeconomic developments quantitative easing, low interest rates and the share price rally after the Covid-crash etc! And Tata Steel is a great a value buy it seems which just got even cheaper!
System 2 response: No! These are trailing P/E multiples. Titan is a bricks and mortar retailer. During the Covid-induced lockdowns in 2020, Delta-wave in 2021 and Omicron-wave in Jan 2022, it was not allowed to keep its stores open. Hence its trailing EPS fell during Covid and that jacked up its trailing P/E! On the other hand, due to the Russia-Ukraine war, commodity prices sky-rocketed, benefitting commodity producers like Tata Steel. However, steel prices cannot continue going up like this over the long term. Hence, the sharp jump in EPS of Tata Steel is an aberration, rather than being normal [implying that its low trailing P/E is an aberration].
Instead, it is better to look at forward P/E charts of these two companies, which have been much more steady (without the impact of Covid/War led aberrations) and give a better picture than the trailing P/E charts!
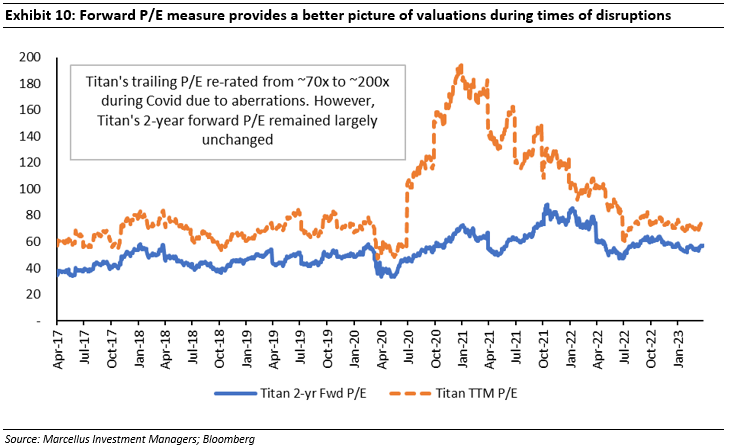
As seen in the chart above, while Titan’s trailing P/E multiple touched sky high of ~200x during FY22, its 2-year forward P/E which ignores one-time aberrations, was largely unchanged compared to its pre-covid range of ~50x. An investor who would have sold Titan in Dec’20 by looking at trailing P/E multiple of 200x would have missed on the subsequent ~60% increase in share price between Dec’20 to Mar’23.
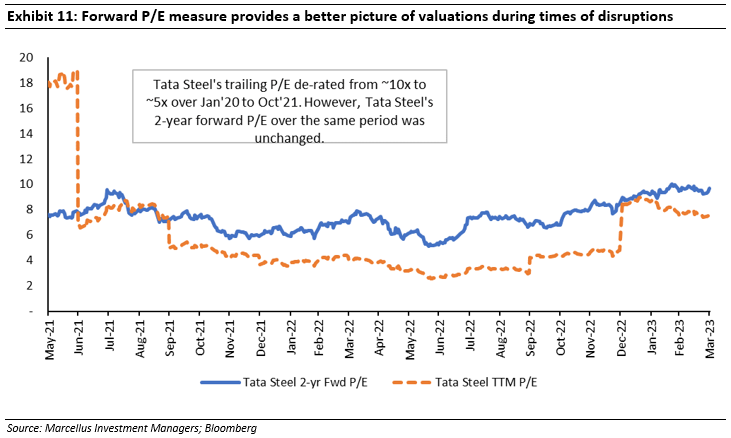
In the case of Tata Steel, while the trailing P/E has dropped sharply from ~15-20x during Mar-May’21 to ~7.5x in Mar’23, its 2-year fwd P/E has increased by almost ~30% from ~7.5x in May’21 to ~10x in Mar’23. An investor who would have bought Tata Steel in Oct’21 when its trailing P/E was ~5x thinking that the valuation has become attractive because P/E has de-rated by 50% would have generated a negative 20% return between Oct’21 to Mar’23.
Example 6: A mathematical illusion of recent drawdowns of any asset price that has compounded at a healthy rate over the long term historically (aka Price value change vs. % change)
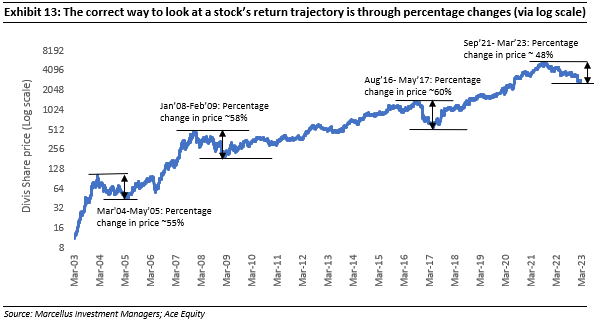
Based on the chart below, do you think the recent drawdown in Divi’s Labs’ share price is the biggest drawdown in its history?
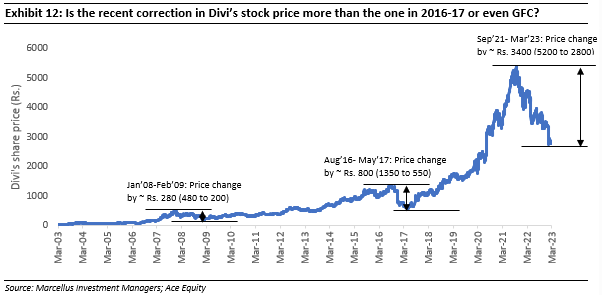
System 1 response: Yes, the recent drawdown is significantly bigger than previous drawdowns experienced by Divis Lab. However, this is an illusion created due to the very increase in stock’s price that has enriched many investors over the years. Let’s see how System 2 deals with the pullback in Divis Lab’s share price.
System 2 response: What matters to an investor is not the absolute price of a stock but rather the ‘change’ in price. Using a logarithmic scale is a way to showcase a stock’s performance on percentage change basis rather than simply price change. Once we do that (see exhibit below) the wide difference between the above instances of correction disappears. In fact, the stock corrected much more on percentage basis from Aug’16-May’17 (~60%) and during the Global Financial Crisis crisis (~58%) vs. ~48% from Sep’21 – Mar’23.
The stronger the long term share price CAGR, the greater is this illusion. For instance, on a 10 year historical chart, this illusion is particularly strong for a stock like Bajaj Finance, and the illusion doesn’t exist for a stock like Castrol India.
This is one of many mathematical illusions that exists in equity investments. Here is another example of a mathematical illusion.
Example 7: Share price recovery after a significant drawdown for a company with strong fundamentals
Consider the two charts below. These charts are of companies which kept compounding their fundamentals consistently before and after the Global Financial Crisis of 2008-09.
|

|


