Most firms hike product prices to offset the impact of inflation in raw material costs and operating expenses. However, several firms in Marcellus’ CCP Portfolio – e.g. Asian Paints, Relaxo Footwears, Abbott India, Dr. Lal Pathlabs – have historically avoided hiking product prices meaningfully. These companies focus on deriving incremental operating efficiencies, thereby negating the need to hike product prices. They like to focus on volume growth whilst leaving no room for competition to disrupt their dominance via price wars. They invest heavily in technology, systems and processes, empowerment of high-quality talent and employee culture to help scale up their business and deepen their competitive advantages. In this newsletter we have provided a framework for assessing price hikes (or lack of price hikes) through the lens of pricing power.
Performance update – as on 31st May 2020
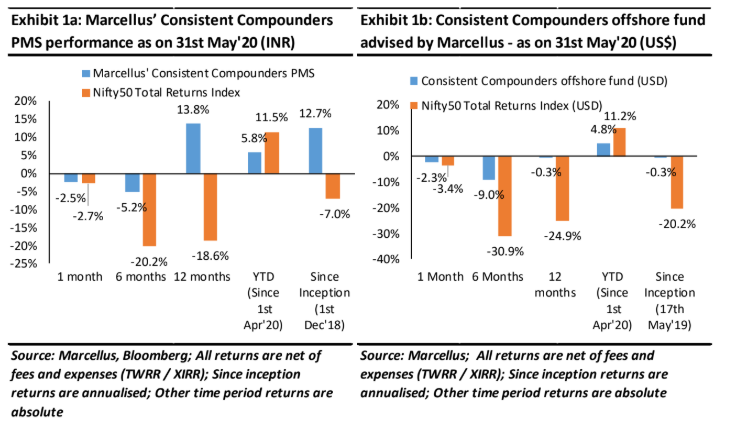
We have a coverage universe of around 25 stocks, which have historically delivered a high degree of consistency in ROCE and revenue growth rates. Our research team of seven analysts focuses on understanding the reasons why companies in our coverage universe have consistently delivered superior financial performance. Based on this understanding, we construct a concentrated portfolio of companies with an intended average holding period of stocks of 8-10 years or longer. The latest performance of our PMS and offshore fund (USD denominated) portfolios is shown in the charts below.
The relationship between price hikes and pricing power
Most firms hike product prices to offset the impact of inflation in raw material costs and operating expenses. Yet, there are other firms which curtail product price hikes for long periods of time. Let us look at a few examples of dominant companies which have avoided price hikes historically:
Bharti Airtel:
Over the period FY07-FY17 (i.e. before Reliance Jio), Bharti Airtel retained its market leadership with a market share of ~23%. Its ARPUs (Average Revenue Per Unit customer) declined at a CAGR of -8% over these 10 years.
Interglobe Aviation:
In the airlines sector, Interglobe Aviation (Indigo Airlines) has grown its market share over the last decade from ~15% in FY10 to ~50% in FY20 with its ‘revenue per passenger’ growing at only 1% CAGR over FY10-20.
Asian Paints:
Asian Paints has dominated the decorative paints industry for several decades with its current market share being 50%. The firm has hiked its product prices on a like for like basis by a CAGR of less than 3% over the past two decades.
Lal Pathlabs:
Dr. Lal Pathlabs is the biggest player in India’s pathology diagnostics industry. The firm has not hiked prices of its diagnostic tests for over four years now.
The common factor across these four examples is clear – these firms have not hiked product prices for several years, despite inflation in various costs incurred by them over the same time frame. However, what is not so clear is the difference in their pricing power. On the one hand, Dr. Lal Pathlabs and Asian Paints have delivered ROCEs (Returns on Capital Employed) in excess of 25% for more than a decade with earnings growth above 20% CAGR – a sign of immense pricing power. On the other hand, Bharti Airtel has delivered ROCEs consistently below 15% with non-existent earnings growth over FY07-17 – a sign of weak pricing power. Let us now dig deeper into the relationship between lack of price hikes and pricing power.
What is pricing power?
The standard definition of high pricing power is the ability of a firm to hike product prices without witnessing attrition in its customer base. However, since most business battles are fought around price cuts, we believe the complete definition of pricing power should be as follows: If an incumbent firm offers a product to its customers at a certain price (say Rs 100), and a new competitor decides to offer a similar product to the same customers at a lower price (say Rs 70) – then can the incumbent retain its Rs 100 product price and also retain its market share? Or will the incumbent need to cut its product prices to defend its dominance? If it is the former, then the incumbent has high pricing power, otherwise not.
Most sectors are highly competitive, and most firms have weak pricing power. For instance, in the airlines sector, the bulk of airline passengers make their choices based on ticket pricing – cheapest wins. Likewise, changing a telecom provider in India has historically been decided by customers predominantly on the back of price – cheapest amongst the top 3-4 players has always won market share from others. For such companies it is easy to understand why they have avoided price hikes for several years – price wars and price led competition doesn’t allow an incumbent leaders with low pricing power to retain their market share whilst also hiking their product prices.
Why do firms with incredibly high pricing power choose to avoid price hikes?
Our understanding of great Indian firms with high pricing power suggests that typically, their competitive advantages are related to one or more of the following factors – product differentiation, supply chain efficiencies, brand, superior technology, greater understanding of the customer, regulatory environment, handling of raw materials, or other such factors. However, to sustain, strengthen and scale up these competitive advantages, most such great firms also have some common underlying ingredients which define their DNA. These ingredients usually include a sharp focus on systems and processes, operational efficiencies, high quality board of directors, empowerment of professionals, tech investments, and a propensity to avoid price hikes as much as possible. Lack of price hikes helps these great firms further suffocate their competitors and deepen their own competitive advantages due to a combination of the following factors:
-
The ‘volume-game’:
One of the biggest opportunities available for a business in India is around scale – even in some of the most basic utility oriented categories like footwear and undergarments, there is a long runway of growth available before the category growth stagnates. Curtailed price hikes help make products of a company more affordable over time and hence accelerate penetration of the product across geographies (tier 3 / 4 / 5 cities or rural India) and across socio-economic strata. Scaling up such a business through volume-growth rather than through price hikes, increases the complexity of the operation in areas like supply chain, manufacturing, manpower management, etc. These complexities, if addressed through systems / processes / institutionalized operational execution etc, become an added source of competitive advantage for such firms. One of the best examples of this in our portfolio is Relaxo Footwears which manufactures and sells more than 20 crore pairs of footwear per year (5.5 lakhs pairs per day!) at an average price of Rs 130 per pair. Despite footwear being one of the most labour intensive manufacturing processes, Relaxo employs its entire labour workforce (rather than using contract labour) and runs an in-house manufacturing process (rather than outsourcing). The firm also distributes its products through distributors rather than wholesalers. A recent press article highlighted (click here) – “Within the company there was a view that if we increased volumes, profits would come automatically. Accenture taught us that profitable growth has to be an end in itself,” says Ritesh Dua. He cites the example of its Sparx range of footwear, which was struggling to grow. The advice given to the company was that prices needed to be cut by 20 percent, so they went about reengineering the product and the way it was manufactured. The re-launched Sparx has been a huge success.
-
Focus on incremental operating efficiencies:
Such firms consistently derive incremental operating efficiencies through investments in technology, systems and processes or economies of scale. These operating efficiencies help offset the adverse effect of inflation in raw material and operating cost, and hence negate the basic need to hike product prices. If competitors cannot match the quantum of such incremental operating efficiencies, they get suffocated because of lack of price hikes from the market leading competitor. Asian Paints is a great example of this given its consistent improvements in manufacturing processes, raw material vendor management, backward integration and an efficient supply chain execution which have helped it maintain strong margins and ROCEs with minimal product price hikes of 2%-3% CAGR (see our 1st May 2020 newsletter for a case study on Asian Paints).
-
Ability to absorb regulatory changes like price-controls:
There are several industries like pharma and healthcare (diagnostics) where product prices are capped by regulatory intervention. Such moves by regulators destroy the profitability of many of the players in these sectors. Great companies in such sectors use such regulatory headwinds to their advantage by scaling up volumes at lower prices to deliver a highly profitable and sustainable solution which is difficult for competitors to replicate. One such example from our CCP portfolio is of Abbott India with its product Thyronorm.
In FY2010, GSK’s Eltroxin was the market leading drug for treating hypothyroidism with ~ 50% market share and Abbott’s Thyronorm had about 40% market share. The market size was around US$7 mn. Between 2011 & 2014, Government of India introduced National List of Essential Medicines, 2011 and Drug Pricing Control Order 2013. Both these regulations led to 20-25% decrease in the selling price of Eltroxin and Thyronorm. Following this, GSK slowed down it investments behind the brand Eltroxin due to the reduced margins available on this product. Abbott India on the other hand, doubled down on increasing market share of Thyronorm. In 2011, it launched its Think Thyroid Think Life Campaign in association with Indian Thyroid Society under which it worked on increasing awareness about Thyroid disorders, conducted over 5,600 camps for thyroid screening, created brand team to increase the knowledge base of primary physicians and gynaecologists, conducted academic programs – ‘thyroid update’ which covered 4,000 doctors. It also created a sales team, known as the “Thyroid Activation Team,” worked with healthcare professionals in rural communities throughout India to test women for hypothyroidism. When the disease was detected, the patient was told how Thyronorm would manage their symptoms and was directed to the local pharmacy to obtain the drug. The endorsement by healthcare professionals, coupled with Thyronorm’s low price, reduced the likelihood that the patient would seek alternative treatments. In addition, Abbott India differentiated Thyronorm by creating combination drugs that added vitamins or supplements, for example, Thyronorm Plus Iodine or Thyronorm with calcium. These versions of Thyronorm addressed deficiencies that often occurred in women with hypothyroidism (source: Kellogg School of Management case study). As a result of its focus on Thyronorm brand, Abbott is the market leader in hypothyroidism segment with market share of ~ 52% (FY2019) when the market size has increased to ~US$ 99 mn. Thyronorm’s sales have grown at 33% CAGR over the past 10 years (FY10-FY20). GSK’s Eltroxin’s market share is down to only 27% now.
-
Ability to remain unaffected by price wars:
From 2016 to 2018, Thyrocare triggered price war by offering diagnostic tests at 30-50% cheaper price compared to those of incumbent leaders like Dr. Lal Pathlabs. Similarly, paint companies like Jotun (Norway’s largest paint player) over the last 10 years, and Sherwin Williams (world’s largest paint player) over 2006-2011 have offered dealer margins substantially more attractive than what Asian Paints offers. An incumbent leader can remain unaffected by such price wars only if the combination of robust competitive advantages and historically curtailed price hikes results in: a) customers continuing to stick to the incumbent leader despite cheaper offerings from a new competitor; and b) price wars being unaffordable for new competitors. For instance, the velocity of Asian Paints’ supply chain ensures that most paint dealers in the country get more than 3 deliveries each day across several thousand SKUs in a voluminous product. This is central to the firm’s competitive advantage and a higher dealer margin or lower priced product offered by Asian Paints’ competitors did not make it easy for dealers or painters to prefer competitors’ products over Asian Paints’ products.
Investment implications
The relationship between ‘price hikes’ and ‘pricing power’ can be summarized through a 2 x 2 matrix shown in the exhibit below.
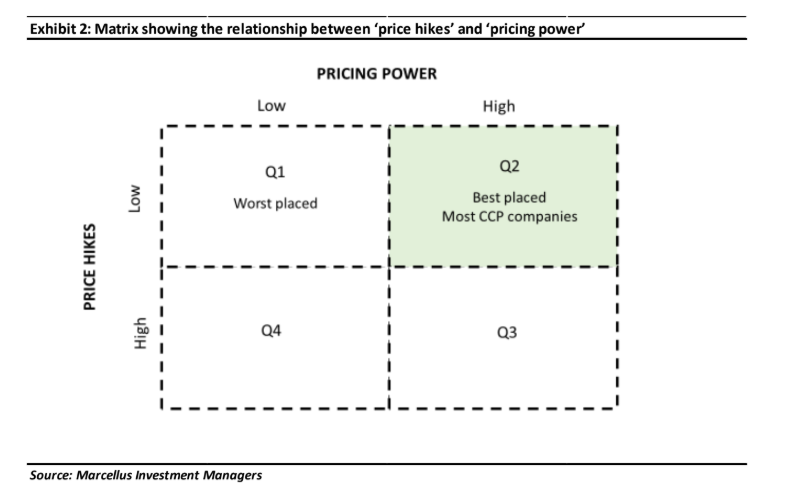
Firms in quadrant 1 (top left) are worst placed on this exhibit. These companies have low pricing power and that forces them to sacrifice profitability in the face of intense price-led competition. They could be price followers and one of their competitors sits in quadrant 2 with high pricing power who keeps suffocating the weaker players by limiting product price hikes (e.g. most smaller competitors of Relaxo Footwears or Asian Paints). Or it could be an industry where even firms with dominant market share do not have enough pricing power and hence the only way for the market leader to avoid losing market share is to avoid price hikes (e.g. telecom or airline industry in India over the past two decades).
Firms in quadrant 2 (top right) are best placed on this exhibit. Several of our portfolio companies fall in this quadrant. They are market leaders (or on the way to become market leaders) with high pricing power backed by sustainable competitive advantages. These firms sell small ticket day to day essential products and have a habit of avoiding price hikes whilst ensuring that their ROCEs (margins as well as asset turns) are supported by incremental operating efficiencies. They like to focus on growing their businesses through volume growth whilst leaving no room for competition to disrupt their dominance via price wars. They invest heavily in technology, systems and processes, empowerment of high-quality talent and employee culture to help scale up their business and deepen their competitive advantages.
Firms in quadrant 3 (bottom right) are likely to have reduced sustainability of their competitive advantages compared to firms in quadrant 2. If these firms in quadrant 3 are selling day to day essential products consumed by the masses, their approach towards price hikes could eventually dilute their pricing power. Their products will either become unaffordable and hence unsuccessful in scaling up, or else once scaled up, they will attract competition which might disrupt their ROCEs by offering lower price points on similar products. However, there are some exceptions to this hypothesis in quadrant 3. Firms which have built a rare strategic asset (e.g. a patented product) which makes the demand for their products price-inelastic, might be able to sustain their pricing power despite hiking product prices for long periods of time.
Firms in quadrant 4 will either quickly move towards quadrant 1 or they will fail to grow sustainably. They don’t have pricing power and their price hikes make it easier for competitors to offer a better proposition their customers.
In some of our previous publications (22nd Mar’19 blog) we have defined three categories of companies in the listed universe – Type A, Type B and Type C. Companies which fall under Type A (telecom, airlines), are usually present in quadrant 1 shown in the exhibit above. Type C (Pidilite, HDFC Bank, Dr Lal Pathlabs, Relaxo, Asian Paints) companies are usually present in quadrant 2 and sometimes in quadrant 3. Companies which fall under Type B (e.g. Maruti, HUL) oscillate between quadrants 1, 3 and 4 as they go through different phases of their business evolution.
Note: Pidilite, HDFC Bank, Dr Lal Pathlabs, Relaxo, Asian Paints and Abbott Labs are part of most Marcellus’ portfolios.
Regards
Team Marcellus
If you want to read our other published material, please visit https://marcellus.in/
Note: the above material is neither investment research, nor investment advice. Marcellus does not seek payment for or business from this email in any shape or form. Marcellus Investment Managers is regulated by the Securities and Exchange Board of India as a provider of Portfolio Management Services and as an Investment Advisor.

