OVERVIEW
POPULAR ARTICLES

P/E multiples are deceptively damaging for anyone seeking long term gains from equity investments. If we take the 21 stocks which have had consistently “high P/Es” over the past 13 years, their median compounded returns have been 17% p.a. (vs the Nifty’s total return of 11% p.a.). Furthermore, if we were to look at a subset of these high P/E companies (13 out of 21) which were undervalued by around 50% (based on our DCF valuation in 2010), they have compounded at an even more impressive rate of 21% p.a. between 2010 and Dec 2022.
“Over the long term, it’s hard for a stock to earn a much better return than the business which underlies it earns. If the business earns 6% on capital over 40 years and you hold it for that 40 years, you’re not going to make much different than a 6% return — even if you originally buy it at a huge discount. Conversely, if a business earns 18% on capital over 20 or 30 years, even if you pay an expensive-looking price, you’ll end up with one hell of a result.” – Charlie Munger (1994), speech at the University of Southern California.
How I learnt to ignore high P/E multiples
We were entering the closing months of 2010 and I was still a young stockbroker plying my trade in the Indian stock market when I received a phone call from a client in London who wanted to buy $30 million worth of Berger Paints stock. Overjoyed at getting such a large block trade, I swiftly identified another client in Singapore who had purchased Berger Paints five years ago and had seen the stock double on him. Taking the overnight flight to Singapore, at 10am next morning I was sitting in front of the owner of $30mn worth of Berger Paints shares.
After gulping down my first cup of coffee, I made the “sell” pitch which had worked for me hundreds of times before: “Sir, not only have you doubled your money with your investment in Berger Paints, the stock is now trading at a trailing P/E of 28x compared to the Nifty’s P/E of 23x. Berger’s earnings growth tends to slow down when crude oil prices rise and I don’t need tell you that crude oil prices have doubled over the past year.”
Confident of getting the $30mn block, I then sat back and let my time-tested pitch – which was a play on three different behavioural biases that investors display (loss aversion, anchoring, mental accounting) – sink in. The Singaporean investor gave back as good as he got and in doing so, he laid the foundations of the investment philosophy which would one day characterise Marcellus.
He began by asking me “At what rate has Berger grown EPS and Free Cashflows in the decade gone by?” 17% and 20% per annum respectively was my response.
“Now, let’s assume that in the coming decade Berger grows earnings at just 20%. Assume further that Berger’s P/E multiple halves in the coming decade. At what rate will my investment in Berger compound over the coming decade?”
I did the mental maths (20% Free Cashflow growth less 7% to account for the halving of P/E over a decadal period) and blurted out the answer: 13% per annum. The investor supplemented my answer by saying, “If I add to that the dividend Berger pays out, I reckon that I will compound my Berger investment by at least 15% per annum in the coming decade.”
Now came the sucker punch from the Singaporean Zen Master, “Do you know of any other stock where I can get 15% per annum returns over the next ten years with this degree of certainty? If you do, then I would be happy to sell my Berger Paints and buy this other stock.”
The Singaporean investor did well to not sell Berger Paints on the back of short terms earnings pressure and optically high P/E multiples. Over the next ten years, Berger Paints’ share price grew 25x (Rs 20 to Rs 500). The Singaporean investor’s Berger Paints position I reckon is now worth close to $500 mn.
Focus on high quality compounders, rather than agonise about high P/E
Back in 2010, I was blown away by this simple yet profound way of thinking about investing large sums of money over long periods of time. To sell a high-quality compounder whose business is consistently growing at around 20% per annum means essential letting go of a stock which – even with a heavy P/E derating – will earn you market beating returns (which is the point that the Charlie Munger quote at the beginning of this note emphasises). So, over the past few months as there has been plenty of angst in the Marcellus client base in light of our underperformance over the past three years (as the P/E multiples of many of our investments have cumulatively corrected by 30% over the past couple of years – see our 6th March newsletter: CCP valuation multiples correct 30% whilst fundamentals continue to compound at over 20% per annum), I went down memory lane and put myself in 30th June 2010.
Standing in June 2010, I then pretended that I had perfect foresight and dug out the names of the 21 non-lending BSE500 stocks whose trailing P/E has been “high” (i.e. above 30x) 80% of the time between June 2010 and Feb 2023. I began by inspecting the earnings, cashflows and share price performance of these 21 “high P/E” stocks – see table below.
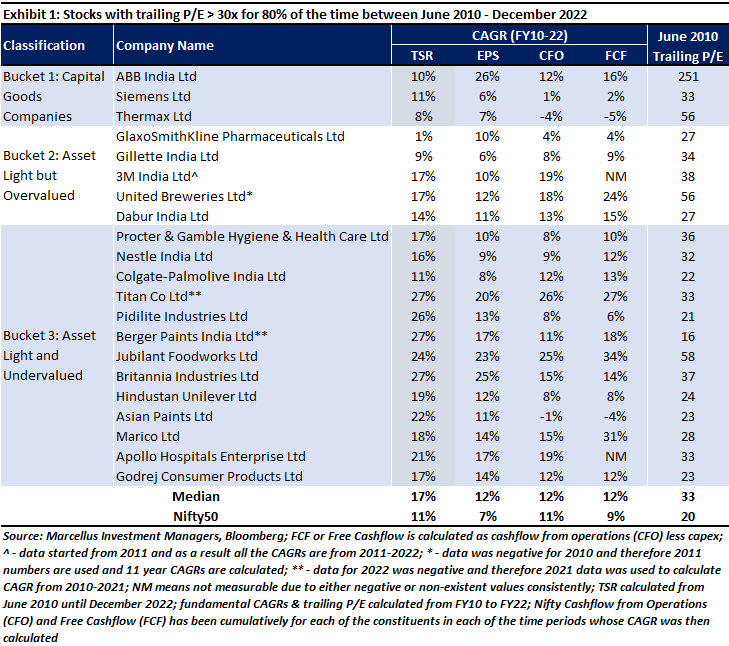
What is noteworthy about the table shown above is:
- 15 out of the 21 high P/E stocks have beaten the Nifty’s total return of 11% since 30th June 2010 even though their P/E is very significantly above that of the Nifty (33x vs 20x).
- Nifty’s Earnings and Free Cashflow (excluding Financials) growth over the past 13 years has been 7% and 9% respectively whereas the “high P/E” stocks’ median Earnings and Free Cashflow growth has been 12% and 12% respectively.
The second of these two bullets is critical to sustained share price outperformance of the high P/E stocks because the value of a company is driven by its ability to grow cashflows, NOT earnings. Since the stock market (incorrectly in our view) focuses on earnings and P/E multiples, it loses sight of the main metric which drives compounding. For example, between 2010 and 2020, Astral Poly’s profits grew 9x (24% per annum) and its share price grew 60x. So, a lot of investors started calling Astral a “high P/E” stock. But over this ten-year period (2012-22), Astral’s Free Cashflows grew >50x as well. So, investors who were focusing on Astral’s cashflows, and not earnings, got to benefit from the >50x compounding in this dominant CPVC manufacturing franchise.
Given that vast majority of the 21 high P/E stocks have compounded significantly faster than the broader market since 2010, the obvious inference is that these stocks were undervalued in 2010. So just how undervalued were these stocks in 2010?
I went back to 2010 and with the benefit of hindsight downloaded the data on the profits and capital employed by these high P/E companies in the years between FY11 and FY22. Having done that, I could calculate Economic Value Added (EVA) each year by these companies as:
EVA = Net operating profit after tax – (cost of capital x capital employed)
Then the fair value of each of these companies became:
Fair value = Present Value of EVA for each year.
Using a cost of capital of 12% and assuming a perpetual growth of 5% p.a. post FY23, I was able to estimate the fair value of these companies as if I was standing in June 2010. The comparison between the fair value of these stocks in 2010 and their market value at that time is given in the table below. As you can see, the stock market in 2010 was basically offering you most of these high P/E companies at a 50% discount to fair value.
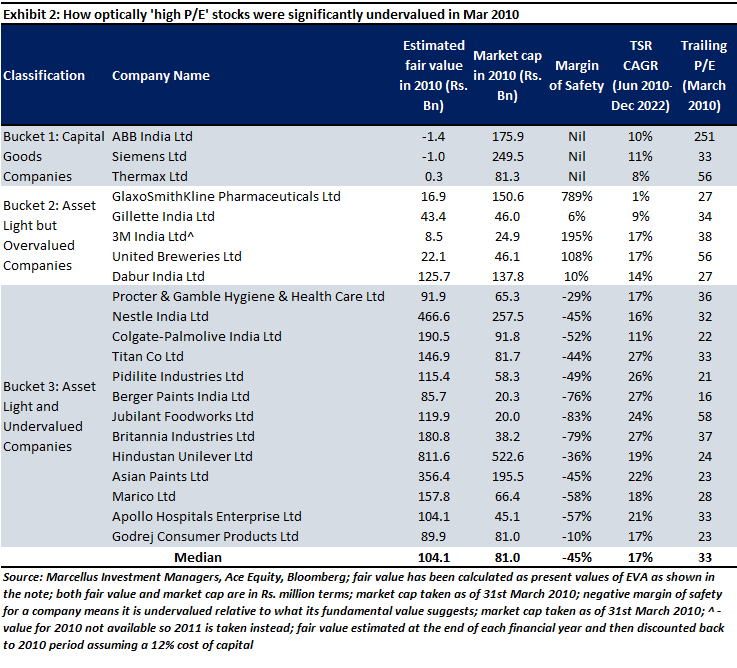
Exhibit 2 separates the high P/E stocks into 3 buckets:
- Bucket 1 consists of three capital goods companies – ABB India, Siemens, and Thermax – who generated negative or zero Economic Value add i.e., these two firms’ operating profit net of taxes was less than their opportunity cost of the capital. The low fair value of these firms had much to do with the decade long capex downturn that gripped India from FY11-22. As a result, with perfect foresight in June 2010, one can see that these firms were actually not worth much even though the stock market was valuing these firms at billions of dollars. So, bucket 1 is made up of three companies whose fair value was negligible in 2010.
- Bucket 2 is made up of five companies – Glaxo Smith Kline Pharma, Gillette India, 3M India, United Breweries, and Dabur – that the stock market either valued fairly or more than fairly. Interestingly, all five of these companies are asset light FMCG or consumer-facing companies.
- Bucket 3 consists of 13 asset light consumer facing and/or FMCG companies which the stock market significantly undervalued in 2010. What’s remarkable is that with the exception of one company (Godrej Consumer), the extent to which the stock market undervalued these relatively stable franchises like Nestle, Asian Paints, Berger Paints, Pidilite, Procter & Gamble Hygiene, Titan, HUL, Britannia, Marico, and Apollo Hospitals ranged from 29% to 58%.
So why does Bucket 3 exist i.e., why does the stock market so radically undervalue stable, well understood, well established franchises?
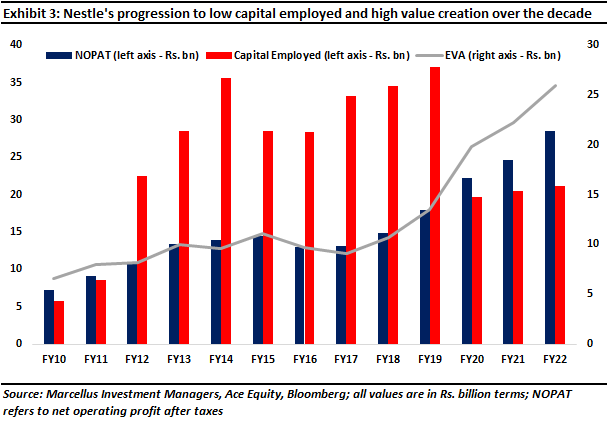
To understand this market inefficiency better, let’s look at the one of the most stable listed businesses in the Indian stock market, Nestle India. In June 2010, the market was offering Nestle at a market cap of Rs 257 bn whereas basis the results that followed over the next 13 years, Nestle’s fair value (as per our DCF estimate using EVA) was Rs 467 bn.
Note that by its historical standards, Nestle has NOT had a spectacular 13 year run between FY10-22: earnings and Free Cashflows have grown at a mere 9% and 11% p.a. respectively. What this goes to show is that it is not blowout results which deliver sustained wealth creation; it is the consistency of solid performance across long periods of time which the stock market undervalues. In specific, if you look at the chart below, it is Nestle’s surging EVA post FY17 which the stock market failed to appreciate back in June 2010.
An even simpler way to understand how the stock market undervalues companies which compound over several decades is to open an Excel spreadsheet and conduct the simplest of valuation exercises. If a company generates FCF of Rs 100 today and it grows that Rs 100 at 20% per annum for 20 years and thereafter shifts down to 5% per annum growth forever, then (using a 12% discount rate), you will find that the fair value of that company is Rs 9000 i.e., the fair value P/FCF is 90x.
How can investors avoid mistakes like Nestle, Asian Paints, Berger Paints, Pidilite and Titan?
Back in 2010 I was not smart enough to appreciate that a company’s P/E multiple tells you very little about its ability to create wealth going forward. As I grew older and then co-authored books with my colleagues like ‘Unusual Billionaires’ (2016), ‘Coffee Can Investing’ (2018) and ‘Diamonds in the Dust’ (2019), I realised that the secret to long term wealth creation lies in one metric: ROCE.
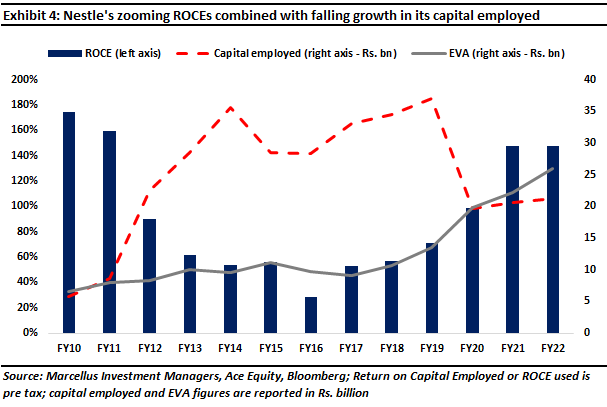
The higher the ROCE of a company, the greater its ability to create EVA and shareholder value. Why? Because the spread between ROCE and the cost of capital is the surplus a company a generates. The higher the ROCE, the bigger this surplus is and when reinvested efficiently year after year, this reinvested surplus snowballs to create wealth for shareholders. Exhibit 4 below demonstrates this process for Nestle. Nestle’s capital employed starts rising from FY12 onwards. Then with a four-year lag, the firm’s investment (in capital employed) bears fruit and Nestle’s EVA starts moving upwards. Post Covid, several of our investee companies, including Nestle, have begun a similar capex upcycle – see https://economictimes.
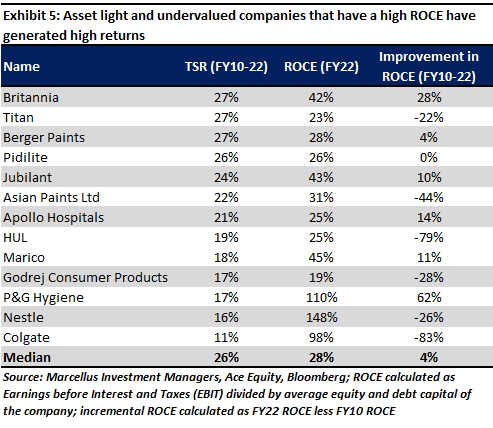
In fact, if you take the ‘optically high P/E’ stocks and look at their improvement in ROCE between FY10-22, you will see that the greater that improvement, the more shareholder returns the company generated in the last 13 years. And whilst there are a few exceptions here, the key point to note is that if you are generating a ROCE well beyond the cost of capital, even if there has been a decadal decline in ROCE, the share price compounding for such companies usually is substantially high. This is shown in Exhibit 5. The logic behind this is explained in our Oct 2022 note (P/E Multiples are Deceptively Dangerous) which showed that “A stock trading at a P/E multiple of 50x could be cheaper than one trading at 15x P/E multiple, even if both stocks deliver the same profit growth. This is possible due to factors such as superior capital efficiency (measured by Return on Capital Employed) and greater longevity of free cashflow compounding.”
|
If you want to read our other published material, please visit https://marcellus.in/blog/
Note: the above material is neither investment research, nor investment advice. Marcellus does not seek payment for or business from this material/email in any shape or form. Marcellus Investment Managers Private Limited (“Marcellus”) is regulated by the Securities and Exchange Board of India (“SEBI”) as a provider of Portfolio Management Services. Marcellus is also a US Securities & Exchange Commission (“US SEC”) registered Investment Advisor. No content of this publication including the performance related information is verified by SEBI or US SEC. If any recipient or reader of this material is based outside India and USA, please note that Marcellus may not be regulated in such jurisdiction and this material is not a solicitation to use Marcellus’s services. This communication is confidential and privileged and is directed to and for the use of the addressee only. The recipient, if not the addressee, should not use this material if erroneously received, and access and use of this material in any manner by anyone other than the addressee is unauthorized. If you are not the intended recipient, please notify the sender by return email and immediately destroy all copies of this message and any attachments and delete it from your computer system, permanently. No liability whatsoever is assumed by Marcellus as a result of the recipient or any other person relying upon the opinion unless otherwise agreed in writing. The recipient acknowledges that Marcellus may be unable to exercise control or ensure or guarantee the integrity of the text of the material/email message and the text is not warranted as to its completeness and accuracy. The material, names and branding of the investment style do not provide any impression or a claim that these products/strategies achieve the respective objectives. Further, past performance is not indicative of future results. Marcellus and/or its associates, the authors of this material (including their relatives) may have financial interest by way of investments in the companies covered in this material. Marcellus does not receive compensation from the companies for their coverage in this material. Marcellus does not provide any market making service to any company covered in this material. In the past 12 months, Marcellus and its associates have never i) managed or co-managed any public offering of securities; ii) have not offered investment banking or merchant banking or brokerage services; or iii) have received any compensation or other benefits from the company or third party in connection with this coverage. Authors of this material have never served the companies in a capacity of a director, officer or an employee.
This material may contain confidential or proprietary information and user shall take prior written consent from Marcellus before any reproduction in any form.