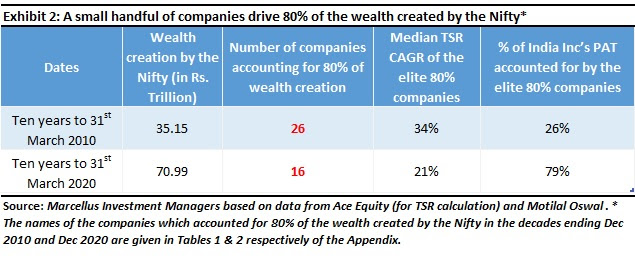
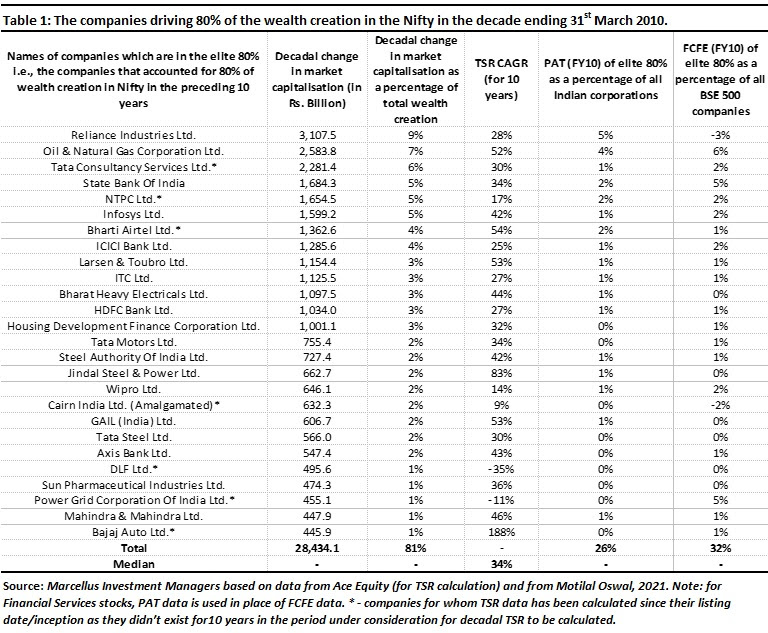
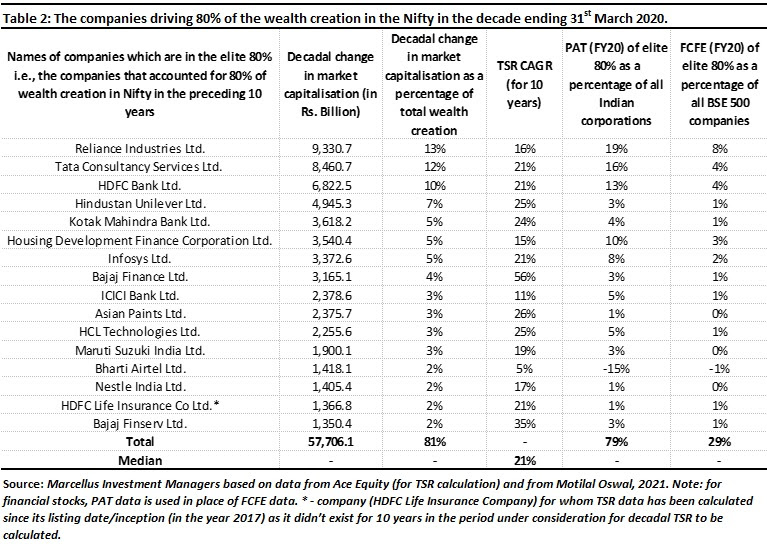
As the table above shows, wealth creation by Nifty companies is being driven by fewer and fewer companies that account for 80% of the wealth creation in the stock market. A decade ago, the 26 companies which accounted for 80% of the decadal wealth creation in the Nifty (in the decade ending Dec 2010) accounted for just 26% of India Inc’s PAT. Now, if we look at the 16 companies which have driven 80% of the decadal wealth creation in the Nifty in the decade ending 31st December 2020, they account for 79% of India Inc’s PAT.
In fact, polarization in the Indian stock market, therefore, has THREE separate dimensions:
- A handful of companies – precisely TEN – are now taking home almost the entire PAT generated by the Indian stock market – see Table 3 in the Appendix. This profit concentration in the hands of the top 10 companies has quintupled in the past decade and it has nothing to do with Quantitative Easing (QE) by central banks.
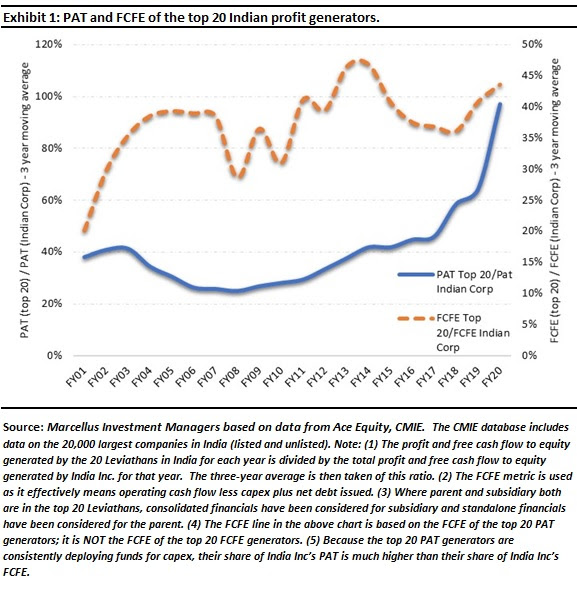
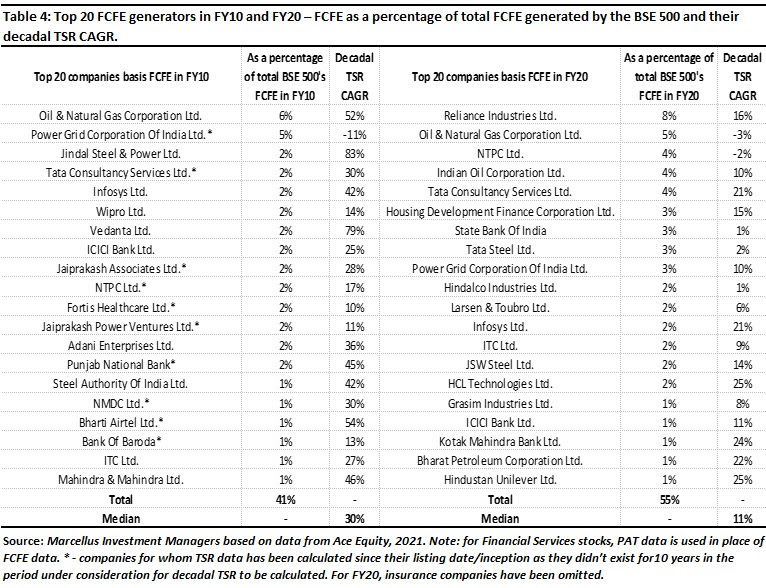
- Fewer and fewer companies – precisely TWENTY – now account for around 55% of the Free Cashflow to Equity generated by the Indian stock market. A decade ago, the top 20 Free Cashflow generators accounted for around 41% of India’s FCFE – see Table 4 in the Appendix. Once again this has nothing to do with QE.
- A mere SIXTEEN companies have accounted for 80% of the wealth created by the Nifty in the decade ending Dec 2020. In comparison, 26 companies accounted for the same proportion of the wealth created by the Nifty in the decade ending December 2010 – see Tables 1 & 2 in the Appendix.
The drivers of polarization in the Indian stock market
So why is this happening? Two different dynamics – one Indian and one global – are at play here. We begin by highlighting the Indian dynamic at play which is the networking of the Indian economy over the past decade.
A networked economy helps more efficient companies
In our 1st March 2019 blog Exit the Kirana Store, Enter the Supermarket we had highlighted how over the past ten years, the length of roads in India has increased from 3.3 million km to 5.9 million km (CAGR of 6%). The number of mobile phone subscribers has increased over the same period from 392 million to 1161 million (CAGR of 12%). The number of broadband users has increased from 6 million to 563 million (CAGR of 57%). A decade ago, around 44 million Indians were taking flights each year. Now 3x as many Indians are flying each year (CAGR of 13%). 15 years ago, only 1 in 3 Indian families had a bank account; now nearly all Indian families have a bank account.
As a result of this networking of the Indian economy, efficient companies with strong distribution systems have pulled away from regional & local players. For example, as the economy gets integrated, lending, which was once dominated by regional players is now seeing the emergence of a few national leviathans like HDFC Bank and HDFC with both lenders entering the list of top 20 PAT generators over the last 10 years.
The global dynamic is the rise of affordable, easy-to-use enterprise technology which if implemented increases profit margins, reduces working capital cycles, and increases asset turnover. We now describe how India’s best compounders are using technology to create wealth for Marcellus’ clients.
Sunk costs drive industry concentration
In 1991, John Sutton of the London School of Economics wrote a prescient book titled ‘Sunk Costs and Market Structure’ which foresaw how the application of modern marketing techniques, of R&D, and of technology was leading to polarization of profits. Sutton said that companies which invest in brand building, in R&D – basically, invest in intangible assets (something that cannot be physically touched or felt) which are critical sources of competitive advantage – go on to dominate that industry provided, of course, intangible assets are a source of competitive advantage in that industry i.e., this theory is not applicable to sectors like cement and steel where intangibles confer little by way of competitive advantage. The technical name of such investments in intangibles is “Endogenous Sunk Costs” (ESC) and Sutton said that in absence of ESC, an industry would see tough price-based competition [which is exactly what we see in sectors like steel, cement, construction, and wherever else intangibles don’t matter].
Companies that invest in technology benefit from increasing returns to scale
Sutton’s book was followed by a remarkable paper published in 1996 in the Harvard Business Review by Brian Arthur. Titled ‘Increasing returns and the new world of business’, Arthur highlighted that the conventional idea of diminishing returns to scale is being replaced by businesses that are generating increasing returns to scale. Increasing returns basically mean the tendency of returns (on the goods produced or the services provided) to keep increasing as output increases whereas diminishing returns imply the opposite. In Arthur’s words: “As the economy shifts steadily away from the brute force of things into the powers of mind, from resource-based bulk processing into knowledge-based design and reproduction, so it is shifting from a base of diminishing returns to one of increasing returns. A new economics—one very different from that in the textbooks—now applies, and nowhere is this more true than in high technology. Success will strongly favor those who understand this new way of thinking.”
Tying this idea to what Sutton had said in 1991, several management gurus then pointed out in the years that followed that the nature of goods that are produced has changed radically from being bulk-produced and process-driven to increasingly being technology-driven and customized to a greater extent. This enables a positive feedback loop in the economy where one set of, say algorithms, once developed by someone can be applied to numerous other functions by tweaking them slightly at no extra cost, essentially making the idea of the marginal cost of production (the cost to produce one additional unit) redundant. Therefore, once returns start accruing for such companies, they continue to grow over time at an increasing rate. Furthermore, network effects (for example, the compatibility of software with hardware and its development) kick in along with customers, who after some initial training, need only adapt a little as the products update, further strengthening the positive feedback loop.
Growth in profitability is increasingly NOT related to traditional Capex
Jonathan Haskel & Stian Westlake then developed this line of thinking further in their 2017 book “Capitalism Without Capital”. The central theme of the book is that corporate investments, in the past 40 years especially, have become increasingly intangible rather than tangible. Aggregating data for the developed world, the authors show that around the turn of the century, the developed economies started investing more in intangibles (which traditional accounting techniques do NOT capture as Capex) and less in tangibles (like factories & machines). The pre-eminence of intangible investing according to the authors have brought to the fore four effects that intangible assets showcase:
- Scale (intangibles are easily scalable to any length once developed initially),
- Sunk costs (intangibles have sunk costs tied to them i.e., costs that cannot be recovered),
- Spillovers (a company that makes an investment in intangibles may not be the only one, or not even the one to reap its benefits fully later; they are more often than not reaped by others), and
- Synergies (multiple intangible assets may collectively produce even higher returns than what they would produce individually).
These four effects are crucial for a company to become a consistent compounder because once a company scales using intangibles assets (such as a proprietary database), it can then extract spillovers from other companies’ investments in intangibles (such as a third party software platform like SAP), and then create synergies between intangible investments (the proprietary database feeds the SAP with big data) which can potentially help the company corner the entire industry (first in its home market and then in the global market).
A case study of compounding driven by intangibles and networks
Let’s take a case study which we have written about in “The Unusual Billionaires” (see Chapter 2) and which illustrates beautifully, in the Indian context, Sutton’s, Arthur’s, Haskel & Westlake’s theories. In 1970, Asian Paints invested Rs. 8 crores in the first supercomputer to be purchased by a private-sector enterprise in India. That is the ‘sunk cost’ in this instance. Asian Paints then used this computer to collect detailed data on paint demand – across its vast dealer network, for every colour, for every truckload delivered to every dealer. As a result, Asian Paints’ management developed greater familiarity with understanding and managing data than any other paint company in India. Through the 1980s, 90s, and through to the current day, they fed this data into increasingly sophisticated software platforms such as SAP which helped them predict demand, time their raw material purchases and manage their inventory and production cycles such that the company’s working capital cycle in its decorative business (i.e., receivables + inventory – trade payables – other current liabilities) shrank to a mere six days in FY19 from a hundred days 25 years ago.
A super crunched working capital cycle gave Asian Paints a massive competitive advantage and far superior free cashflows (7-9x more) compared to its competitors. Asian Paints re-invested these cashflows in expanding capacity (which has grown 15-fold in the last 25 years) and in further technology investments. For example, Asian Paints has used technology to optimize the cost and availability of raw material which forms around 60% of its total cost. More recently, the company forayed into the larger Home Décor space and offered 3D visualization technology at its ‘Beautiful Homes’ stores to help customers make a more informed choice. This blog on Cognizant’s website (click here) from 2018 nicely explains how Asian Paints has transformed various aspects of business through the use of technology.
This dynamic creates a synergistic spiral which makes it impossible for Asian Paints’ competitors to compete with the firm (i.e., Asian Paints has better tech and more data and hence better cashflows which in turn leads to greater tech investments from Asian Paints which in turn leads more cash flow and so on). Having grown Free Cashflows 74x in the last 20 years (i.e., 24% CAGR), Asian Paints is in the elite value creation table for the last ten years – see Table 2 in the Appendix. Those who don’t understand how tech works in the modern economy won’t understand how Asian Paints drives massive wealth creation. Those investors will continue waiting for the “right entry point” into Asian Paints.
Implication for investors
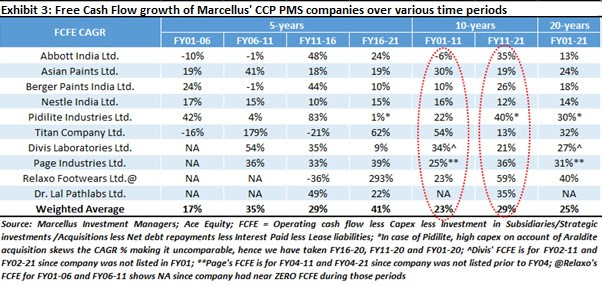
We could have provided here similar case studies of Bajaj Finance, of HDFC life, of HDFC Bank or of several other elite value creators (see Table 2 in the Appendix) which feature in our portfolios. Their compounding is underpinned by equally smart use of technology. Thanks to this dynamic, our investee companies have compounded FCFE at 25% over the last 20 years, at 29% over the last 10 years, and at 41% over the last 5 years. In fact, as shown in the table below, if you divide the last 20 years into 4 blocks of 5 years each, the exponential acceleration in the Free Cashflows of our investing companies is a powerful demonstration of the theories of John Sutton, Brian Arthur, Jonathan Haskel, and Stian Westlake (see table below from our latest Consistent Compounders newsletter):
The rise of giant companies, which are not only utterly dominant in the context of their specific industries but are also INCREASINGLY dominant in the context of the broader economy, poses a challenge to conventional valuation techniques (both relative and absolute). Whereas conventional valuation techniques assume that great companies fade to mediocrity over the course of 10-20 years, the evidence on hand in India suggests the converse (thus rendering ineffective conventional valuation techniques). This in turn is compelling investors to look for other more effective ways to assess the fair value of the Leviathans.
As Howard Marks said in January 2021 memo Something of Value: “It is worth noting with regard to truly dominant companies that are able to achieve rapid, durable and highly profitable growth that it is very, very hard to overprice them based on near-term multiples.”
As time progresses, the Consistent Compounders are likely to continue increasing their share of the total profit pie of India Inc. Hence traditional valuation metrics like P/E and P/B which value companies on the basis of near-term financial numbers are increasingly becoming less useful in a world where the main assets of elite compounders are intangible assets which are not present in their financial statements.
In his book “Microcosm” (1989), technology thinker George Gilder said, “The central event of the twentieth century is the overthrow of matter. In technology, economics, and the politics of nations, wealth in the form of physical resources is steadily declining in value and significance. The powers of mind are everywhere ascendant over the brute force of things.” Investing in the dozen or so companies that will drive 80% of the wealth creation in the Indian market in the coming decade, therefore, involves an in-depth understanding of the companies’ ability to make intelligent use of technology to build a dominant position in its sector. Investing in this manner is far harder than traditional P/E-based investing. For the same reason, investing in this manner is far more rewarding.
Note: Asian Paints, Pidilite Industries, Dr. Lal PathLabs, HDFC Bank, Abbott India, Berger Paints, Divis Laboratories, Titan Company, Page Industries, Relaxo Footwears, Nestle India, Bajaj Finance, Bajaj Finserv, Axis Bank, Tata Consultancy Services, Maruti Suzuki India, Kotak Mahindra Bank, and HDFC Life Insurance Company are part of many of Marcellus Investment Managers’ portfolios.
Nandita Rajhansa and Saurabh Mukherjea are part of the Investments team at Marcellus Investments Managers. Marcellus’ forthcoming book “Diamonds in the Dust: Consistent Compounding for Extraordinary Wealth Creation” will be published by Penguin in July.
|
|
|
|