OVERVIEW

If like us, you too are battling to deal with “recency bias” resulting from the steady negative news flow through the pandemic, you should know that a review of India’s progress across a battery of metrics across thirty years shows that relative to six other prominent developing countries, India has made steady progress. Clearly, more can be done in India especially on the poverty reduction front where India has lagged both large EMs and its neighbours but the broad message from the data is clear – India is NOT a flailing state.

In light of more than 300,000 deaths from Covid-19 so far, there is widespread despondency in India. This is compounded by the inability of almost everybody – barring the tech-savvy and the rich & the powerful – to get a Covid-19 vaccination slot. The situation has worsened because Indians are hearing from friends and relatives from across the world, that the developed world is vaccinating itself rapidly and life there is returning to normal gradually.

Patronising views regarding India have never been in short supply. For example, “India,” Winston Churchill once barked, “is merely a geographical expression. It is no more a single country than the Equator. Churchill was rarely right about India….” (Source: “From Midnight to the Millennium” by Shashi Tharoor).

Lant Pritchett, a development economist, said over the decade ago, “I argue that India is today a flailing state—a nation-state in which the head, that is the elite institutions at the national (and in some states) level remain sound and functional but that this head is no longer reliably connected via nerves and sinews to its own limbs” (Is India a flailing state? Detours on the four-lane highway to modernization, 2009).

Mohan Guruswamy, a policy analyst, is of the view that “The record of the Indian State in improving the living standards of the majority of its people is abysmal” and “on all infrastructure indices we are well below – forget China – even that failed state, Pakistan” (Source: Deccan Chronicle, 2018).

However, is India really a flailing state? Has the country become the hell hole that it is being made out to be? Or are we suffering from “recency bias”, which is the tendency to place too much emphasis on experiences that are freshest in your memory—even if they’re not the most relevant or reliable (read more here), given the traumatic events of the past 12 months? Let us take a look at the data.

(Note: Like millions of Indians, we too have lost loved ones over the past year. While loss of every life is tragic, we have been trying – for ourselves as much for our readers – to contextualise the events we have lived through over the past year.)

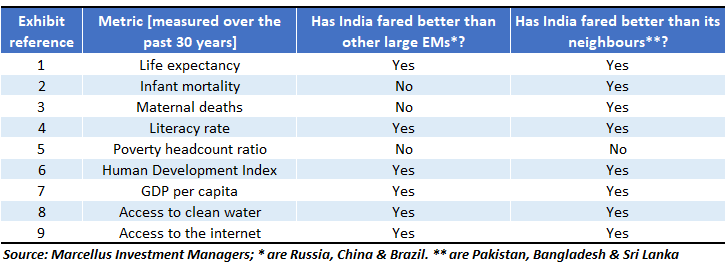
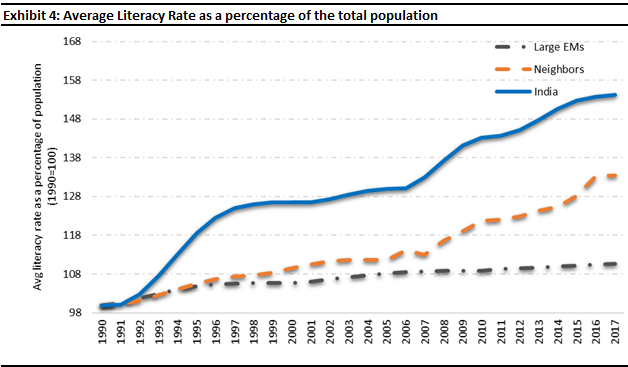
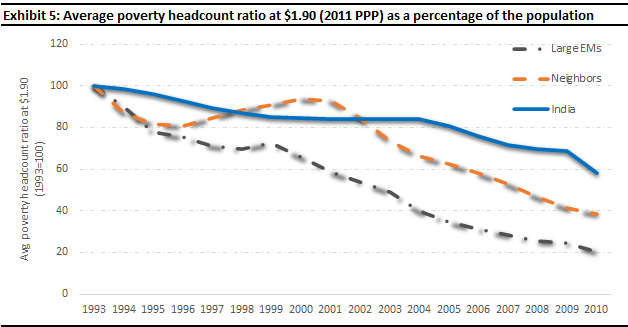
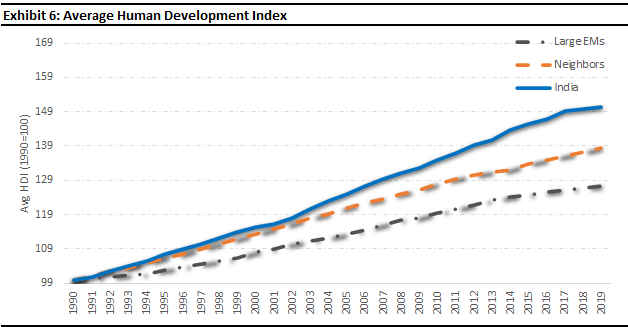
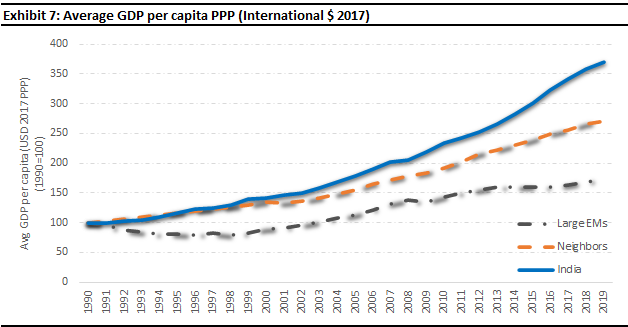
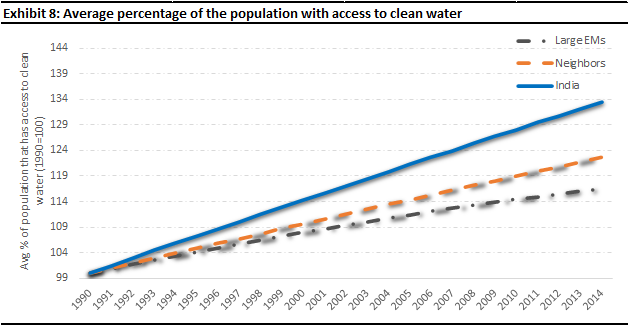
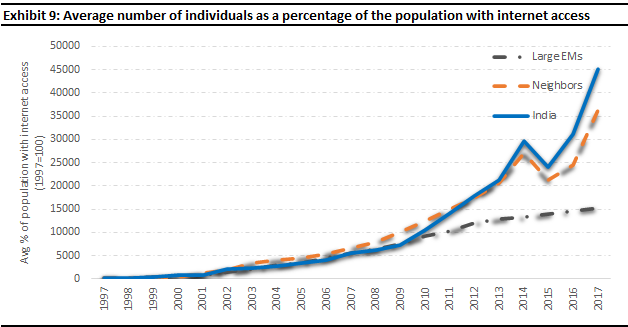
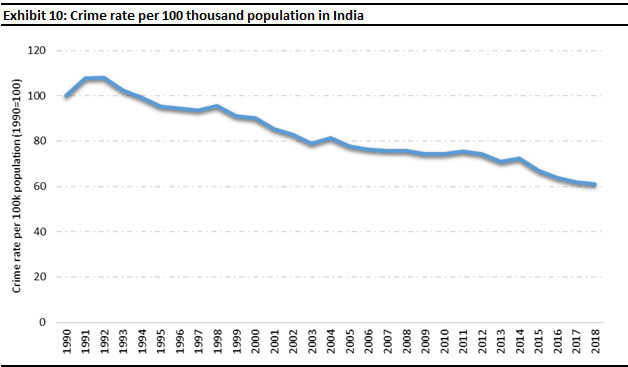
We analysed different metrics under broader categories like health, development, and social sectors. As shown in the charts below, in terms of the above indicators, India has improved steadily over the past 30 years. Most notably, India’s progress on these fronts has been, in general, superior to other large Emerging Markets (EMs) and to India’s immediate neighbours.

To compare India with other large EMs and its neighbouring countries, we chose 3 countries each under the large EMs (China, Russia, and Brazil) and neighbours (Sri Lanka, Bangladesh, and Pakistan) categories. Then we averaged the data under each of the metrics for both the groups (i.e., we averaged China, Russia, and Brazil for the “Large EMs” data series, and we averaged India’s 3 largest neighbours for the “Neighbours” data series). We then rebased everything to 1990 (wherever applicable) to build as accurate a picture as we could of India’s performance – relative to a range of other developing nations – on a range of indicators.

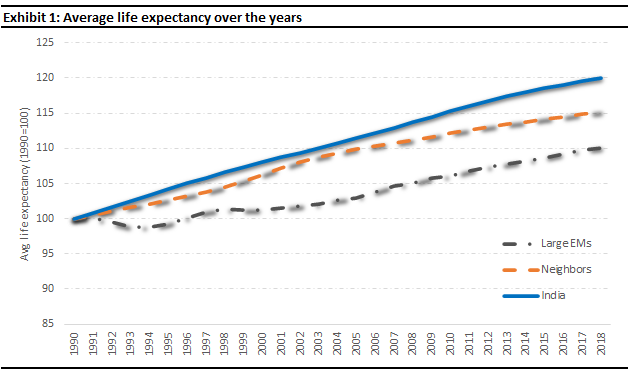
India’s performance on the health front has improved faster than one might imagine

Life Expectancy: Life expectancy at birth is the number of years a person is expected to survive. Exhibit 1 shows progress on this metric for India, large EMs and India’s neighbours

Source: World Bank database (data.worldbank.org/life-expectancy)

In the chart above, the rate of growth in life expectancy can be seen between 6 sets of countries on average and India. It is evident that India’s rate of growth – in terms of the number of years lived – has been the highest – even above that of the EMs – over the last 30 years.

Infant mortality: Infant mortality per 1000 live births is the measure of the number of deaths at birth for every 1000 live births. It has long been seen as a reliable measure of the ability of a state to provide basic health services to its people. Exhibit 2 shows progress on this metric for India in comparison to its neighbours and other large EMs. Whilst India has performed better than its neighbours, the other large EMs have performed significantly better than India on this front.

Source: World Bank database (data.worldbank.org/mortality-rate, infant)

Average maternal deaths: This metric measures the number of deaths related to pregnancy. Exhibit 3 shows this metric for India, large EMs, and India’s neighbours. Whilst in comparison to large EMs, India’s maternal mortality rate has not gone down as sharply, it has so when compared to its neighbours over the course of 25 years. Other metrics pertaining to health point to a similar conclusion i.e., relative to its neighbours, India has done better in providing basic health services to its citizens but relative to the large EMs, India has fallen behind.

Source: Our World in Data (ourworldindata.org/maternal deaths)

On all development Indicators, except the poverty rate, India has progressed well

Average literacy rate: This metric measures the number of people who are literate (over 15 years of age) as a percentage of the total population. Exhibit 4 shows this metric over the years for India, its neighbours, and large EMs. India clearly surpassed its neighbours and large EMs in terms of the rate of growth in literacy rate over the past three decades.

Source: World Bank database (data.worldbank.org/literacy rate)

Average poverty headcount ratio: This metric measures on average how many people live on less than $1.90 as a percentage of the population. Exhibit 5 shows the progress made by India, its neighbours, and large EMs. It is clear that whilst the poverty headcount ratio has been falling for all three sets of countries, India has been left behind by its neighbours and by large EMs. This in turn presumably adversely impacts a host of other metrics – like the health and mortality – of India’s poorest people.

Source: World Bank database (data.worldbank.org/poverty headcount)

Average Human Development Index (HDI): This metric is a mixture of three metrics – life expectancy, the standard of living at Gross National Income, and education in terms of expected and mean years of schooling. Exhibit 6 shows this composite index for India, India’s neighbours, and large EMs. The exhibit makes it amply clear that in terms of the rate of growth in HDI, India has beat both, its neighbours and large EMs over the last 30 years.

Source: United Nations Development Programme (hdr.undp.org)

Average GDP per capita (constant $ 2017 PPP): This metric measures GDP per capita that is converted to international dollars using purchasing power parity rates. It measures the overall income for countries on an equal footing. Exhibit 7 shows this data for India, its neighbours, and large EMs. The conclusion is self-evident from the chart

Source: World Bank database (data.worldbank.org/GDP-Per Capita-PPP)

Average percentage of population with access to clean water: This metric measures how many people as a percentage of the population have access to piped water on-premises and improved water resources. Exhibit 8 showing data for India, its neighbours, and large EMs. The rate of growth for India in case of access to clean water has jumped quite sharply over the years, surpassing that of its neighbours as well as other large EMs.

Source: Our World in Data (ourworldindata.org/water-access)

On social Indicators, like access to the internet and crime rate, India has performed well

Average number of individuals as a percentage of the population with access to the internet: This metric measures individuals as a percentage of the population that use the internet. Exhibit 9 shows data for this metric for India, its neighbours, and large EMs. Over the past decade, India has surpassed the rate of growth of its neighbours as well as large EMs in terms of giving its people access to the internet.

Source: World Bank database (data.worldbank.org/internet-access)

Crime rate per 100 thousand: This metric measures the number of crimes committed per 100 thousand population. We could not get reliable and comparable cross-country data on this. Exhibit 10 shows India’s trajectory with regards to reported crime

Source: Macrotrends (macrotrends.net/crime-statistics-IND)

Investment implications

Heuristics and biases often help people make quick judgement calls (which is why they are useful, and which is why we end up using them repeatedly). However, when it comes to investing, we need to be cautious about how such biases skew our judgment.  One of the most powerful biases all investors have to live with is “recency bias”. Given the events of the past year, it is but natural that most of us will be impacted by “recency bias”. According to Daniel Kahneman, the Nobel Laureate who wrote the blockbuster bestseller, Thinking Fast, and Slow, “the decision-making process is basically inferring from recent trends as if they were to continue. That seems to be the information that people go on and so when things have been getting worse for a while, you become pessimistic, and when things have been getting better for a while, you become optimistic, and it’s those feelings that really control the investment” (Source: Interview with Daniel Kahneman, 2013).

Hence if you are – like we are – battling to deal with recency bias you should know that a review of India’s progress across a battery of metrics across thirty years shows that relative to six other relevant developing countries, India has made steady progress. Clearly, more can be done in India especially on the poverty reduction front where it has lagged both large EMs and its neighbours, but the data is clear – India is not a flailing state.

Several of us in Marcellus have donated funds to this not-for-profit which is working to provide makeshift hospitals, oxygen and medicines available to as many Covid-19 patients as possible: https://www.ketto.org/fundraiser/sauceepigamiaandfriends

Nandita Rajhansa and Saurabh Mukherjea work in the Investments team in Marcellus Investment Managers (www.marcellus.in)

2024 © | All rights reserved.

Privacy Policy | Terms and Conditions