OVERVIEW
POPULAR ARTICLES
The top 20 profit generators in India (“the Leviathans”) now account for 90% of the country’s corporate profits. Beyond dominating the country’s profit pool, the Leviathans also reinvest these profits far more efficiently back into their businesses. By doing this over the last 25 years, the Leviathans have also widened the RoE gap between them and India Inc. Anyone who wants to succeed in the Indian stock market should therefore be focused on: (1) assessing how long the current Leviathans’ dominance can last; and (2) identifying the next generation of Leviathans.
“Capital is that part of wealth which is devoted to obtaining further wealth.” – Alfred Marshall and Mary Paley Marshall, The Economics of Industry, 1879
Our 13th May 2020 blog on ‘The Remaking of Indian Capitalism’
“The 20 Leviathans in India now generate 70% of the country’s profits, up from 14% thirty years ago. The rise of India’s networked economy (highways, cheap flights, broadband, GST) has allowed large, efficient firms to use superior technology & better access to capital to squash smaller competitors. In line with what is being seen in the US, the growing dominance of a handful of very large companies in India is changing the template of capitalism in India.” – Marcellus Investment Managers, 20th May 2020 (Click here for this blog)
The blog from which this quote is taken from attracted both global and local media attention (click here for article in The Economist based on our research, and here for the Business Today story on this subject). The discussions which then followed with economists, investors and companies in India allowed us to go deeper into this subject to understand the drivers of this unprecedented dominance of the Indian corporate landscape by a handful of companies. As our latest charts show, the dominance of the top 20 Leviathans grows by the passing year and is being enhanced by a variety of forces, some structural, others perhaps serendipitous.
Fresh research and updated charts show even greater dominance
In September 2019, the Government of India cut the corporate tax rate from 30% to 22%. This tax rate cut benefited large profitable companies more than it helped small, marginally profitable enterprises. As explained in our Oct’19 newsletter, large companies could then take these tax savings and re-invest them back in their businesses to further expand their powerful franchises.
In the second half of March 2020, economic activity in the country slowed down very sharply as the country went into the Covid-19 lockdown. Whilst the lockdown impacted all companies, for smaller companies it posed existential risks as it threatened to wipe out their modest reserves.
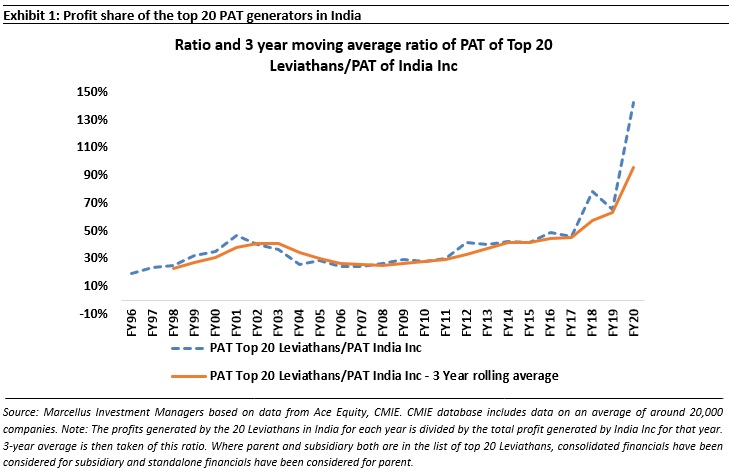
As shown in Exhibit 1 below, the corporate tax rate cut of September 2020 plus the adverse impact of Covid-19 on India Inc’s profits for Q4 FY20 meant that the profit share of the top 20 Leviathans zoomed up further in FY20.
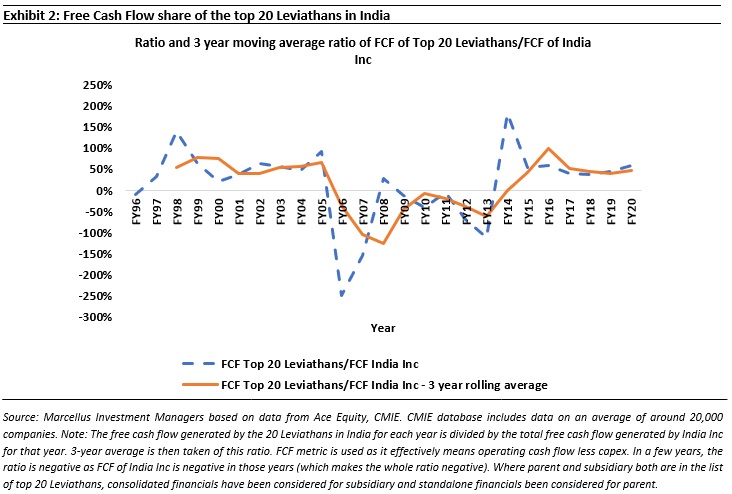
The top 20 Leviathans are also accounting for a growing share of the free cash flows generated by Indian companies. Nearly 60% of the country’s free cashflows now come from the top 20 Leviathans. However, the dominance of the top 20 Leviathans in terms of FCF is not nearly as marked as it is in PAT – see Exhibit 2.
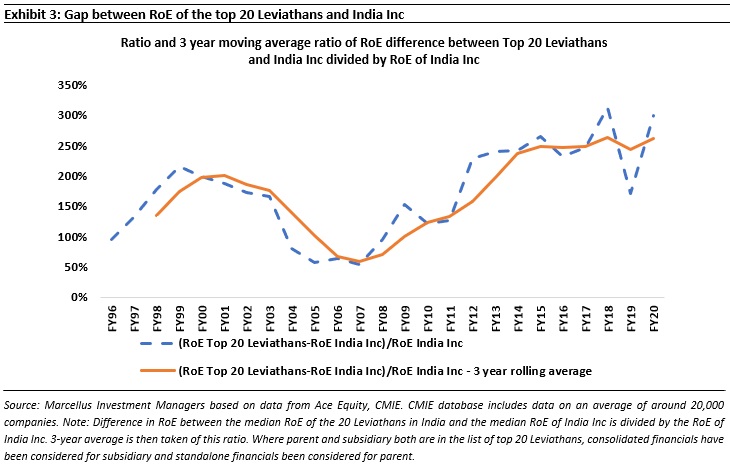
In order to understand the drivers of top 20 Leviathans’ dominance, we compared the ROEs of these firms with the rest of the country – see Exhibit 3. The last decade has seen a steady rise in the ROE superiority of the top 20 Leviathans. In FY20, the median ROE of the top 20 Leviathans was 17.2% whereas India Inc’s average ROE was a mere 4%! This means that the top 20 firms are not just putting greater amounts of money to work, they are also applying these larger sums of money far more effectively and far more profitably than the rest of India.
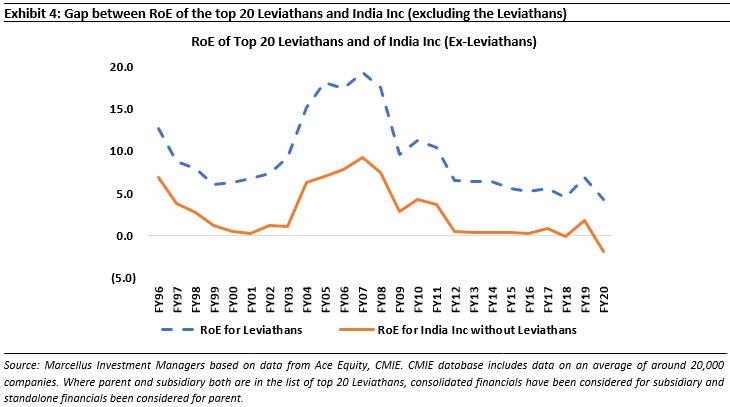
In fact, if the PAT and the networth of the Leviathans is removed from the RoE calculation for India Inc, then RoE for India Inc declines steeply and even becomes negative in FY20.
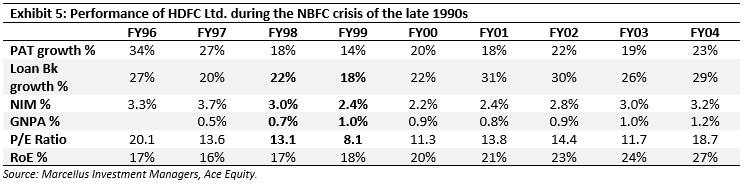
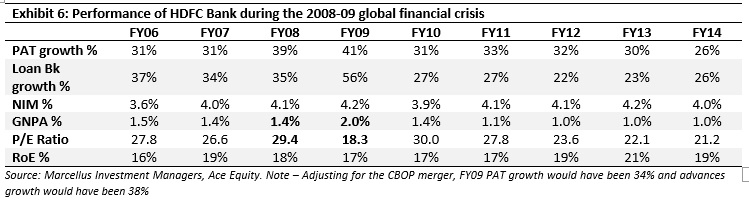
So what explains this rising dominance of the top 20 firms? A case study sheds light on this question. Let’s take HDFC Bank and HDFC Ltd., which occupy ranks number 3 & 4 respectively in the top 20 Leviathans list. The Covid-19 crisis, like the GFC in 2008 and the NBFC crisis of late 1990s, strengthened the position of these two well managed lenders – see Exhibits 5 & 6 below. In both these periods of crisis, whilst some competitors had to shut their shops and others had to retrench, these two lenders were able to sustain increased losses for an extended period of time, gain market share and then ride the wave of recovery. Similarly, as the Covid-19 crisis comes to an end, well capitalized lenders like Bajaj Finance, HDFC Bank, Kotak Bank are emerging as winners as:
- Their loan book growth accelerates whilst being funded by their high-quality liabilities franchise.
- Their NPA ratios fall materially; and
- Their net interest margins expand as these lenders are able to pick and choose borrowers.
(See our 27th July, 2020 “Introducing Kings of Capital – our financial sector PMS” blog on this subject)
Delving deeper into these two firms gives us more clues as to why the top 20 Leviathans are pulling away from the rest of corporate India:
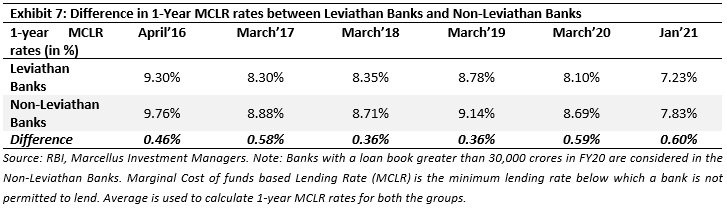
Superior access to capital: HDFC Bank’s FY20 Annual Report shows it average cost of funds to be 5.0%. However, the vast majority of Indian lenders will be lucky if they could access funds at even 7.5%. As crisis after crisis has buffeted India’s lending sector over the past five years, the advantage of the elite banks which in the top 20 Leviathans list – like HDFC Bank and Kotak Bank – has only strengthened. This can be seen in the following table where the Leviathan banks are able to lend money at much lower lending rates than their non-Leviathans counterparts.
HDFC Limited’s superior access to capital over the past 20 years has allowed it to seed and finance multiple market leading franchises in India such as HDFC Bank, HDFC Life, HDFC Ergo and HDFC Asset Management (see Marcellus’ 27th May 2020 blog). HDFC therefore epitomizes the Alfred Marshall quote given right at the beginning of this piece.
Superior access to talent & tech: The rising role of technology in driving not just business efficiencies, but also in underpinning competitive advantage, has played into the hands of the top 20 Leviathans. They have access to better talent and this allows them to build better technology which then allows them to hire better talent and invest more in tech. As explained in our Oct’20 newsletter: The ability of well-managed Indian firms to enter this virtuous loop of talent, tech & superior FCF generation is one the most potent factors driving the rise of the Leviathans:
“Bajaj Finance and HDFC Bank use their tech investments behind customer data collection and analysis to help complete credit assessment and provide loan approval to a new customer in a substantially shorter time period compared to other lenders. This is one of the strongest areas of differentiation for these firms.
Asian Paints uses proprietary historical demand data to accurately forecast demand for their products for every nook and corner of the country, for each day in a year. This helps Asian Paints delight the painters and paint dealers with ready availability of several thousand SKUs in a highly voluminous product category. That in turn delivers substantially higher inventory turns for these intermediaries (they are also the key decision makers who drive the end consumers’ choice of paint brand & colour).
The benefits highlighted for the lenders and Asian Paints here are akin to the ‘network effects’ that drive tech based businesses like Uber and Facebook. The more proprietary data Asian Paints and Bajaj Finance collect about customer demand, the sharper is their demand forecasting and customer understanding, and the wider is the gap between these CCP companies and their competitors.”
In contrast, as Sameer Arora of Syntel highlights, older Indian firms are reluctant to update their old IT systems because of the heavy capex involved and the need to provide training to the workforce (with many of the unionised workers themselves having no interest in being trained). This drags down the efficiency of these businesses and condemns them to low profitability and market share losses. India’s PSUs are an obvious example of this resistance to tech change (Link).
Greater access to the levers of policymaking: As the Indian economy has slowly but steadily liberalized over the past 20 years, the central Government, state governments and various regulators have obviously reached out to India Inc for their inputs. Both directly (through their access to the corridors of power) and indirectly (via trade bodies, where market leading firms clearly have more say than the minnows), market leading firms have had greater visibility on impending policy changes. This, it would appear, gives them an advantage when pathbreaking policy changes are announced in heavily regulated industries. As ‘The Economist’ put it in an article published in May 2020, “These are huge private companies with mediocre returns but a knack for navigating both India’s labyrinthine bureaucracy and its corridors of power. They operate in heavily regulated industries: Larsen & Toubro, an engineering group, builds roads; Hindustan Zinc, a subsidiary of London-listed Vedanta Resources, is a big miner.” As explained further on in this note, our analysis of churn in the ranks of the Leviathans suggest with the passage of time the ability to manage regulation is become LESS relevant for maintaining membership of the Leviathan club.
Superior ability/strength when it comes to dealing exogenous shocks: Over the past 30 years the Indian economy has not only become more integrated with global capital and trade flows, it has also transitioned from being socialist economy (which used to have Soviet-style 5 year plans) to a more free market economy (where the role of the state is gradually but steadily reducing). As result, Indian corporates are now far more exposed to exogenous shocks. These shocks can arise from the world outside India (eg. the GFC, Covid-19) and/or these shocks can arise from within India (eg. demonetisation, GST, the collapse of IL&FS/DHFL/etc.). The corporate performance of the Leviathans is more immune to these shocks than the performance of smaller companies because the Leviathans have stronger balance sheets (and better access to capital) and superior access to talent & tech (which, ironically, allows them to adjust to shocks like GST, Covid-19 quicker than their smaller competitors). So, in common with what happened to the USA and Japan in the decades where they transitioned from being closed economies to open industrial economies (in the USA this happened in the 50 years between 1880-1930 and in Japan this happened in the 40 years after World War II), the rise of the free market economy in India is hastening the ascendancy of the Leviathans as exemplified by the case study of HDFC and HDFC Bank given earlier in this note.
Churn in the top 20 Leviathans
Underneath the big picture of the rising dominance of the top 20 PAT generators is another story of churn: on an average, the decadal churn rate since FY02 has been 57% whereas the FY10-20 period saw the top 20 list churn by 45% i.e. just under half the names in the Leviathans list from ten years ago have now been replaced.
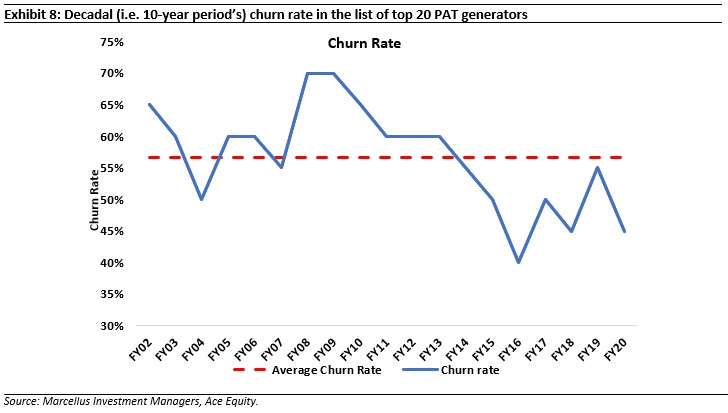
Here are the nine firms who have exited from the list between FY10 and FY20: Indian Oil, Bharti Airtel, Steel Authority of India, Reliance Communications, Bharat Heavy Electricals, Punjab National Bank, Hindalco, Sterlite Industries, Jindal Steel & Power.
And here are the nine firms which have entered between FY10 and FY20: HDFC Bank, HDFC, Coal India, Power Grid, HCL Tech, GAIL, Kotak Mahindra Bank, Power Finance Corporation, Hindustan Unilever.
Only the most cynical observers will have a problem with this sort of change. This churn tells us that the free market is working in India because:
- Every single exiting company is either a public sector entity and/or hails from a heavily regulated industry where manipulating the regulatory levers used to be the name of the game.
- Barring Coal India (which listed in FY11), Power Grid, GAIL and Power Finance Corporation, the majority of the entrants into the Leviathans list are private sector companies which have used skill, and superior access to capital, talent & technology to build world class businesses.
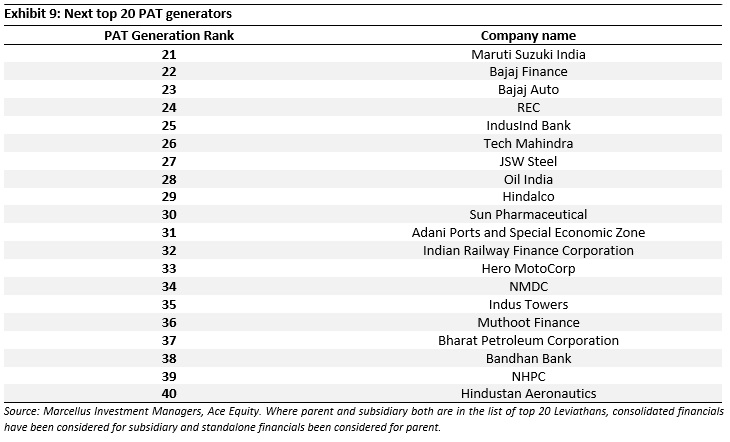
In fact as the number of public sector names in the top 20 list dwindle further from the current seven, more well run private sector companies are likely to enter. Obviously, it is more likely than not that these firms will come from the next 20 names on the list of India’s top PAT generators. So here are the next 20 names:
Investment Implications for how one views and values the Leviathan franchises
The rise of giant companies which are not only utterly dominant in the context of their specific industries but are also INCREASINGLY dominant in the context of the broader economy, poses a challenge to conventional valuation techniques (both relative and absolute). Whereas conventional valuation techniques assume that great companies fade to mediocrity over the course of 10-20 years, the evidence on hand in India suggests the converse (thus rendering ineffective conventional valuation techniques). This in turn is compelling investors to look for other more effective ways to assess the fair value of the Leviathans. We have listed below our thoughts on this critical subject with the caveat that for us too this area is “work in progress”.
Implication #1: The limitations of traditional relative valuation metrics like P/E and P/B
“It is worth noting with regard to truly dominant companies that are able to achieve rapid, durable and highly profitable growth that it is very, very hard to overprice them based on near-term multiples.” – Howard Marks in his January 2021 memo: Something of Value
As time progresses, the Leviathans are likely to continue increasing their share of the total profit pie of India Inc. Hence traditional valuation metrics like P/E and P/B which value companies on the basis of near term financial numbers are increasingly becoming less useful. These metrics value companies on the basis of its current or near-term estimated financials but, as highlighted above, the main assets for the Leviathans (superior access to capital, talent, tech) are not present in their financials.
Implication #2: Flawed use of the conventional DCF model
If traditional relative valuation metrics are flawed, one naturally turns to DCF models. However as highlighted in our Jan’20 Newsletter, even a conventional 3-stage DCF model is flawed. This happens because an analyst or an investor resorts to the traditional approach towards research by meeting the management, reading a couple of annual reports, talking to a few sellside analysts and doing some ground level checks. Post this basic exercise, while making a DCF model, the analyst or the investor will find it very difficult to forecast the high growth stage 1 phase beyond a 3 – 5 year period. Neither the analyst nor the investor will be able to forecast for a longer or for that matter even a shorter period. As a result, even the DCF model, as conventionally used by sell-side brokers and fund managers, becomes ineffective in valuing a Leviathan company.
Implication #3: Using DCF models which reflects qualitative information
A better way to value dominant market leading franchises we believe is to carefully calibrate the length of stage 1 in a typical 3-stage DCF model (where stage 2 is the fade period and stage 3 is perpetuity growth). In order to forecast the free cash flows of the company in stage 1 for a 15-30 year period, even the intangibles and the qualitative factors need to be incorporated in the DCF model. At Marcellus we have tried to develop a DCF model which helps us understand whether the stage 1 can be anywhere between 10-30 years depending on some key qualitative factors. The following excerpts from the relevant Marcellus newsletters will help our clients understand some of these factors:
- “Deep understanding of ‘sustainability’ of the moats of an organization – which reduces the probability of external disruptions that could de-rail the longevity of a franchise. Admittedly, this is hard to do. Even with our first-rate research team and even with the many decades of experience that we have of doing this and the access that we enjoy to an array of top experts in India, we have to work very hard to assess the “sustainability” of the moats around a business.” – Jan’20 newsletter
- “Lethargy Test Framework – The framework focuses on identifying the following signs of lethargy / complacency / indiscipline using secondary data research (annual reports, quarterly management commentary) as well as primary data checks (e.g. extensive discussions with ex-employees, channel partners, raw material vendors, customers, IT and HR consultants): 1. Lack of incremental deepening of moats and 2. The risk of capital misallocation”. – Aug’20 newsletter
- “Succession Planning Framework – Our succession planning framework assesses all portfolio companies around parameters such as the decentralization of power, the relevance of independent directors on the Board, and the empowerment of high quality CXOs in the organization. This assessment is one of the key inputs which drive our conviction around the longevity of a franchise, and hence on the prospects of consistent compounding of its share price.” – Sept’20 newsletter
Appendix: The top 20 PAT generators in India for the last 10 years –
Appendix
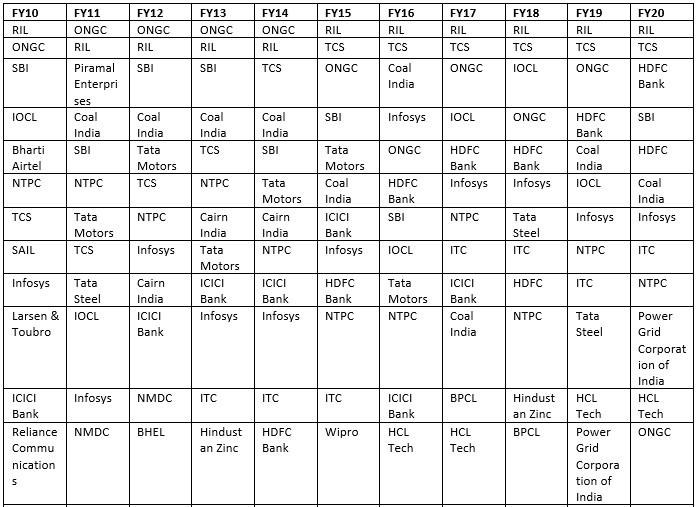
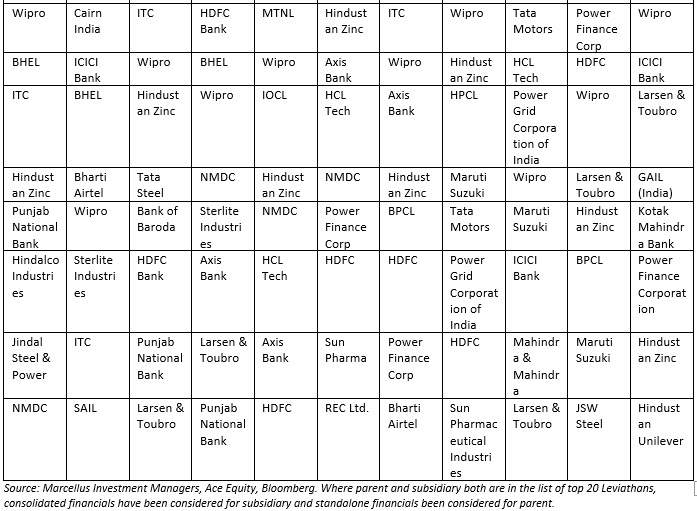
The following is the list of top 20 PAT generating companies from the year FY10 to FY20:
Note: HDFC Bank, Kotak Bank, TCS, Maruti Suzuki, Bajaj Finance, Axis Bank, HDFC Life, HDFC AMC, Asian Paints are part of many of Marcellus’ portfolios.
Saurabh Mukherjea and Harsh Shah are part of the Investments team at Marcellus Investment Managers (www.marcellus.in). Saurabh is also the author of ‘The Unusual Billionaires’ and of ‘Coffee Can Investing: The Low Risk Route to Stupendous Returns’