
OVERVIEW
POPULAR ARTICLES

Courtesy the face-off between China and the United States, India has a once-in-a-generation opportunity to become the factory of the world for knowledge-intensive light industrial manufacturing in sectors such as electronics, pharmaceuticals and specialty chemicals. However, India’s competitiveness is hindered by an effective corporate tax rate that is 4%-points higher than America’s or China’s. This higher tax rate makes India uncompetitive in key export-oriented sectors and creates the need for expensive policy interventions like PLIs. For India to decisively capture the China+1 opportunity and transform the employment prospects of tens of millions of Indians, a corporate tax rate cut, rather than PLIs, is a necessary and a sufficient pre-condition for take-off.
Early signs of a recovery in corporate capex…
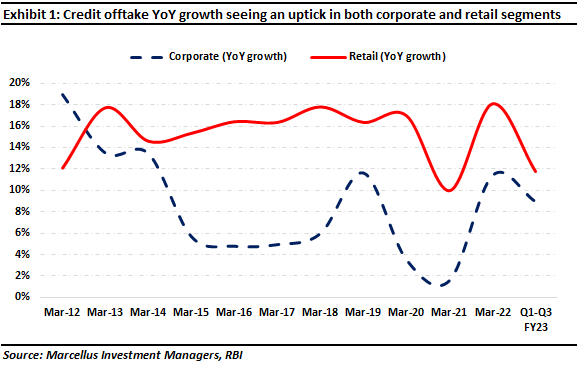
Corporate capital expenditure (or capex) in India has started to show some signs of recovering after nearly a decade of slowing down. This is evidenced by a slew of indicators, including but not limited to corporate credit offtake growth (see the dashed line in the chart below) – in FY22 this figure was in double digits after a gap of three years.
|
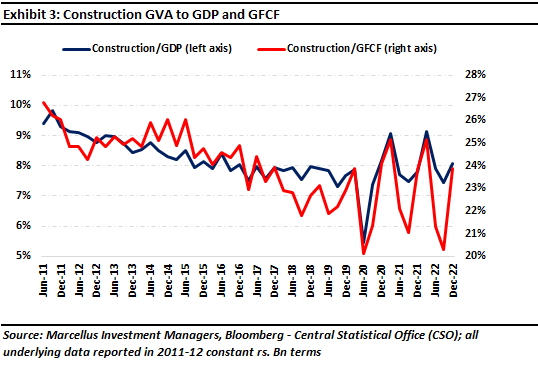
Delving deeper into corporate capex, we find that construction capex (which typically accounts for a quarter of the overall capex pie) is the area where the lack of dynamism is most worrisome. As shown by the exhibit below, construction capex has now been trending down over a decade now (both as a % of GDP and as a % of overall capex).
To be fair to the Government of India, it is trying through its own spending to juice up capex. In FY21, FY22, FY23, and FY24 (estimate), government capex has grown at 21%, 44%, 24%, and 37% respectively, significantly faster than both broader economic growth and faster than private sector capex (see here and here).
However, given the modest tax receipts of the Indian Exchequer (central government tax: GDP is a mere 12% compared to 25% for a developed country like, say, the UK), government capex is bound to be a small part of the overall capex pie in India (around 14%) and therefore cannot be expected to be the critical driver of capex growth in India. Corporate capex from the private sector has to be revved up to drive a sustainable economic recovery in India.
So, what can India do to get private sector capex revved up?
Economic theory suggests that the higher the corporate tax rate, the lower the incentive for a company to expedite capex. This theory is best understood by comparing the steel industry in United States and India.
As is well known, steel is a commodity and the price of steel is set by global supply-demand dynamics; no one company, regardless of how competitive it might be, is able to influence the global price of steel. The pre-tax profit margin of a well-managed integrated steel manufacturer tends to be around 18-20%. Furthermore, a $1bn capex for setting up a steel plant results in 1.3-1.4mn tons/annum of production capacity. Taking the current price/ton of steel ($750/ton), implies annual revenue generation of $1bn. Applying the pre-tax profit margin of 20% yields an annual PBT of $200 mn.
In America, this PBT becomes a PAT of $164 mn (applying an effective corporate tax rate of 18%). In India, on the other hand, this PBT becomes a PAT of $150 mn (applying an effective corporate tax rate of 22%). The steel plant owner therefore recovers his capex in America in 5 years versus 6 years in India (assuming a 10% growth rate and assuming that PBT margins remain stable at 20%).
In fact, there is a significant body of empirical work done by economists which shows that lower tax rates lead to accelerated corporate capex. For example:
- One of the most comprehensive cross-sectional studies on the subject was collectively conducted by the World Bank, PwC, and Harvard University. The team consisting of S. Djankov, T. Ganser, C. McLiesh, R. Ramalho, and A. Schleifer in 2004 established a significant and negative relationship between effective tax rates for companies and investments by them. To be specific, they found that a 10-percentage point increase in effective corporate tax rate results in roughly a 2-percentage point fall in aggregate investment to GDP ratio. (Djankov, S., Ganser, T., McLiesh, C., Ramalho, R., & Shleifer, A. (2010). The effect of corporate taxes on investment and entrepreneurship. American Economic Journal: Macroeconomics, 2(3), 31-64.)
- According to a research paper published by L. Dobbins and M. Jacob in 2016 in Germany, corporate tax cuts do indeed increase corporate investment and that domestic firms (more than foreign firms) benefit from such a change to quite some extent (source: Dobbins, L., & Jacob, M. (2016). Do corporate tax cuts increase investments?. Accounting and Business Research, 46(7), 731-759.)
- R.E. Hall and D.W. Jorgenson found that tax policy has a significant impact on the level of investments by firms and also their timing (Hall, R. E., & Jorgenson, D. W. (1967). Tax policy and investment behavior. The American economic review, 57(3), 391-414.).
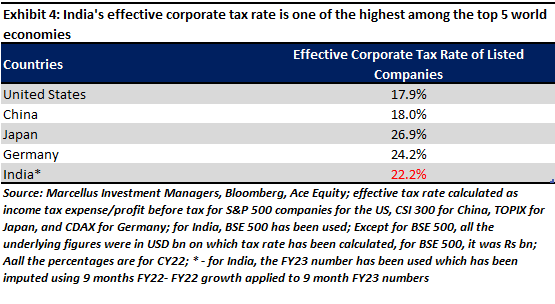
The Government of India has shown that it understands both the above theory and its practical implications. In 2019, the Ministry of Finance, Government of India, slashed the corporate tax rate to 25% from 35%. However, even after this slashing, India’s corporate tax rate is higher than that for the world’s two largest economies – USA and China (see exhibit below).
|
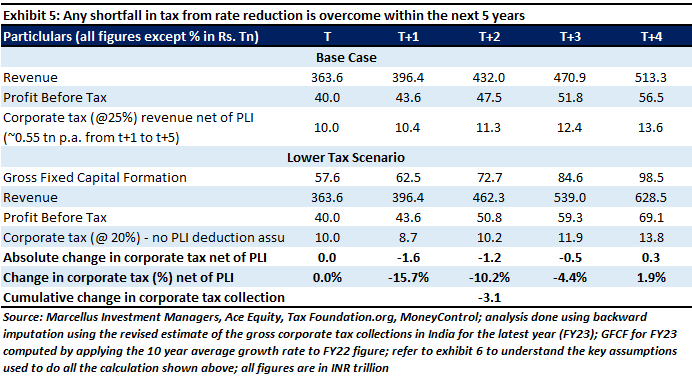
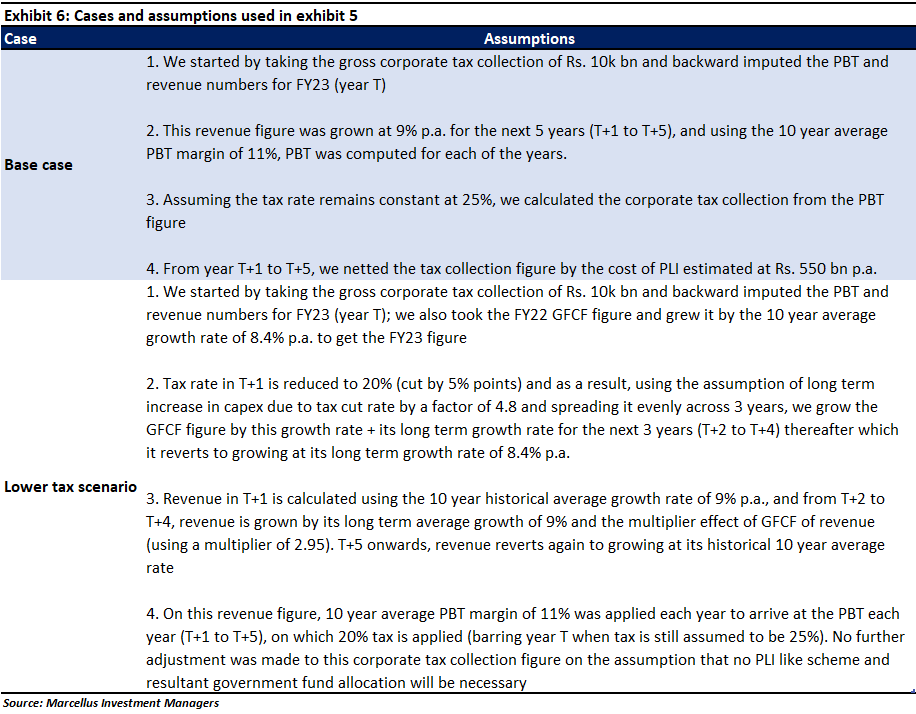
Courtesy the face-off between China and the United States, India has a once-in-a-generation opportunity to become the factory of the world for knowledge intensive light industrial manufacturing in sectors such as electronics, pharmaceuticals and specialty chemicals. However, India’s competitiveness is hindered by an effective corporate tax rate that is 4% points higher than America’s or China’s. This higher tax rate makes India uncompetitive in key export-oriented sectors and creates the need for expensive policy interventions like PLIs. For India to decisively capture the China+1 opportunity and transform the employment prospects of tens of millions of Indians, a corporate tax rate cut, rather than PLIs, is a necessary and a sufficient pre-condition for take-off.
Nandita Rajhansa and Saurabh Mukherjea work for Marcellus Investment Managers (www.marcellus.in).
If you want to read our other published material, please visit http://marcellus.in/resources/
Note: the above material is neither investment research, nor investment advice. Marcellus does not seek payment for or business from this material/email in any shape or form. Marcellus Investment Managers Private Limited (“Marcellus”) is regulated by the Securities and Exchange Board of India (“SEBI”) as a provider of Portfolio Management Services. Marcellus is also a US Securities & Exchange Commission (“US SEC”) registered Investment Advisor. No content of this publication including the performance related information is verified by SEBI or US SEC. If any recipient or reader of this material is based outside India and USA, please note that Marcellus may not be regulated in such jurisdiction and this material is not a solicitation to use Marcellus’s services. This communication is confidential and privileged and is directed to and for the use of the addressee only. The recipient, if not the addressee, should not use this material if erroneously received, and access and use of this material in any manner by anyone other than the addressee is unauthorized. If you are not the intended recipient, please notify the sender by return email and immediately destroy all copies of this message and any attachments and delete it from your computer system, permanently. No liability whatsoever is assumed by Marcellus as a result of the recipient or any other person relying upon the opinion unless otherwise agreed in writing. The recipient acknowledges that Marcellus may be unable to exercise control or ensure or guarantee the integrity of the text of the material/email message and the text is not warranted as to its completeness and accuracy. The material, names and branding of the investment style do not provide any impression or a claim that these products/strategies achieve the respective objectives. Further, past performance is not indicative of future results. Marcellus and/or its associates, the authors of this material (including their relatives) may have financial interest by way of investments in the companies covered in this material. Marcellus does not receive compensation from the companies for their coverage in this material. Marcellus does not provide any market making service to any company covered in this material. In the past 12 months, Marcellus and its associates have never i) managed or co-managed any public offering of securities; ii) have not offered investment banking or merchant banking or brokerage services; or iii) have received any compensation or other benefits from the company or third party in connection with this coverage. Authors of this material have never served the companies in a capacity of a director, officer or an employee.
This material may contain confidential or proprietary information and user shall take prior written consent from Marcellus before any reproduction in any form.