OVERVIEW
POPULAR ARTICLES

India’s capex has been stable at around 30-35% of GDP for much of the past decade. Tech investments are an increasingly large portion of India’s capex but are not being picked-up by the official data. Whilst Government data suggests that India’s capex stands at 30% of GDP, if we adjust for technology investments in the country, capex is already pushing towards 32% of GDP. As the unlock progresses, FY23 could be the year in which India returns to its pre-Lehman capex high of 35% of GDP.
A brief history of capex in India
Capital Expenditure (capex or Gross Fixed Capital Formation [GFCF] as Economists call it) started rising (as a % of Gross Domestic Product or GDP) in India in the 1990s and has stayed at relatively elevated levels pretty much throughout since then – see exhibit 1.
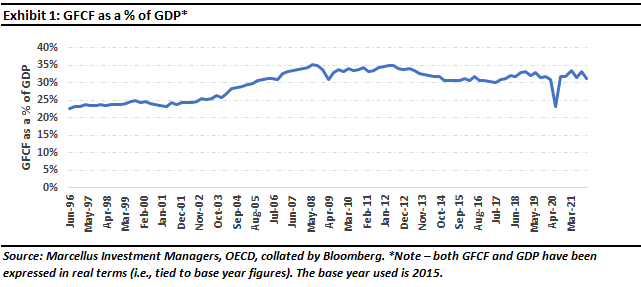
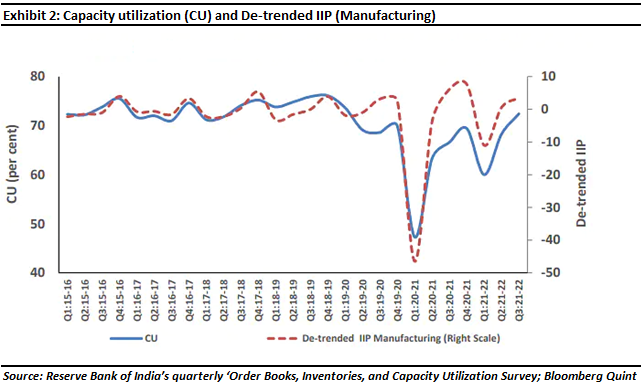
Except for the understandable dip during COVID induced lockdown months, not only has GFCF has stayed fairly stable over the last decade, according to the RBI’s latest data in Q3 FY22, capacity utilization in the Indian economy is already inching back towards its pre-pandemic levels (source: Capacity utilization inches back to pre-pandemic levels in Q3, 2022).
And yet there is this persistent angst that somehow capex in India is “low” and therefore India needs to see a “capex recovery”. According to an article in Forbes, “Public capex constitutes only 20 percent of the total capex, and the outlook for private investments—nearly 80 percent of total capex and which play a crucial role in expanding the economy and creating employment—remains lacklustre” (source: Will India’s 7.5 lakh crore capex solve its job crisis? Maybe not, 2022).
Capex formation is a slow process
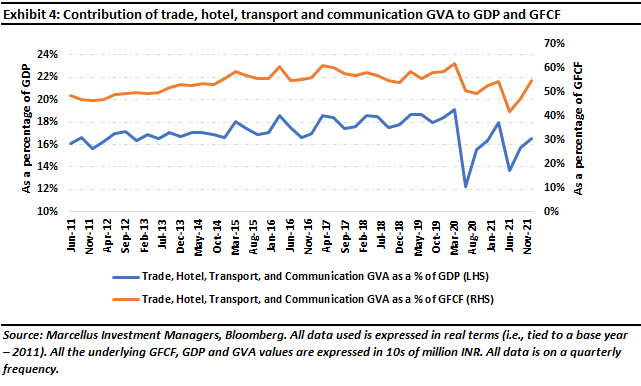
In fact, as per the way the government breaks capex (or GFCF) into its constituent components namely – construction, manufacturing, and software (communication and trade) – only construction gross value added (GVA) has seen a sustained downtrend in the last decade – see exhibit 3. In contrast, the largest component of capex – trade, transport, hotels, and communication (these sectors account for nearly 60% of capex) – has been steadily rising barring the COVID induced disruption – see exhibit 4.
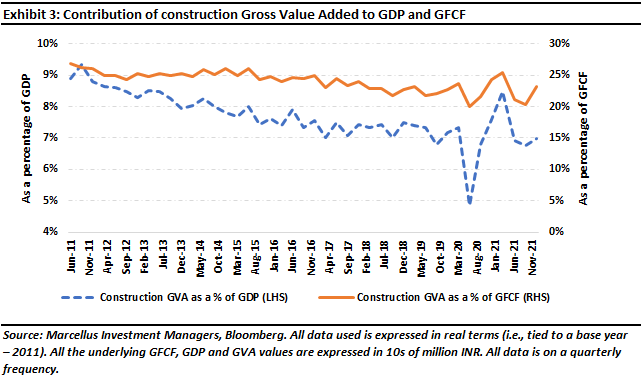
Since Construction capex (which accounts for around a quarter of India’s capex) arouses so much angst, it is worth focusing on this ten-year downtrend. As shown in exhibit 3, Construction capex fell from a peak of 9% of GDP a decade ago, to less than 5% during COVID. The drivers of this downtrend are well known and included overpriced residential real estate and a hamstrung banking system from 2013 to 2018.
However, here too there has been a sharp recovery in construction capex over the past year and Construction capex is now at 8% of GDP thanks to:
- The all-time low cost of home loans in India which is helping large home loan providers like HDFC and ICICI making record disbursals.
- Slashing of stamp duties in large states like Maharashtra, Karnataka, and West Bengal (source: Stamp duty reduction, Economic Times, 2021); and
- Record levels of government capex (around 3% of GDP in FY23 as per the Union Budget – source: Budget: FM announces 35% jump in FY23 capital expenditure to 7.5 lakh crore – Livemint, 2022).
We can already see the revival in construction capex in the 25-20% YOY revenue growth being posted by suppliers of building materials like Asian Paints, Pidilite and Ultratech.
However, anyone who has seen the massive machines being used to build the Mumbai metro or being used by the Government/NHAI for highway construction will realise that the era of construction sites employing thousands of low-skilled labourers are gone. We have an employment challenge in India because unskilled labour no longer has a starring role to play in construction capex or in the factories or offices of India. As a result, whilst overall employment in India has been unchanged over the past five years, formal sector employment (which can be seen as a proxy of skilled and semi-skilled employment) has jumped – as the exhibit below shows, 32 mn jobs have been created in the formal sector over the last three years (even as jobs have been destroyed in the informal sector).
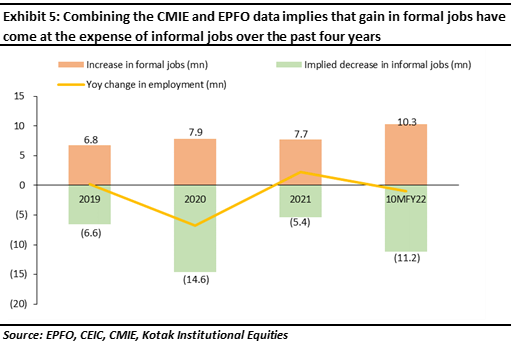
To put this number of 32 mn into context, France’s entire workforce is 30 mn! This elevated level of job creation in the formal sector in India validates the fact that the Government’s data on overall capex which has been stable at 30-35% of GDP over the past decade is driving both economic growth and job creation in the formal sector.
Technology is increasingly replacing traditional capex
The sectors which we focused on so far cover around three-fourths of India’s capex. The final fourth of capex in India is being driven by rising technology capex, which we believe is not being captured fully in the Government’s official capex data.
This new style of capex which is taking place in India is not being picked up by the official stats because of the way the Government accounts for capex. According to the Ministry of Corporate Affairs (MCA) in India, an intangible asset can be recognized only if it is in “development phase”, i.e., the product or service is intended to be used or sold commercially, if it can be quantified as to how they can produce future economic benefits, and expenditure on it can be measured meaningfully. If the product is in “research phase”, i.e., its future economic benefits cannot be attributed, it has to be expensed as an operating expense (source: Accounting Standard 26, Ministry of Corporate Affairs India).
Because of this nuance, any company in the country getting involved extensively in inventing and researching technology will have to take a hit on their income statement rather than creating a capital asset e.g., all of Marcellus’ spend on CRM systems, forensic accounting algorithms and its website is expensed through its P&L (even though we would argue this is just as expensive and as valuable as setting up a factory). So how significant are such spends in India and how meaningfully do they boost India’s overall capex?
India Inc’s spends on software and hardware are growing rapidly. For instance, Dell Technologies Inc’s India revenue was up by 64% YoY in CY 2021, and around 61% in the last quarter of CY 2021 (source: Dell Technologies India business grew 64% in year ended December 2021, 2021). Dell’s India revenue for CY 2019 grew by 18% YoY in comparison (source: Dell India revenue rises 18% to over $2 billion, 2019) Furthermore, even Lenovo reported that its India sales grew by 26.9% in the July-September 2021 quarter (source: Lenovo India registers 26.9% revenue growth in Q2, 2021).
This basically points towards the fact that India Inc is increasingly spending on tech, be it hardware or software and this trend has emerged in the last few years.
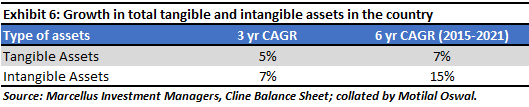
More generally, India Inc’s spends on investing in intangible assets are growing significantly faster than its spends on tangibles, as can be seen in exhibit 6 below.
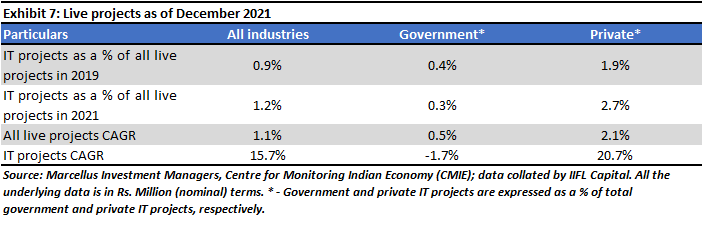
According to data from the CMIE, ongoing IT projects amount to 1.2% of all live projects in the country, and their CAGR from 2019 to 2021 has been around 16% p.a., as shown in exhibit 7.
Another way to sense-check the data is to look at Venture Capital investments in India – the vast majority of these are flowing into tech companies who in turn are launching apps and building intellectual property (around data, software, training, R&D, etc). The total value of Private Equity and Venture Capital investments in India was US$77bn i.e. 3% of GDP (source: https://economictimes.indiatimes.com/tech/funding/india-pe-vc-investments-exit-deals-at-an-all-time-high-for-2021-report/articleshow/88970383.cms?from=mdr). Even if one conservatively assumes that only half of this was used for investments in technology, that too suggests that tech capex is around 1.5% of GDP.
The official capex figure from the Government’s statistician for Q3 FY22 is 30% of GDP. To incorporate the tech capex, if we conservatively add 1.5% to the capex number published by Government, India’s capex figure is already pushing towards the 32% of GDP mark. As the unlock progresses further, this number is likely to move towards the pre-GFC high of 35%.
Investment implications
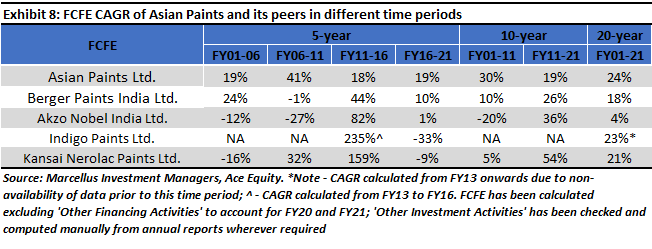
Across its portfolios, the companies that Marcellus invests in are increasingly investing in technology and in intangible assets. Such investments are critical to driving the competitive advantages of such companies and their ability to compound Free Cashflows at elevated levels. For example, as we have explained at length in our blog dated 24th June 2021, Three distinct layers of polarization, Asian Paints, which has extensively invested in technology over the years, has compounded its cash flows at a healthy rate and far more consistently vis-à-vis its industry peers, as evidenced by exhibit 8.
As explained in this blog, “In 1970, Asian Paints invested Rs. 8 crores in the first supercomputer to be purchased by a private-sector enterprise in India. That is the ‘sunk cost’ in this instance. Asian Paints then used this computer to collect detailed data on paint demand – across its vast dealer network, for every colour, for every truckload delivered to every dealer. As a result, Asian Paints’ management developed greater familiarity with understanding and managing data than any other paint company in India. Through the 1980s, 90s, and through to the current day, they fed this data into increasingly sophisticated software platforms such as SAP which helped them predict demand, time their raw material purchases and manage their inventory and production cycles such that the company’s working capital cycle in its decorative business (i.e., receivables + inventory – trade payables – other current liabilities) shrank to a mere six days in FY19 from a hundred days 25 years ago.
A super crunched working capital cycle gave Asian Paints a massive competitive advantage and superior free cashflows (7-9x more) compared to its competitors. Asian Paints re-invested these cashflows in expanding capacity (which has grown 15-fold in the last 25 years) and in further technology investments. For example, Asian Paints has used technology to optimize the cost and availability of raw material which forms around 60% of its total cost. More recently, the company forayed into the larger Home Décor space and offered 3D visualization technology at its ‘Beautiful Homes’ stores to help customers make a more informed choice. This blog on Cognizant’s website (click here) from 2018 nicely explains how Asian Paints has transformed various aspects of business through the use of technology.”
This dynamic creates a synergistic spiral which makes it difficult for Asian Paints’ competitors to compete with the firm (i.e., Asian Paints has better tech and more data and hence better cashflows which in turn leads to greater tech investments from Asian Paints which in turn leads more cash flow and so on).
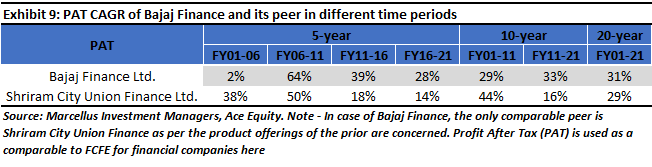
Let us look at finance companies like Bajaj Finance which has implemented a tech-enabled system as far as understanding the consumer needs are concerned. As a result, Bajaj Finance’s Profit After Tax (PAT) has not only stayed well ahead but also far more consistent than peers like Shriram City Union Finance Limited, as evidenced by exhibit 9.
As our Research team explained in one of our previous notes (see ‘Bajaj Finance: The Enigma Is Set For Another Transformation’, 2021): “While Bajaj Finance’s revamped consumer facing app will be launched later this year, we have learnt the following from our channel checks and the Company’s public disclosures about the app’s functionality, UI and what it is seeking to achieve. The app will consist of five different marketplaces that will be hosted on a single platform, thereby enabling customers to review, compare and buy a host of products & services across the electronics, insurance, investments and health categories. The five screens visible to users after they login to the app are, (i) The ‘EMI store’; (ii) The ‘Insurance Marketplace’; (iii) The ‘Investment Marketplace’ (iv) ‘BFL Health’; and (v) the ‘Broking App’. In addition to these 5 marketplaces customers will be able to checkout with Bajaj Pay which will offer all modes of payment including its EMI card, QR code, UPI, etc.”
Note: Asian Paints, Berger Paints, and Bajaj Finance are part of many of Marcellus’ portfolios. The authors and their families have a beneficial interest in the shares of these companies by dint of being clients of Marcellus.
Nandita Rajhansa and Saurabh Mukherjea are part of the Investments team in Marcellus Investment Managers.
Note: the above material is neither investment research, nor investment advice. Marcellus does not seek payment for or business from this material/email in any shape or form. Marcellus Investment Managers Private Limited (“Marcellus”) is regulated by the Securities and Exchange Board of India (“SEBI”) as a provider of Portfolio Management Services. Marcellus is also a US Securities & Exchange Commission (“US SEC”) registered Investment Advisor. No content of this publication including the performance related information is verified by SEBI or US SEC. If any recipient or reader of this material is based outside India and USA, please note that Marcellus may not be regulated in such jurisdiction and this material is not a solicitation to use Marcellus’s services. This communication is confidential and privileged and is directed to and for the use of the addressee only. The recipient, if not the addressee, should not use this material if erroneously received, and access and use of this material in any manner by anyone other than the addressee is unauthorized. If you are not the intended recipient, please notify the sender by return email and immediately destroy all copies of this message and any attachments and delete it from your computer system, permanently. No liability whatsoever is assumed by Marcellus as a result of the recipient or any other person relying upon the opinion unless otherwise agreed in writing. The recipient acknowledges that Marcellus may be unable to exercise control or ensure or guarantee the integrity of the text of the material/email message and the text is not warranted as to its completeness and accuracy. The material, names and branding of the investment style do not provide any impression or a claim that these products/strategies achieve the respective objectives. Further, past performance is not indicative of future results. Marcellus and/or its associates, the authors of this material (including their relatives) may have financial interest by way of investments in the companies covered in this material. Marcellus does not receive compensation from the companies for their coverage in this material. Marcellus does not provide any market making service to any company covered in this material. In the past 12 months, Marcellus and its associates have never i) managed or co-managed any public offering of securities; ii) have not offered investment banking or merchant banking or brokerage services; or iii) have received any compensation or other benefits from the company or third party in connection with this coverage. Authors of this material have never served the companies in a capacity of a director, officer or an employee.
This material may contain confidential or proprietary information and user shall take prior written consent from Marcellus before any reproduction in any form.